Booster Compressor Market (2026 - 2035)

ID: MRFR/EnP/29791-HCR
128 Pages
Priya Nagrale
Last Updated: August 07, 2026
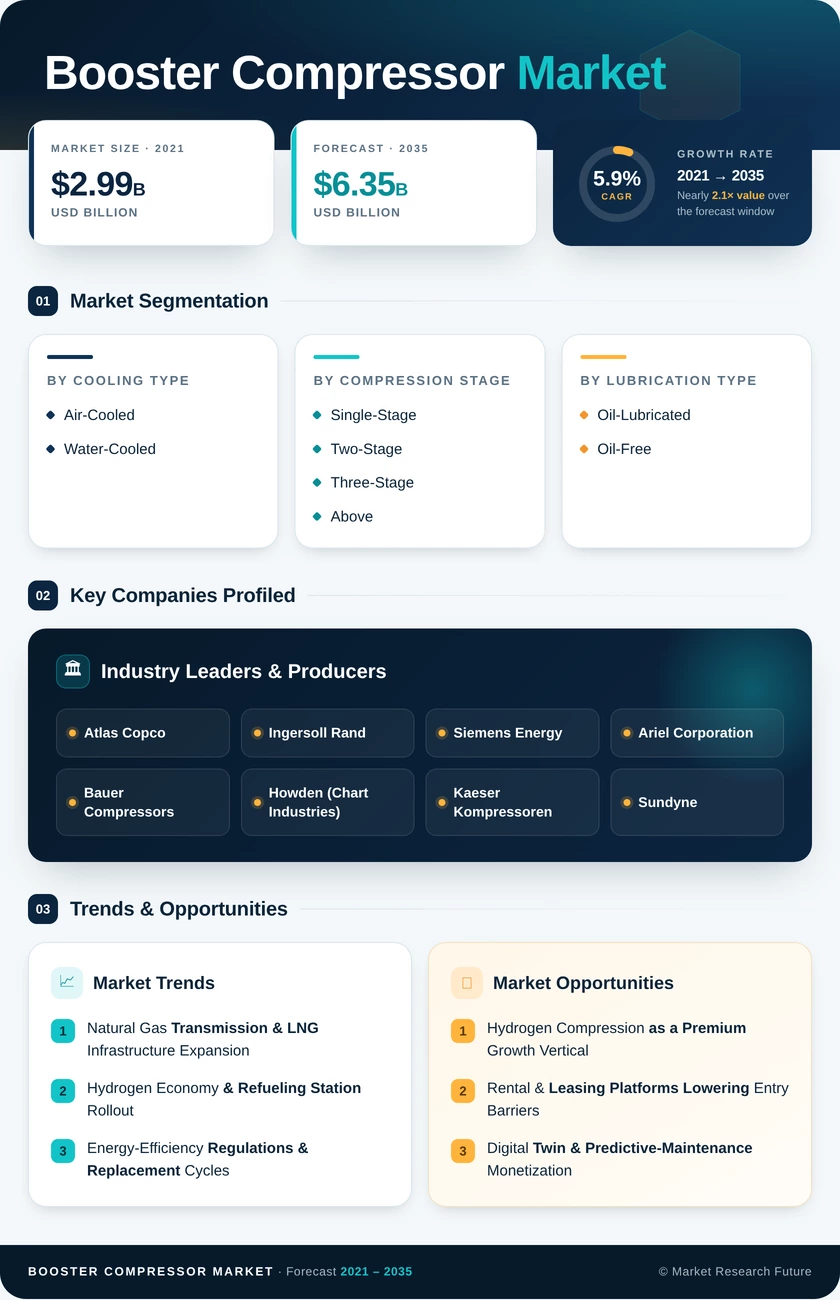
Booster Compressor Market Research Report By Cooling Type (Air-Cooled, Water-Cooled), By Compression Stage (Single-Stage, Two-Stage, Three-Stage and Above), By Lubrication Type (Oil-Lubricated, Oil-Free), By Pressure Range (21 to 40 Bar, 41 to 100 Bar, 101 to 350 Bar, Above 350 Bar), By End User (Oil and Gas, Manufacturing, Food and Beverage, Others) and By Regional (North America, Europe, South America, Asia Pacific, Middle East and Africa) - Forecast to 2035
Booster Compressor Market
Market Size
Forecast Period2026-2035
CAGR (2026-2035)5.9%
2025 Market SizeUSD 3.58 Billion
2035 Market SizeUSD 6.35 Billion
Key Players
Atlas Copco
Ingersoll Rand
Siemens Energy
Ariel Corporation
Bauer Compressors
Howden
Opportunities
  • Hydrogen Compression as a Premium Growth Vertical
  • Rental & Leasing Platforms Lowering Entry Barriers
  • Digital Twin & Predictive-Maintenance Monetization
  1. 1 Market Overview |
    1. 1.1 Study Assumptions & Market Definition |
    2. 1.2 Scope of the Study |
    3. 1.3 Research Methodology
  2. 2 Market Summary & Key Takeaways
  3. 3 Market Dynamics |
    1. 3.1 Market Drivers Analysis | |
      1. 3.1.1 Natural Gas Transmission & LNG Infrastructure Expansion | |
      2. 3.1.2 Hydrogen Economy & Refueling Station Rollout | |
      3. 3.1.3 Energy-Efficiency Regulations & Replacement Cycles | |
      4. 3.1.4 Manufacturing Automation & Process Intensification | |
      5. 3.1.5 Rental & Leasing Platform Growth | |
      6. 3.1.6 CO₂ Capture, Utilization & Storage (CCUS) Pilots | |
      7. 3.1.7 Food & Beverage Cold-Chain Modernization |
    2. 3.2 Market Restraints Analysis | |
      1. 3.2.1 High Upfront Capital & Installation Cost | |
      2. 3.2.2 Supply-Chain Bottlenecks for Specialty Alloys | |
      3. 3.2.3 Electrification Displacing Gas-Fired Processes | |
      4. 3.2.4 Skilled-Technician Shortage for Maintenance | |
      5. 3.2.5 Regulatory Permitting Delays for New Facilities |
    3. 3.3 Market Opportunity Analysis | |
      1. 3.3.1 Hydrogen Compression as a Premium Growth Vertical | |
      2. 3.3.2 Rental & Leasing Platforms Lowering Entry Barriers | |
      3. 3.3.3 Digital Twin & Predictive-Maintenance Monetization | |
      4. 3.3.4 CCUS and Enhanced Oil Recovery Demand | |
      5. 3.3.5 Emerging-Market Industrialization in Southeast Asia and Africa |
    4. 3.4 Industry Value Chain Analysis |
    5. 3.5 Porter's Five Forces Analysis
  4. 4 Global Booster Compressor Market Size & Forecast (2021–2035) |
    1. 4.1 Historical Market Size (2021–2025) |
    2. 4.2 Current & Forecast Market Size (2026–2035) |
    3. 4.3 Market Size by Revenue (USD Billion) |
    4. 4.4 Year-over-Year Growth Analysis
  5. 5 Segmentation Analysis |
    1. 5.1 By Cooling Type | |
      1. 5.1.1 Air-Cooled | |
      2. 5.1.2 Water-Cooled |
    2. 5.2 By Compression Stage | |
      1. 5.2.1 Single-Stage | |
      2. 5.2.2 Two-Stage | |
      3. 5.2.3 Three-Stage and Above |
    3. 5.3 By Lubrication Type | |
      1. 5.3.1 Oil-Lubricated | |
      2. 5.3.2 Oil-Free |
    4. 5.4 By Pressure Range | |
      1. 5.4.1 21 to 40 Bar | |
      2. 5.4.2 41 to 100 Bar | |
      3. 5.4.3 101 to 350 Bar | |
      4. 5.4.4 Above 350 Bar |
    5. 5.5 By End User | |
      1. 5.5.1 Oil and Gas | |
      2. 5.5.2 Manufacturing | |
      3. 5.5.3 Food and Beverage | |
      4. 5.5.4 Others
  6. 6 Regional Analysis |
    1. 6.1 North America | |
      1. 6.1.1 United States | |
      2. 6.1.2 Canada | |
      3. 6.1.3 Mexico |
    2. 6.2 Europe | |
      1. 6.2.1 Germany | |
      2. 6.2.2 United Kingdom | |
      3. 6.2.3 France | |
      4. 6.2.4 Italy | |
      5. 6.2.5 Spain | |
      6. 6.2.6 Nordic Countries | |
      7. 6.2.7 Russia | |
      8. 6.2.8 Rest of Europe |
    3. 6.3 Asia-Pacific | |
      1. 6.3.1 China | |
      2. 6.3.2 India | |
      3. 6.3.3 Japan | |
      4. 6.3.4 South Korea | |
      5. 6.3.5 ASEAN | |
      6. 6.3.6 Rest of Asia-Pacific |
    4. 6.4 South America | |
      1. 6.4.1 Brazil | |
      2. 6.4.2 Argentina | |
      3. 6.4.3 Rest of South America |
    5. 6.5 Middle East & Africa | |
      1. 6.5.1 Saudi Arabia | |
      2. 6.5.2 UAE | |
      3. 6.5.3 South Africa | |
      4. 6.5.4 Egypt | |
      5. 6.5.5 Rest of MEA
  7. 7 Competitive Landscape |
    1. 7.1 Market Share Analysis (2025) |
    2. 7.2 Competitive Benchmarking Matrix |
    3. 7.3 Company Profiles | |
      1. 7.3.1 Atlas Copco | |
      2. 7.3.2 Ingersoll Rand | |
      3. 7.3.3 Siemens Energy | |
      4. 7.3.4 Ariel Corporation | |
      5. 7.3.5 Bauer Compressors | |
      6. 7.3.6 Howden (Chart Industries) | |
      7. 7.3.7 Kaeser Kompressoren | |
      8. 7.3.8 Sundyne | |
      9. 7.3.9 Maximator GmbH | |
      10. 7.3.10 Corken (IDEX Corporation)
  8. 8 Future Outlook & Strategic Recommendations (2026–2035) |
    1. 8.1 AI-Driven Autonomous Compressor Operations |
    2. 8.2 Electrification of Compression Drive Systems |
    3. 8.3 Platform Economics & Servitization |
    4. 8.4 ESG Reporting & Methane-Reduction Mandates
  9. 9 Recent Developments & News
  10. 10 Frequently Asked Questions (FAQs)
  11. 11 Report Scope & Methodology |
    1. 11.1 Study Period & Base Year |
    2. 11.2 Data Sources & Citations |
    3. 11.3 Abbreviations
  12. 12 LIST OF TABLES |
  13. TABLE 1 Global Booster Compressor Market Size & Forecast, by Revenue (USD Billion), 2021–2035 |
  14. TABLE 2 Global Booster Compressor Market — Year-over-Year Growth Analysis, 2021–2035 |
  15. TABLE 3 Global Booster Compressor Market — Driver Impact Analysis, 2026–2035 |
  16. TABLE 4 Global Booster Compressor Market — Restraint Impact Analysis, 2026–2035 |
  17. TABLE 5 Global Booster Compressor Market Size, by Cooling Type, 2021–2035 (USD Billion) |
  18. TABLE 6 Global Booster Compressor Market Size, by Compression Stage, 2021–2035 (USD Billion) |
  19. TABLE 7 Global Booster Compressor Market Size, by Lubrication Type, 2021–2035 (USD Billion) |
  20. TABLE 8 Global Booster Compressor Market Size, by Pressure Range, 2021–2035 (USD Billion) |
  21. TABLE 9 Global Booster Compressor Market Size, by End User, 2021–2035 (USD Billion) |
  22. TABLE 10 Global Booster Compressor Market Size, by Region, 2021–2035 (USD Billion) |
  23. TABLE 11 North America Booster Compressor Market Size, by Country, 2021–2035 (USD Billion) |
  24. TABLE 12 Europe Booster Compressor Market Size, by Country, 2021–2035 (USD Billion) |
  25. TABLE 13 Asia-Pacific Booster Compressor Market Size, by Country, 2021–2035 (USD Billion) |
  26. TABLE 14 South America Booster Compressor Market Size, by Country, 2021–2035 (USD Billion) |
  27. TABLE 15 Middle East & Africa Booster Compressor Market Size, by Country, 2021–2035 (USD Billion) |
  28. TABLE 16 Competitive Benchmarking Matrix — Global Booster Compressor Market, 2025 |
  29. TABLE 17 Company Profiles — Key Players, Global Booster Compressor Market |
  30. TABLE 18 Recent Developments & Strategic Announcements, 2023–2025 |
  31. TABLE 19 Report Scope & Methodology Summary |
  32. TABLE 20 Detailed Sources and Citations |
  33. TABLE 21 North America Booster Compressor Market Size, by Cooling Type, 2021–2035 (USD Billion) |
  34. TABLE 22 North America Booster Compressor Market Size, by Compression Stage, 2021–2035 (USD Billion) |
  35. TABLE 23 North America Booster Compressor Market Size, by Lubrication Type, 2021–2035 (USD Billion) |
  36. TABLE 24 North America Booster Compressor Market Size, by Pressure Range, 2021–2035 (USD Billion) |
  37. TABLE 25 North America Booster Compressor Market Size, by End User, 2021–2035 (USD Billion) |
  38. TABLE 26 Europe Booster Compressor Market Size, by Cooling Type, 2021–2035 (USD Billion) |
  39. TABLE 27 Europe Booster Compressor Market Size, by Compression Stage, 2021–2035 (USD Billion) |
  40. TABLE 28 Europe Booster Compressor Market Size, by Lubrication Type, 2021–2035 (USD Billion) |
  41. TABLE 29 Europe Booster Compressor Market Size, by Pressure Range, 2021–2035 (USD Billion) |
  42. TABLE 30 Europe Booster Compressor Market Size, by End User, 2021–2035 (USD Billion) |
  43. TABLE 31 Asia-Pacific Booster Compressor Market Size, by Cooling Type, 2021–2035 (USD Billion) |
  44. TABLE 32 Asia-Pacific Booster Compressor Market Size, by Compression Stage, 2021–2035 (USD Billion) |
  45. TABLE 33 Asia-Pacific Booster Compressor Market Size, by Lubrication Type, 2021–2035 (USD Billion) |
  46. TABLE 34 Asia-Pacific Booster Compressor Market Size, by Pressure Range, 2021–2035 (USD Billion) |
  47. TABLE 35 Asia-Pacific Booster Compressor Market Size, by End User, 2021–2035 (USD Billion) |
  48. TABLE 36 South America Booster Compressor Market Size, by Cooling Type, 2021–2035 (USD Billion) |
  49. TABLE 37 South America Booster Compressor Market Size, by Compression Stage, 2021–2035 (USD Billion) |
  50. TABLE 38 South America Booster Compressor Market Size, by Lubrication Type, 2021–2035 (USD Billion) |
  51. TABLE 39 South America Booster Compressor Market Size, by Pressure Range, 2021–2035 (USD Billion) |
  52. TABLE 40 South America Booster Compressor Market Size, by End User, 2021–2035 (USD Billion) |
  53. TABLE 41 Middle East & Africa Booster Compressor Market Size, by Cooling Type, 2021–2035 (USD Billion) |
  54. TABLE 42 Middle East & Africa Booster Compressor Market Size, by Compression Stage, 2021–2035 (USD Billion) |
  55. TABLE 43 Middle East & Africa Booster Compressor Market Size, by Lubrication Type, 2021–2035 (USD Billion) |
  56. TABLE 44 Middle East & Africa Booster Compressor Market Size, by Pressure Range, 2021–2035 (USD Billion) |
  57. TABLE 45 Middle East & Africa Booster Compressor Market Size, by End User, 2021–2035 (USD Billion)
  58. 13 LIST OF FIGURES |
  59. FIGURE 1 Global Booster Compressor Market Dynamics — Drivers, Restraints, and Opportunities |
  60. FIGURE 2 Industry Value Chain Analysis — Booster Compressor Market |
  61. FIGURE 3 Porter's Five Forces Analysis — Global Booster Compressor Market |
  62. FIGURE 4 Global Booster Compressor Market Size Trend & Forecast (USD Billion), 2021–2035 |
  63. FIGURE 5 Global Booster Compressor Market Share, by Cooling Type, 2025 (%) |
  64. FIGURE 6 Global Booster Compressor Market Share, by Compression Stage, 2025 (%) |
  65. FIGURE 7 Global Booster Compressor Market Share, by Lubrication Type, 2025 (%) |
  66. FIGURE 8 Global Booster Compressor Market Share, by Pressure Range, 2025 (%) |
  67. FIGURE 9 Global Booster Compressor Market Share, by End User, 2025 (%) |
  68. FIGURE 10 Global Booster Compressor Market Share, by Region, 2025 (%) |
  69. FIGURE 11 North America Booster Compressor Market Share, by Country, 2025 (%) |
  70. FIGURE 12 Europe Booster Compressor Market Share, by Country, 2025 (%) |
  71. FIGURE 13 Asia-Pacific Booster Compressor Market Share, by Country, 2025 (%) |
  72. FIGURE 14 South America Booster Compressor Market Share, by Country, 2025 (%) |
  73. FIGURE 15 Middle East & Africa Booster Compressor Market Share, by Country, 2025 (%) |
  74. FIGURE 16 Competitive Landscape — Market Share Analysis, 2025 |
  75. FIGURE 17 Competitive Benchmarking Radar — Top 10 Players

Segmentation Quick Reference

DimensionSub-SegmentsDominant SegmentFastest Growing Segment
Cooling TypeAir-Cooled, Water-CooledAir-CooledWater-Cooled
Compression StageSingle-Stage, Two-Stage, Three-Stage and AboveSingle-StageThree-Stage and Above
Lubrication TypeOil-Lubricated, Oil-FreeOil-LubricatedOil-Free
Pressure Range21–40 Bar, 41–100 Bar, 101–350 Bar, Above 350 Bar21–40 BarAbove 350 Bar
End UserOil and Gas, Manufacturing, Food and Beverage, OthersOil and GasFood and Beverage
GeographyNorth America, Europe, Asia-Pacific, South America, Middle East & AfricaAsia-PacificAsia-Pacific


Market Segmentation Overview

By Cooling Type

Sub-SegmentKey Trend
Air-CooledPreferred for remote installations; benefits from compact skid-mounted designs
Water-CooledGaining ground in continuous-duty hydrogen and petrochemical applications requiring precise thermal management


Air-cooled systems continue to lead the installed base due to their simplicity and independence from water infrastructure. Water-cooled units are increasingly specified in high-utilization settings where consistent discharge temperatures improve seal longevity and gas purity.

By Compression Stage

Sub-SegmentKey Trend
Single-StageStandard for moderate pressure-ratio applications such as CNG refueling and plant-air boosting
Two-StageBalances cost and performance for midstream gas gathering and refrigeration duties
Three-Stage and AboveRequired for 700–900 bar hydrogen dispensing and supercritical CO₂ transport


Three-stage and above configurations represent the fastest-growing category as hydrogen infrastructure scales and CCUS projects demand sequential compression with intercooling.

By Lubrication Type

Sub-SegmentKey Trend
Oil-LubricatedCost-effective and broadly adopted across general industrial and upstream operations
Oil-FreeMandated in food-grade, pharmaceutical, and hydrogen applications where contamination is unacceptable


Oil-free technology carries higher upfront cost but delivers lower lifecycle expense in applications requiring high-purity gas output.

By Pressure Range

Sub-SegmentKey Trend
21–40 BarLargest segment by volume; serves CNG and general process-air boosting
41–100 BarCore range for gas gathering, midstream processing, and industrial nitrogen supply
101–350 BarGrowing via hydrogen storage, diving-gas, and specialty-chemical applications
Above 350 BarFastest-growing niche driven by 700 bar and 900 bar hydrogen refueling stations


The pressure spectrum above 350 bar is small today but expanding rapidly as hydrogen dispensing at 700 bar becomes the global standard for heavy-duty fuel-cell vehicles.

By End User

Sub-SegmentKey Trend
Oil and GasLargest consumer; compression needed for gas lift, pipeline transmission, LNG, and EOR
ManufacturingRising demand from semiconductor, pharmaceutical, and automated-process-gas systems
Food and BeverageFastest-growing vertical; CO₂ recovery, carbonation, modified-atmosphere packaging
OthersHealthcare oxygen supply, mining ventilation, marine, and data-center cooling-gas applications


Food and beverage is emerging as the standout growth vertical, driven by global cold-chain modernization and tightening food-safety regulations that require food-grade compressed gases.




Download PDF ×

We do not share your information with anyone. However, we may send you emails based on your report interest from time to time. You may contact us at any time to opt-out.