• Cat-intel
  • MedIntelliX
  • Resources
  • About Us
  • Request Free Sample ×

    Kindly complete the form below to receive a free sample of this Report

    Leading companies partner with us for data-driven Insights

    clients tt-cursor
    Hero Background

    Canada Visual Analytics Market

    ID: MRFR/ICT/60109-HCR
    200 Pages
    Aarti Dhapte
    October 2025

    Canada Visual Analytics Market Research Report By Component (Software, Services), By Deployment (On-Demand, On-Premise) and By Industry (IT, Retail, BFSI, Manufacturing, Military & Defense, Transportation & Logistics, Others)-Forecast to 2035

    Share:
    Download PDF ×

    We do not share your information with anyone. However, we may send you emails based on your report interest from time to time. You may contact us at any time to opt-out.

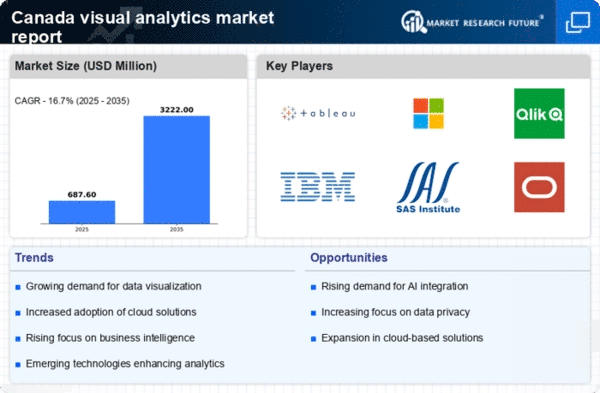
    Canada Visual Analytics Market Infographic
    Purchase Options

    Canada Visual Analytics Market Summary

    The Canada Visual Analytics market is poised for substantial growth, projected to reach 2415.2 USD Million by 2035.

    Key Market Trends & Highlights

    Canada Visual Analytics Key Trends and Highlights

    • The market valuation for Canada Visual Analytics is estimated at 441.9 USD Million in 2024.
    • By 2035, the market is expected to expand to 2415.2 USD Million, indicating robust growth potential.
    • The compound annual growth rate (CAGR) for the period from 2025 to 2035 is projected at 16.7%.
    • Growing adoption of visual analytics technologies due to increasing data-driven decision-making is a major market driver.

    Market Size & Forecast

    2024 Market Size 441.9 (USD Million)
    2035 Market Size 2415.2 (USD Million)
    CAGR (2025-2035) 16.7%

    Major Players

    Oracle, Microsoft, SAS Institute, SAP, Qlik, TIBCO Software, ThoughtSpot, Sisense, Alteryx, Tableau Software, Domo, MicroStrategy, IBM

    Canada Visual Analytics Market Trends

    The Canada Visual Analytics Market is experiencing significant trends that are being driven by the growing demand for data-driven decision-making in a variety of sectors. The significance of visual analytics in comprehending intricate data sets is being acknowledged by numerous Canadian organizations. This is fostering a trend in which businesses are investing in sophisticated data visualization tools that facilitate data interpretation and improve insights.

    Additionally, the proliferation of digital transformation initiatives among Canadian enterprises is a substantial factor, as organizations endeavor to increase efficiency and broaden their operational capabilities by utilizing analytics. There is an increasing opportunity for visual analytics solutions to flourish as the government of Canada promotes open data initiatives. The availability of public datasets and the initiative to promote transparency in data will be advantageous to analytics service providers who can generate visually appealing representations that are easily comprehensible.

    Additionally, Canadian sectors such as finance, healthcare, and retail are increasingly utilizing visual analytics to identify patterns and trends, resulting in improved operational performance. The integration of artificial intelligence and machine learning into visual analytics platforms has also been a recent trend, which has enabled the development of more sophisticated predictive analytics capabilities.

    Market Segment Insights

    Canada Visual Analytics Market Segment Insights

    Canada Visual Analytics Market Segment Insights

    Visual Analytics Market Component Insights

    Visual Analytics Market Component Insights

    The Canada Visual Analytics Market is experiencing significant growth, particularly within the Component segment, which encompasses Software and Services. As organizations in Canada increasingly recognize the value of data-driven decision-making, the demand for visual analytics solutions has surged. Software plays a critical role in this sector, providing users with tools to transform complex datasets into intuitive visual representations, thereby enhancing understanding and insights.

    The increasing reliance on big data and the Internet of Things (IoT) across various industries, including finance, healthcare, and retail, is driving the expansion of software applications designed for visual analytics.Meanwhile, Services in the visual analytics market also hold substantial importance as they encompass consulting, implementation, and training, ensuring that organizations can effectively leverage these advanced technologies.

    This support is crucial for businesses that may lack in-house expertise in data analysis. Additionally, both Software and Services are pivotal for facilitating real-time data analysis and fostering a data culture within organizations, enabling them to respond swiftly to market changes. As Canada embraces digital transformation, the visualization of data insights is expected to be instrumental in shaping strategies and improving operational efficiencies.

    With a growing emphasis on enhancing customer experiences and optimizing business performance, this segment is poised for remarkable advancements, evidencing the critical role that visual analytics play in the overall success of Canadian enterprises. The ability of visual analytics to simplify complex information and deliver actionable insights serves as a foundational pillar for the growth in the Canada Visual Analytics Market, making these components essential for modern business practices.

    Visual Analytics Market Deployment Insights

    Visual Analytics Market Deployment Insights

    The Deployment segment of the Canada Visual Analytics Market plays a crucial role in how organizations implement and utilize visual analytics solutions. The market has been witnessing a steady rise, driven by the increasing demand for data-driven decision-making across various industries including healthcare, finance, and retail. There are two primary deployment models: On-Demand and On-Premise, each offering distinct advantages.

    On-Demand deployment provides flexibility and ease of access, allowing organizations to leverage cloud computing for real-time analytics without the need for extensive hardware investment.This model has gained traction among small and medium-sized enterprises looking for cost-effective solutions.

    Conversely, On-Premise deployment is favored by larger organizations that prioritize data security and have stringent compliance requirements, as it allows complete control over their data infrastructure.

    As organizations in Canada continue to embrace digital transformation, the choice between these deployment methods will significantly impact their ability to harness insights from vast data sets. The growing emphasis on data visualization and analytics will further bolster the relevance and significance of these deployment options in enhancing operational efficiency and strategic planning.

    Visual Analytics Market Industry Insights

    Visual Analytics Market Industry Insights

    The Canada Visual Analytics Market exhibits significant potential across various industries, underscoring its relevance and application in today's data-driven environment. In particular, the industry segment comprises diverse sectors such as Information Technology (IT), Retail, Banking, Financial Services and Insurance (BFSI), Manufacturing, Military and Defense, Transportation and Logistics, among others. The IT sector has seen rising demand for data visualization solutions to enhance decision-making and operational efficiency. Retail businesses leverage visual analytics to better understand customer behavior and optimize inventory management.

    The BFSI segment highlights the importance of data analytics in risk assessment and fraud detection, ensuring stability and security in financial operations. Manufacturing increasingly utilizes visual analytics for process optimization and predictive maintenance, fostering operational efficiency. In Military and Defense, data visualization plays a critical role in mission planning and resource allocation. Furthermore, Transportation and Logistics sectors employ visual analytics to streamline supply chain logistics and improve service delivery.

    The growing emphasis on data insights across these industries is a driving factor for the overall development of the Canada Visual Analytics Market, pointing towards enhanced market growth opportunities bolstered by technological advancements and shifting business needs. This diversified application of visual analytics ensures that the industry segment remains a vital driver within the Canada Visual Analytics Market landscape, positioning it for further exploration and investment.

    Get more detailed insights about Canada Visual Analytics Market Research Report-Forecast to 2035

    Key Players and Competitive Insights

    The Canada Visual Analytics Market is experiencing robust growth, driven by the increasing reliance on data-driven decision-making across various industries. Businesses are continually seeking to enhance their analytical capabilities, leading to a heightened demand for advanced visual analytics solutions that can transform complex data into actionable insights. In this competitive landscape, the market is characterized by a blend of established players and emerging companies offering innovative solutions tailored to meet the diverse needs of Canadian enterprises.

    The rapid evolution of technology, particularly in artificial intelligence and machine learning, is further influencing the dynamics of this market, as companies strive to leverage these advancements for superior analytical outcomes. Understanding the competitive landscape is crucial for stakeholders as they navigate opportunities for collaboration, expansion, and differentiation within this vibrant sector.Oracle holds a significant position in the Canada Visual Analytics Market, marked by its strong reputation for providing comprehensive data solutions and analytics tools.

    The company's suite of visual analytics products is characterized by advanced capabilities that allow users to glean meaningful insights from vast datasets efficiently. Oracle's deep integration with cloud services and enterprise resource planning solutions enhances its attractiveness to Canadian businesses seeking scalable and robust analytics tools. The company leverages its extensive experience in data management and analytics to offer a seamless user experience, ensuring that organizations can derive value from their data effortlessly.

    Additionally, Oracle's commitment to innovation translates into regular updates and enhancements for its visual analytics products, keeping pace with evolving market demands and technological advancements.Microsoft, another major player in the Canada Visual Analytics Market, has solidified its presence with products designed to empower organizations with insightful data visualizations and analytics. Microsoft Power BI is a key service that is widely adopted across various Canadian industries for its intuitive design and powerful analytical capabilities. By providing tools that easily integrate with existing Microsoft platforms and cloud services, Microsoft streamlines the process of data visualization for Canadian businesses.

    The company's strengths lie in its ability to continuously enhance its product offerings, including the incorporation of artificial intelligence features that augment data analysis. Moreover, Microsoft's strategic partnerships and acquisitions within the analytics space contribute to its ability to deliver cutting-edge solutions that address the specific needs of the Canadian market. With a strong focus on user-friendly interfaces and accessibility, Microsoft remains a preferred choice for organizations aiming to harness the power of visual analytics in Canada.

    Key Companies in the Canada Visual Analytics Market market include

    Industry Developments

    In December 2023, Qlik acquired Mozaic Data, a U.S.-based AI-driven startup that offers enhanced governance and decentralized "data-as-a-product" architecture. This expanded Qlik's capacities by incorporating Mozaic's analytics data product platform, thereby providing Canadian and global enterprises with a more efficient, AI-enabled data workflow.In 2024, Qlik expanded its analytics and data-management tools by incorporating Talend, a significant data integration and data quality company, into its portfolio.

    This move is expected to improve the offerings available to Canadian organizations.OpenText Corporation implemented AI-powered generative content and analytics tools in its Digital Experience Platform (DXP) and Web Content Management portfolio throughout 2024. These tools were designed to optimize content workflow and personalization for Canadian enterprises.

    Market Segmentation

    Visual Analytics Market Industry Outlook

    • IT
    • Retail
    • BFSI
    • Manufacturing
    • Military & Defense
    • Transportation & Logistics
    • Others

    Visual Analytics Market Component Outlook

    • On-Demand
    • On-Premise

    Visual Analytics Market Deployment Outlook

    • IT
    • Retail
    • BFSI
    • Manufacturing
    • Military & Defense
    • Transportation & Logistics
    • Others

    Report Scope


    Report Attribute/Metric Source: Details
    MARKET SIZE 2023 378.66(USD Million)
    MARKET SIZE 2024 441.9(USD Million)
    MARKET SIZE 2035 2415.2(USD Million)
    COMPOUND ANNUAL GROWTH RATE (CAGR) 16.696% (2025 - 2035)
    REPORT COVERAGE Revenue Forecast, Competitive Landscape, Growth Factors, and Trends
    BASE YEAR 2024
    MARKET FORECAST PERIOD 2025 - 2035
    HISTORICAL DATA 2019 - 2024
    MARKET FORECAST UNITS USD Million
    KEY COMPANIES PROFILED Oracle, Microsoft, SAS Institute, SAP, Qlik, TIBCO Software, Mode Analytics, ThoughtSpot, Sisense, Alteryx, Tableau Software, Domo, MicroStrategy, IBM, Looker
    SEGMENTS COVERED Component, Deployment, Industry
    KEY MARKET OPPORTUNITIES Growing demand for data-driven insights, Increasing adoption of AI technologies, Expansion in healthcare analytics, Rising need for real-time data visualization, Enhanced focus on customer experience analytics
    KEY MARKET DYNAMICS growing demand for data insights, increasing adoption of AI technologies, rising importance of data visualization, enhanced user engagement features, expanding cloud computing integration
    COUNTRIES COVERED Canada

    FAQs

    What is the expected market size of the Canada Visual Analytics Market in 2024?

    The Canada Visual Analytics Market is expected to be valued at 441.9 million USD in 2024.

    What will the market value of the Canada Visual Analytics Market be in 2035?

    In 2035, the Canada Visual Analytics Market is projected to reach a value of 2415.2 million USD.

    What is the expected CAGR for the Canada Visual Analytics Market from 2025 to 2035?

    The Canada Visual Analytics Market is expected to grow at a CAGR of 16.696% from 2025 to 2035.

    Which segment of the Canada Visual Analytics Market has a higher market valuation in 2024?

    In 2024, the Software component of the Canada Visual Analytics Market is valued at 265.0 million USD.

    What will be the market value for the Services component of the Canada Visual Analytics Market in 2035?

    The Services segment is expected to be valued at 1015.2 million USD in 2035.

    Who are the major players in the Canada Visual Analytics Market?

    Key players in the market include Oracle, Microsoft, SAS Institute, SAP, Qlik, TIBCO Software, and others.

    What opportunities are driving growth in the Canada Visual Analytics Market?

    Increased data usage and demand for data-driven decision-making are key growth drivers in the market.

    What challenges are currently faced by the Canada Visual Analytics Market?

    Challenges include data privacy concerns and the need for skilled professionals in visual analytics.

    What impacts have recent global scenarios had on the Canada Visual Analytics Market?

    Current global scenarios may affect supply chains and data accessibility, impacting the market positively or negatively.

    Which application areas are experiencing significant adoption in the Canada Visual Analytics Market?

    Key application areas include business intelligence, marketing analytics, and operational analytics.

    Download Free Sample

    Kindly complete the form below to receive a free sample of this Report

    Case Study
    Chemicals and Materials