×
  • Cat-intel
  • MedIntelliX
  • Resources
  • About Us
  • Hero Background
    English
    Chinese
    French
    Japanese
    Korean
    German
    Spanish

    Cannabis Plant Nutrients Market Trends

    ID: MRFR/FnB/9479-CR
    167 Pages
    Snehal Singh
    July 2023

    Cannabis Plant Nutrients Market Research Report Information by Nutrients Type (Macronutrients and Micronutrients), Category (Conventional and Organic), Mode of Application (Drenching, Fertigation, and Foliar), And by Region (North America, Europe, Asia-Pacific, and Rest of the World) - Forecast Till 2030

    Share:
    Download PDF ×

    We do not share your information with anyone. However, we may send you emails based on your report interest from time to time. You may contact us at any time to opt-out.

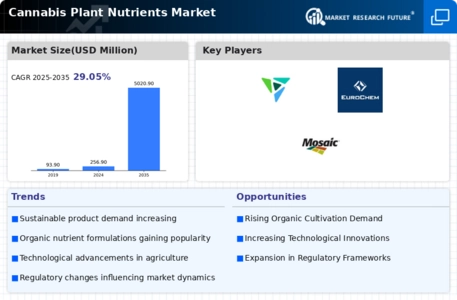
    Cannabis Plant Nutrients Market Infographic
    Purchase Options

    Market Trends

    Key Emerging Trends in the Cannabis Plant Nutrients Market

    The increasing recognition of the manifold benefits associated with cannabis has led to its legalization in several countries. There is substantial evidence supporting the legitimate medical applications of cannabinoids, spanning indications such as alleviating nausea and vomiting linked to chemotherapy, managing spasticity in multiple sclerosis, addressing HIV/AIDS cachexia, and mitigating neuropathic pain. A pivotal moment in the United States unfolded on June 28, 2018, when the Agriculture Improvement Act of 2018, commonly referred to as the Farm Bill, was officially passed by the US Senate. This legislative milestone brought about a reclassification of hemp for commercial utilization and removed hemp-derived CBD from the controlled substance list. Significantly, it conferred regulatory authority for hemp production to both states and the federal government, marking a paradigm shift in the treatment of hemp-related activities.

    In the wake of the 2018 Farm Bill, the Agricultural Marketing Service (AMS) was designated as the primary agency within the United States Department of Agriculture (USDA) to oversee the newly established USDA Hemp Production Program. This transformative legislation dictated that hemp, once considered an illicit substance under the purview of the Justice Department, would now be managed as a legitimate crop by the Department of Agriculture. This change reflected a broader acknowledgment of the economic and industrial potential of hemp, particularly in the form of CBD-derived products.

    Further underscoring the momentum towards cannabis normalization, the Ohio Senate took a decisive step on March 28, 2019, by unanimously passing Senate Bill-57. This legislation empowered farmers in Ohio to cultivate industrial hemp under a three-year license granted by the Ohio Department of Agriculture. The bill also introduced licensing requirements for cannabis processors, mandated testing of hemp products, and addressed the incorporation of cannabis products into consumables like food, beverages, and cosmetics. This multifaceted approach not only facilitates hemp cultivation but also ensures a regulated and safe entry of cannabis derivatives into various consumer products.

    In Europe, the production of cannabis is legal in several countries, albeit with certain constraints on usage. Notably, the Czech Republic legalized medical cannabis in 2013, albeit with a limitation of 180 grams of dry matter per month. The regulatory landscape for cannabis across Europe is diverse, with individual countries establishing specific rules and restrictions. According to EU law, CBD products are constrained to containing no more than 0.2% tetrahydrocannabinol (THC), highlighting the stringent regulatory framework within the European Union.

    Considering the current global scenario, it is evident that the legalization of cannabis production and associated products in various countries is poised to catalyze the growth of the global cannabis plant nutrients market. The legislative strides made in different regions not only reflect evolving societal attitudes toward cannabis but also present significant opportunities for the industry stakeholders during the review period. The changing legal landscape, especially with the recognition of hemp as a legitimate crop, underscores the potential for substantial growth in the cannabis market, aligning with the increasing acceptance and understanding of its diverse applications.

    Author
    Snehal Singh
    Assistant Manager - Research

    High acumen in analyzing complex macro & micro markets with more than 6 years of work experience in the field of market research. By implementing her analytical skills in forecasting and estimation into market research reports, she has expertise in Packaging, Construction, and Equipment domains. She handles a team size of 20-25 resources and ensures smooth running of the projects, associated marketing activities, and client servicing.

    Leave a Comment

    FAQs

    What is the current valuation of the Cannabis Plant Nutrients Market?

    The market valuation was 256.85 USD Million in 2024.

    What is the projected market size for the Cannabis Plant Nutrients Market by 2035?

    The market is projected to reach 4246.37 USD Million by 2035.

    What is the expected CAGR for the Cannabis Plant Nutrients Market during the forecast period?

    The expected CAGR for the market from 2025 to 2035 is 29.05%.

    Which companies are considered key players in the Cannabis Plant Nutrients Market?

    Key players include Scotts Miracle-Gro, Advanced Nutrients, and General Hydroponics, among others.

    What are the main types of nutrients in the Cannabis Plant Nutrients Market?

    The market segments include macronutrients and micronutrients, with valuations of 2130.0 and 2116.37 USD Million, respectively.

    How is the Cannabis Plant Nutrients Market categorized?

    The market is categorized into conventional and organic nutrients, with both segments valued at approximately 2130.0 and 2116.37 USD Million.

    What are the primary modes of application for cannabis nutrients?

    The main modes of application are drenching, fertigation, and foliar, with fertigation valued at 1740.0 USD Million.

    Market Summary

    As per MRFR analysis, the Cannabis Plant Nutrients Market Size was estimated at 256.85 USD Million in 2024. The Cannabis Plant Nutrients industry is projected to grow from 331.46 USD Million in 2025 to 4246.37 USD Million by 2035, exhibiting a compound annual growth rate (CAGR) of 29.05 during the forecast period 2025 - 2035.

    Key Market Trends & Highlights

    The Cannabis Plant Nutrients Market is experiencing a dynamic evolution driven by sustainability and technological advancements.

    • There is a notable shift towards organic nutrients, particularly in North America, as consumers prioritize sustainability.
    • Technological advancements in nutrient delivery systems are enhancing efficiency and effectiveness, especially in the Asia-Pacific region.
    • Customization of nutrient solutions is becoming increasingly popular, catering to the specific needs of growers in diverse environments.
    • The increasing legalization of cannabis and rising consumer awareness of quality are major drivers propelling market growth, particularly in the macronutrients and organic segments.

    Market Size & Forecast

    2024 Market Size 256.85 (USD Million)
    2035 Market Size 4246.37 (USD Million)
    CAGR (2025 - 2035) 29.05%
    Largest Regional Market Share in 2024 Asia Pacific

    Major Players

    <p>Scotts Miracle-Gro (US), Advanced Nutrients (CA), General Hydroponics (US), FoxFarm Soil & Fertilizer Company (US), Canna (NL), Humboldt Nutrients (US), BioBizz (NL), Green Planet Nutrients (CA), Nutrifield (AU)</p>

    Market Trends

    The Cannabis Plant Nutrients Market is currently experiencing a dynamic evolution, driven by increasing consumer awareness regarding the importance of optimal plant nutrition for enhancing yield and quality. As cultivation practices become more sophisticated, growers are increasingly seeking specialized nutrient solutions tailored to the unique needs of cannabis plants. This shift is indicative of a broader trend towards precision agriculture, where the focus is on maximizing efficiency and sustainability in cultivation. Furthermore, the rise of organic and eco-friendly products is influencing purchasing decisions, as consumers show a preference for environmentally responsible options. In addition, regulatory changes across various regions are shaping the landscape of the Cannabis Plant Nutrients Market. As legalization efforts gain momentum, more growers are entering the market, leading to heightened competition and innovation. This influx of new entrants is likely to drive the development of advanced nutrient formulations that cater to diverse growing environments and methodologies. Overall, the Cannabis Plant Nutrients Market appears poised for continued growth, with evolving consumer preferences and regulatory frameworks playing pivotal roles in its trajectory.

    Shift Towards Organic Nutrients

    There is a noticeable trend towards the adoption of organic nutrients within the Cannabis Plant Nutrients Market. Growers are increasingly prioritizing sustainable practices, leading to a demand for products that are free from synthetic chemicals. This shift not only aligns with consumer preferences for organic produce but also reflects a broader commitment to environmental stewardship.

    Technological Advancements in Nutrient Delivery

    Innovations in nutrient delivery systems are emerging as a key trend in the Cannabis Plant Nutrients Market. Advanced formulations and application methods, such as slow-release and water-soluble nutrients, are gaining traction. These technologies enhance nutrient absorption and reduce waste, thereby improving overall plant health and yield.

    Customization of Nutrient Solutions

    The trend towards customization is becoming prominent in the Cannabis Plant Nutrients Market. Growers are increasingly seeking tailored nutrient solutions that address specific growth stages and environmental conditions. This demand for personalized products is driving manufacturers to develop specialized formulations that cater to the diverse needs of cannabis cultivation.

    Cannabis Plant Nutrients Market Market Drivers

    Increasing Legalization of Cannabis

    The ongoing trend of legalization across various regions appears to be a primary driver for the Cannabis Plant Nutrients Market. As more countries and states embrace cannabis for both medicinal and recreational use, the demand for high-quality plant nutrients is likely to surge. This shift not only encourages new growers to enter the market but also compels existing cultivators to enhance their production quality. According to recent data, the number of legal cannabis markets has expanded significantly, with projections indicating a potential market size of over 70 billion dollars by 2028. This burgeoning market creates a fertile ground for nutrient suppliers, who must adapt their offerings to meet the diverse needs of a growing customer base.

    Rising Consumer Awareness of Quality

    Consumer awareness regarding the quality of cannabis products is on the rise, which significantly impacts the Cannabis Plant Nutrients Market. As consumers become more educated about the benefits of organic and high-quality nutrients, they are increasingly demanding products that enhance the growth and potency of cannabis plants. This trend is reflected in the growing preference for nutrient solutions that are free from harmful chemicals and additives. Market data suggests that organic nutrient sales have seen a substantial increase, with a notable percentage of growers opting for organic solutions to meet consumer expectations. This shift not only influences purchasing decisions but also drives manufacturers to innovate and improve their product lines to cater to this discerning market.

    Sustainability Trends in Agriculture

    The increasing emphasis on sustainability within the agricultural sector is significantly influencing the Cannabis Plant Nutrients Market. Growers are increasingly seeking eco-friendly nutrient solutions that align with sustainable farming practices. This trend is driven by both consumer demand for environmentally responsible products and regulatory pressures aimed at reducing the ecological footprint of agriculture. Market data indicates a growing segment of the industry focused on biodegradable and organic nutrients, which are perceived as more sustainable alternatives. As sustainability becomes a core value for many consumers, nutrient manufacturers are likely to innovate and develop products that not only meet performance standards but also adhere to environmental considerations.

    Technological Innovations in Agriculture

    Technological advancements in agricultural practices are playing a crucial role in shaping the Cannabis Plant Nutrients Market. Innovations such as precision agriculture, automated nutrient delivery systems, and data analytics are enabling growers to optimize their nutrient application processes. These technologies not only enhance efficiency but also improve crop yields and quality. For instance, the integration of IoT devices allows for real-time monitoring of nutrient levels, ensuring that plants receive the right amount at the right time. As these technologies become more accessible, they are likely to attract a broader range of cultivators, from small-scale growers to large commercial operations, thereby expanding the market for specialized cannabis nutrients.

    Expansion of Indoor and Hydroponic Cultivation

    The rise of indoor and hydroponic cultivation methods is emerging as a significant driver for the Cannabis Plant Nutrients Market. These cultivation techniques allow for year-round production and greater control over growing conditions, which in turn increases the demand for specialized nutrients tailored to these environments. As urban farming and home cultivation gain popularity, the market for nutrient solutions designed for hydroponics and indoor setups is likely to expand. Data suggests that the hydroponics market alone is projected to reach several billion dollars in the coming years, indicating a robust opportunity for nutrient suppliers to cater to this niche yet growing segment of cannabis cultivation.

    Market Segment Insights

    Cannabis Plant Nutrients Market Type of Cover Insights

    <p>The Cannabis Plant Nutrients Market segmentation, based on the nutrient type, includes macronutrient and micronutrient. The Macronutrient segment held the majority share in 2022 contributing concerning the Cannabis Plant Nutrients Market revenue. Macronutrients are important at each stage of the cannabis plant’s growth. Different phases, however, require different combinations of the NPK ratio. For instance, during flowering, the cannabis plant requires less nitrogen, but still requires high amounts of potassium and phosphorus. The other macronutrients used for the plant are sulfur, calcium, and magnesium.</p>

    <p>Sulfur is one of the ingredients in amino acids and plant proteins; it is also used in the production of vitamins and hormones and in the flavor of flowers and fruits. It is vital for chlorophyll production and enhances the development of the root system. Magnesium is important for chlorophyll, whereas calcium is used at the vegetative stage for better yield.</p>

    <p>Figure 2: Cannabis Plant Nutrients Market, by Nutrients Type, 2022 &amp; 2030 (USD Billion)</p>

    Cannabis Plant Nutrients Market Category Insights

    <p>The Cannabis Plant Nutrients Market form data has been bifurcated by conventional and organic. The conventional segment encompasses cannabis grown naturally in forests or any land without much human intervention, along with private plantations. The segment accounts for the maximum market share as the use of the plant has increased in various modes of applications. It has long been used for fiber, seeds, and its oils, while the leaves are used as vegetables and for juicing, medicinal purposes, and as a recreational drug.</p>

    <p>In December 2018, the US Farm Bill Law legalized the use of cannabis and addressed issues such as nutrition, trade, conservation, energy, and forestry. Thus, the conventional segment is expected to account for a larger market share during the forecast period. This has further broadened the growth opportunity for the cannabis plant nutrients industry.</p>

    <p>Figure 2: Cannabis Plant Nutrients Market, by Category, 2022 &amp; 2030 (USD Billion)</p>

    Cannabis Plant Nutrients Market Mode of Application Insights

    <p>Based on mode of application, the global cannabis plant nutrients industry has been segmented into drenching, fertigation, and foliar. The drenching is holding a highest market share. Drenching is a specific technique used to apply a diluted fertilizer or other nutrients to a particular plant or tree or to a specific group of plants as opposed to the entire field. Rather than spraying fertilizer on all the plants, nutrients are applied directly to the plant roots. As the cannabis plant is small stemmed, this technique is used to apply nutrients directly at the base of the stem.</p>

    Cannabis Plant Nutrients Market Regional Market Insights

    <p>By Region, the study segments the market into North America, Europe, Asia-Pacific and the Rest of the World. The Asia-Pacific region has become a significant player in the Cannabis Plant Nutrients Market. China, Australia, and New Zealand are the major cultivators of hemp, which is contributing to the growth of the cannabis plant nutrients market in Asia-Pacific. The cannabis plant nutrients market in India is expected to register the highest CAGR, followed by China, during the forecast period. The increasing adoption of organic farming is the primary factor driving the growth of the markets in these countries.</p>

    <p>The high demand for cannabis in the pharmaceutical industry, especially in China and India, is expected to contribute to the growth of the regional market. Moreover, the key players operating in the regional market are making high investments to increase production capacities. Further, the major countries studied are U.S, Canada, Germany, France, the UK, Italy, Spain, China, Japan, India, and Australia.</p>

    Get more detailed insights about Cannabis Plant Nutrients Market Research Report—Global Forecast till 2035

    Regional Insights

    North America : Market Leader in Cannabis Nutrients

    North America is the largest market for cannabis plant nutrients, driven by increasing legalization and consumer demand for high-quality cannabis products. The U.S. holds approximately 70% of the market share, while Canada follows with around 20%. Regulatory support and a growing number of licensed producers are key growth drivers, alongside rising awareness of sustainable farming practices. The competitive landscape is robust, featuring major players like Scotts Miracle-Gro, Advanced Nutrients, and General Hydroponics. These companies are investing heavily in R&D to innovate nutrient formulations tailored for cannabis cultivation. The presence of established brands and a growing number of startups contribute to a dynamic market environment, ensuring a wide range of products for consumers.

    Europe : Emerging Market with Potential

    Europe is rapidly emerging as a significant player in the cannabis plant nutrients market, driven by increasing legalization across various countries. The market is expected to grow as countries like Germany and the Netherlands lead the way, holding approximately 30% and 25% of the market share, respectively. Regulatory changes and a shift towards organic farming practices are key catalysts for growth in this region. Leading countries in Europe are Germany, the Netherlands, and the UK, with a competitive landscape featuring companies like Canna and BioBizz. The presence of established brands and a growing interest in sustainable cultivation methods are shaping the market. As regulations evolve, the demand for specialized nutrients tailored for cannabis cultivation is expected to rise significantly.

    Asia-Pacific : Rapidly Growing Market Segment

    Asia-Pacific is witnessing a surge in the cannabis plant nutrients market, driven by increasing acceptance of cannabis cultivation for medicinal and recreational purposes. Countries like Australia and New Zealand are at the forefront, with Australia holding about 15% of the market share. The region's growth is supported by favorable regulations and a growing awareness of the benefits of cannabis cultivation. The competitive landscape is evolving, with key players like Nutrifield and local startups entering the market. The presence of established agricultural practices and a focus on organic farming are contributing to the demand for specialized nutrients. As the market matures, the region is expected to see increased investment in R&D for innovative nutrient solutions tailored for cannabis cultivation.

    Middle East and Africa : Emerging Market with Challenges

    The Middle East and Africa region is in the early stages of developing its cannabis plant nutrients market, with varying degrees of legalization across countries. South Africa is leading the way, holding approximately 10% of the market share, while other countries are still navigating regulatory challenges. The region's growth is hindered by strict regulations, but increasing interest in medicinal cannabis is driving demand for specialized nutrients. Countries like South Africa and Israel are at the forefront, with a competitive landscape that includes local and international players. The presence of key companies is limited, but as regulations evolve, the market is expected to attract more investment. The focus on sustainable agriculture and organic practices may further enhance the demand for cannabis-specific nutrients in the coming years.

    Key Companies in the Cannabis Plant Nutrients Market market include

    Industry Developments

    January 2022: Yara signed an agreement with Lantmännen for the development of fertilizers with 80 to 90 percent lower carbon footprint. The agreement is expected to increase the company's portfolio.

    December 2020: Haifa Chemicals Ltd signed an agreement with Saipem for building a new ammonia plant in Mishor Rotem. The facility will have a capacity of 100,000 tons of ammonia a year. The facility and production will strengthen the company's position in the nutrients market

    December 2021: EuroChem Group acquired Fertilizantes Heringer S.A. The acquisition strengthens the company's presence in South America and significantly increases the company's foothold in the region.

    Future Outlook

    Cannabis Plant Nutrients Market Future Outlook

    <p>The Cannabis Plant Nutrients Market is projected to grow at a 29.05% CAGR from 2024 to 2035, driven by increasing legalization, consumer demand, and technological advancements in cultivation.</p>

    New opportunities lie in:

    • <p>Development of precision nutrient delivery systems for optimized growth</p>
    • <p>Expansion into organic nutrient lines to meet consumer preferences</p>
    • <p>Partnerships with agricultural technology firms for integrated solutions</p>

    <p>By 2035, the market is expected to be robust, reflecting substantial growth and innovation.</p>

    Market Segmentation

    Cannabis Plant Nutrients Market Type Outlook

    • Macronutrients
    • Micronutrients

    Cannabis Plant Nutrients Market Category Outlook

    • Conventional
    • Organic

    Cannabis Plant Nutrients Market Mode of Application Outlook

    • Drenching
    • Fertigation
    • Foliar

    Report Scope

    MARKET SIZE 2024256.85(USD Million)
    MARKET SIZE 2025331.46(USD Million)
    MARKET SIZE 20354246.37(USD Million)
    COMPOUND ANNUAL GROWTH RATE (CAGR)29.05% (2024 - 2035)
    REPORT COVERAGERevenue Forecast, Competitive Landscape, Growth Factors, and Trends
    BASE YEAR2024
    Market Forecast Period2025 - 2035
    Historical Data2019 - 2024
    Market Forecast UnitsUSD Million
    Key Companies ProfiledMarket analysis in progress
    Segments CoveredMarket segmentation analysis in progress
    Key Market OpportunitiesGrowing demand for organic nutrients driven by consumer preference for sustainable cannabis cultivation practices.
    Key Market DynamicsRising demand for organic cannabis nutrients drives innovation and competition among manufacturers in the market.
    Countries CoveredNorth America, Europe, APAC, South America, MEA

    FAQs

    What is the current valuation of the Cannabis Plant Nutrients Market?

    The market valuation was 256.85 USD Million in 2024.

    What is the projected market size for the Cannabis Plant Nutrients Market by 2035?

    The market is projected to reach 4246.37 USD Million by 2035.

    What is the expected CAGR for the Cannabis Plant Nutrients Market during the forecast period?

    The expected CAGR for the market from 2025 to 2035 is 29.05%.

    Which companies are considered key players in the Cannabis Plant Nutrients Market?

    Key players include Scotts Miracle-Gro, Advanced Nutrients, and General Hydroponics, among others.

    What are the main types of nutrients in the Cannabis Plant Nutrients Market?

    The market segments include macronutrients and micronutrients, with valuations of 2130.0 and 2116.37 USD Million, respectively.

    How is the Cannabis Plant Nutrients Market categorized?

    The market is categorized into conventional and organic nutrients, with both segments valued at approximately 2130.0 and 2116.37 USD Million.

    What are the primary modes of application for cannabis nutrients?

    The main modes of application are drenching, fertigation, and foliar, with fertigation valued at 1740.0 USD Million.

    1. SECTION I: EXECUTIVE SUMMARY AND KEY HIGHLIGHTS
      1. EXECUTIVE SUMMARY
        1. Market Overview
        2. Key Findings
        3. Market Segmentation
        4. Competitive Landscape
        5. Challenges and Opportunities
        6. Future Outlook
    2. SECTION II: SCOPING, METHODOLOGY AND MARKET STRUCTURE
      1. MARKET INTRODUCTION
        1. Definition
        2. Scope of the study
      2. RESEARCH METHODOLOGY
        1. Overview
        2. Data Mining
        3. Secondary Research
        4. Primary Research
        5. Forecasting Model
        6. Market Size Estimation
        7. Data Triangulation
        8. Validation
    3. SECTION III: QUALITATIVE ANALYSIS
      1. MARKET DYNAMICS
        1. Overview
        2. Drivers
        3. Restraints
        4. Opportunities
      2. MARKET FACTOR ANALYSIS
        1. Value chain Analysis
        2. Porter's Five Forces Analysis
        3. COVID-19 Impact Analysis
    4. SECTION IV: QUANTITATIVE ANALYSIS
      1. Food, Beverages & Nutrition, BY Type (USD Million)
        1. Macronutrients
        2. Micronutrients
      2. Food, Beverages & Nutrition, BY Category (USD Million)
        1. Conventional
        2. Organic
      3. Food, Beverages & Nutrition, BY Mode of Application (USD Million)
        1. Drenching
        2. Fertigation
        3. Foliar
      4. Food, Beverages & Nutrition, BY Region (USD Million)
        1. North America
        2. Europe
        3. APAC
        4. South America
        5. MEA
    5. SECTION V: COMPETITIVE ANALYSIS
      1. Competitive Landscape
        1. Overview
        2. Competitive Analysis
        3. Market share Analysis
        4. Major Growth Strategy in the Food, Beverages & Nutrition
        5. Competitive Benchmarking
        6. Leading Players in Terms of Number of Developments in the Food, Beverages & Nutrition
        7. Key developments and growth strategies
        8. Major Players Financial Matrix
      2. Company Profiles
        1. Scotts Miracle-Gro (US)
        2. Advanced Nutrients (CA)
        3. General Hydroponics (US)
        4. FoxFarm Soil & Fertilizer Company (US)
        5. Canna (NL)
        6. Humboldt Nutrients (US)
        7. BioBizz (NL)
        8. Green Planet Nutrients (CA)
        9. Nutrifield (AU)
      3. Appendix
        1. References
        2. Related Reports
    6. LIST OF FIGURES
      1. MARKET SYNOPSIS
      2. NORTH AMERICA MARKET ANALYSIS
      3. US MARKET ANALYSIS BY TYPE
      4. US MARKET ANALYSIS BY CATEGORY
      5. US MARKET ANALYSIS BY MODE OF APPLICATION
      6. CANADA MARKET ANALYSIS BY TYPE
      7. CANADA MARKET ANALYSIS BY CATEGORY
      8. CANADA MARKET ANALYSIS BY MODE OF APPLICATION
      9. EUROPE MARKET ANALYSIS
      10. GERMANY MARKET ANALYSIS BY TYPE
      11. GERMANY MARKET ANALYSIS BY CATEGORY
      12. GERMANY MARKET ANALYSIS BY MODE OF APPLICATION
      13. UK MARKET ANALYSIS BY TYPE
      14. UK MARKET ANALYSIS BY CATEGORY
      15. UK MARKET ANALYSIS BY MODE OF APPLICATION
      16. FRANCE MARKET ANALYSIS BY TYPE
      17. FRANCE MARKET ANALYSIS BY CATEGORY
      18. FRANCE MARKET ANALYSIS BY MODE OF APPLICATION
      19. RUSSIA MARKET ANALYSIS BY TYPE
      20. RUSSIA MARKET ANALYSIS BY CATEGORY
      21. RUSSIA MARKET ANALYSIS BY MODE OF APPLICATION
      22. ITALY MARKET ANALYSIS BY TYPE
      23. ITALY MARKET ANALYSIS BY CATEGORY
      24. ITALY MARKET ANALYSIS BY MODE OF APPLICATION
      25. SPAIN MARKET ANALYSIS BY TYPE
      26. SPAIN MARKET ANALYSIS BY CATEGORY
      27. SPAIN MARKET ANALYSIS BY MODE OF APPLICATION
      28. REST OF EUROPE MARKET ANALYSIS BY TYPE
      29. REST OF EUROPE MARKET ANALYSIS BY CATEGORY
      30. REST OF EUROPE MARKET ANALYSIS BY MODE OF APPLICATION
      31. APAC MARKET ANALYSIS
      32. CHINA MARKET ANALYSIS BY TYPE
      33. CHINA MARKET ANALYSIS BY CATEGORY
      34. CHINA MARKET ANALYSIS BY MODE OF APPLICATION
      35. INDIA MARKET ANALYSIS BY TYPE
      36. INDIA MARKET ANALYSIS BY CATEGORY
      37. INDIA MARKET ANALYSIS BY MODE OF APPLICATION
      38. JAPAN MARKET ANALYSIS BY TYPE
      39. JAPAN MARKET ANALYSIS BY CATEGORY
      40. JAPAN MARKET ANALYSIS BY MODE OF APPLICATION
      41. SOUTH KOREA MARKET ANALYSIS BY TYPE
      42. SOUTH KOREA MARKET ANALYSIS BY CATEGORY
      43. SOUTH KOREA MARKET ANALYSIS BY MODE OF APPLICATION
      44. MALAYSIA MARKET ANALYSIS BY TYPE
      45. MALAYSIA MARKET ANALYSIS BY CATEGORY
      46. MALAYSIA MARKET ANALYSIS BY MODE OF APPLICATION
      47. THAILAND MARKET ANALYSIS BY TYPE
      48. THAILAND MARKET ANALYSIS BY CATEGORY
      49. THAILAND MARKET ANALYSIS BY MODE OF APPLICATION
      50. INDONESIA MARKET ANALYSIS BY TYPE
      51. INDONESIA MARKET ANALYSIS BY CATEGORY
      52. INDONESIA MARKET ANALYSIS BY MODE OF APPLICATION
      53. REST OF APAC MARKET ANALYSIS BY TYPE
      54. REST OF APAC MARKET ANALYSIS BY CATEGORY
      55. REST OF APAC MARKET ANALYSIS BY MODE OF APPLICATION
      56. SOUTH AMERICA MARKET ANALYSIS
      57. BRAZIL MARKET ANALYSIS BY TYPE
      58. BRAZIL MARKET ANALYSIS BY CATEGORY
      59. BRAZIL MARKET ANALYSIS BY MODE OF APPLICATION
      60. MEXICO MARKET ANALYSIS BY TYPE
      61. MEXICO MARKET ANALYSIS BY CATEGORY
      62. MEXICO MARKET ANALYSIS BY MODE OF APPLICATION
      63. ARGENTINA MARKET ANALYSIS BY TYPE
      64. ARGENTINA MARKET ANALYSIS BY CATEGORY
      65. ARGENTINA MARKET ANALYSIS BY MODE OF APPLICATION
      66. REST OF SOUTH AMERICA MARKET ANALYSIS BY TYPE
      67. REST OF SOUTH AMERICA MARKET ANALYSIS BY CATEGORY
      68. REST OF SOUTH AMERICA MARKET ANALYSIS BY MODE OF APPLICATION
      69. MEA MARKET ANALYSIS
      70. GCC COUNTRIES MARKET ANALYSIS BY TYPE
      71. GCC COUNTRIES MARKET ANALYSIS BY CATEGORY
      72. GCC COUNTRIES MARKET ANALYSIS BY MODE OF APPLICATION
      73. SOUTH AFRICA MARKET ANALYSIS BY TYPE
      74. SOUTH AFRICA MARKET ANALYSIS BY CATEGORY
      75. SOUTH AFRICA MARKET ANALYSIS BY MODE OF APPLICATION
      76. REST OF MEA MARKET ANALYSIS BY TYPE
      77. REST OF MEA MARKET ANALYSIS BY CATEGORY
      78. REST OF MEA MARKET ANALYSIS BY MODE OF APPLICATION
      79. KEY BUYING CRITERIA OF FOOD, BEVERAGES & NUTRITION
      80. RESEARCH PROCESS OF MRFR
      81. DRO ANALYSIS OF FOOD, BEVERAGES & NUTRITION
      82. DRIVERS IMPACT ANALYSIS: FOOD, BEVERAGES & NUTRITION
      83. RESTRAINTS IMPACT ANALYSIS: FOOD, BEVERAGES & NUTRITION
      84. SUPPLY / VALUE CHAIN: FOOD, BEVERAGES & NUTRITION
      85. FOOD, BEVERAGES & NUTRITION, BY TYPE, 2024 (% SHARE)
      86. FOOD, BEVERAGES & NUTRITION, BY TYPE, 2024 TO 2035 (USD Million)
      87. FOOD, BEVERAGES & NUTRITION, BY CATEGORY, 2024 (% SHARE)
      88. FOOD, BEVERAGES & NUTRITION, BY CATEGORY, 2024 TO 2035 (USD Million)
      89. FOOD, BEVERAGES & NUTRITION, BY MODE OF APPLICATION, 2024 (% SHARE)
      90. FOOD, BEVERAGES & NUTRITION, BY MODE OF APPLICATION, 2024 TO 2035 (USD Million)
      91. BENCHMARKING OF MAJOR COMPETITORS
    7. LIST OF TABLES
      1. LIST OF ASSUMPTIONS
      2. 7.1.1
      3. North America MARKET SIZE ESTIMATES; FORECAST
        1. BY TYPE, 2025-2035 (USD Million)
        2. BY CATEGORY, 2025-2035 (USD Million)
        3. BY MODE OF APPLICATION, 2025-2035 (USD Million)
      4. US MARKET SIZE ESTIMATES; FORECAST
        1. BY TYPE, 2025-2035 (USD Million)
        2. BY CATEGORY, 2025-2035 (USD Million)
        3. BY MODE OF APPLICATION, 2025-2035 (USD Million)
      5. Canada MARKET SIZE ESTIMATES; FORECAST
        1. BY TYPE, 2025-2035 (USD Million)
        2. BY CATEGORY, 2025-2035 (USD Million)
        3. BY MODE OF APPLICATION, 2025-2035 (USD Million)
      6. Europe MARKET SIZE ESTIMATES; FORECAST
        1. BY TYPE, 2025-2035 (USD Million)
        2. BY CATEGORY, 2025-2035 (USD Million)
        3. BY MODE OF APPLICATION, 2025-2035 (USD Million)
      7. Germany MARKET SIZE ESTIMATES; FORECAST
        1. BY TYPE, 2025-2035 (USD Million)
        2. BY CATEGORY, 2025-2035 (USD Million)
        3. BY MODE OF APPLICATION, 2025-2035 (USD Million)
      8. UK MARKET SIZE ESTIMATES; FORECAST
        1. BY TYPE, 2025-2035 (USD Million)
        2. BY CATEGORY, 2025-2035 (USD Million)
        3. BY MODE OF APPLICATION, 2025-2035 (USD Million)
      9. France MARKET SIZE ESTIMATES; FORECAST
        1. BY TYPE, 2025-2035 (USD Million)
        2. BY CATEGORY, 2025-2035 (USD Million)
        3. BY MODE OF APPLICATION, 2025-2035 (USD Million)
      10. Russia MARKET SIZE ESTIMATES; FORECAST
        1. BY TYPE, 2025-2035 (USD Million)
        2. BY CATEGORY, 2025-2035 (USD Million)
        3. BY MODE OF APPLICATION, 2025-2035 (USD Million)
      11. Italy MARKET SIZE ESTIMATES; FORECAST
        1. BY TYPE, 2025-2035 (USD Million)
        2. BY CATEGORY, 2025-2035 (USD Million)
        3. BY MODE OF APPLICATION, 2025-2035 (USD Million)
      12. Spain MARKET SIZE ESTIMATES; FORECAST
        1. BY TYPE, 2025-2035 (USD Million)
        2. BY CATEGORY, 2025-2035 (USD Million)
        3. BY MODE OF APPLICATION, 2025-2035 (USD Million)
      13. Rest of Europe MARKET SIZE ESTIMATES; FORECAST
        1. BY TYPE, 2025-2035 (USD Million)
        2. BY CATEGORY, 2025-2035 (USD Million)
        3. BY MODE OF APPLICATION, 2025-2035 (USD Million)
      14. APAC MARKET SIZE ESTIMATES; FORECAST
        1. BY TYPE, 2025-2035 (USD Million)
        2. BY CATEGORY, 2025-2035 (USD Million)
        3. BY MODE OF APPLICATION, 2025-2035 (USD Million)
      15. China MARKET SIZE ESTIMATES; FORECAST
        1. BY TYPE, 2025-2035 (USD Million)
        2. BY CATEGORY, 2025-2035 (USD Million)
        3. BY MODE OF APPLICATION, 2025-2035 (USD Million)
      16. India MARKET SIZE ESTIMATES; FORECAST
        1. BY TYPE, 2025-2035 (USD Million)
        2. BY CATEGORY, 2025-2035 (USD Million)
        3. BY MODE OF APPLICATION, 2025-2035 (USD Million)
      17. Japan MARKET SIZE ESTIMATES; FORECAST
        1. BY TYPE, 2025-2035 (USD Million)
        2. BY CATEGORY, 2025-2035 (USD Million)
        3. BY MODE OF APPLICATION, 2025-2035 (USD Million)
      18. South Korea MARKET SIZE ESTIMATES; FORECAST
        1. BY TYPE, 2025-2035 (USD Million)
        2. BY CATEGORY, 2025-2035 (USD Million)
        3. BY MODE OF APPLICATION, 2025-2035 (USD Million)
      19. Malaysia MARKET SIZE ESTIMATES; FORECAST
        1. BY TYPE, 2025-2035 (USD Million)
        2. BY CATEGORY, 2025-2035 (USD Million)
        3. BY MODE OF APPLICATION, 2025-2035 (USD Million)
      20. Thailand MARKET SIZE ESTIMATES; FORECAST
        1. BY TYPE, 2025-2035 (USD Million)
        2. BY CATEGORY, 2025-2035 (USD Million)
        3. BY MODE OF APPLICATION, 2025-2035 (USD Million)
      21. Indonesia MARKET SIZE ESTIMATES; FORECAST
        1. BY TYPE, 2025-2035 (USD Million)
        2. BY CATEGORY, 2025-2035 (USD Million)
        3. BY MODE OF APPLICATION, 2025-2035 (USD Million)
      22. Rest of APAC MARKET SIZE ESTIMATES; FORECAST
        1. BY TYPE, 2025-2035 (USD Million)
        2. BY CATEGORY, 2025-2035 (USD Million)
        3. BY MODE OF APPLICATION, 2025-2035 (USD Million)
      23. South America MARKET SIZE ESTIMATES; FORECAST
        1. BY TYPE, 2025-2035 (USD Million)
        2. BY CATEGORY, 2025-2035 (USD Million)
        3. BY MODE OF APPLICATION, 2025-2035 (USD Million)
      24. Brazil MARKET SIZE ESTIMATES; FORECAST
        1. BY TYPE, 2025-2035 (USD Million)
        2. BY CATEGORY, 2025-2035 (USD Million)
        3. BY MODE OF APPLICATION, 2025-2035 (USD Million)
      25. Mexico MARKET SIZE ESTIMATES; FORECAST
        1. BY TYPE, 2025-2035 (USD Million)
        2. BY CATEGORY, 2025-2035 (USD Million)
        3. BY MODE OF APPLICATION, 2025-2035 (USD Million)
      26. Argentina MARKET SIZE ESTIMATES; FORECAST
        1. BY TYPE, 2025-2035 (USD Million)
        2. BY CATEGORY, 2025-2035 (USD Million)
        3. BY MODE OF APPLICATION, 2025-2035 (USD Million)
      27. Rest of South America MARKET SIZE ESTIMATES; FORECAST
        1. BY TYPE, 2025-2035 (USD Million)
        2. BY CATEGORY, 2025-2035 (USD Million)
        3. BY MODE OF APPLICATION, 2025-2035 (USD Million)
      28. MEA MARKET SIZE ESTIMATES; FORECAST
        1. BY TYPE, 2025-2035 (USD Million)
        2. BY CATEGORY, 2025-2035 (USD Million)
        3. BY MODE OF APPLICATION, 2025-2035 (USD Million)
      29. GCC Countries MARKET SIZE ESTIMATES; FORECAST
        1. BY TYPE, 2025-2035 (USD Million)
        2. BY CATEGORY, 2025-2035 (USD Million)
        3. BY MODE OF APPLICATION, 2025-2035 (USD Million)
      30. South Africa MARKET SIZE ESTIMATES; FORECAST
        1. BY TYPE, 2025-2035 (USD Million)
        2. BY CATEGORY, 2025-2035 (USD Million)
        3. BY MODE OF APPLICATION, 2025-2035 (USD Million)
      31. Rest of MEA MARKET SIZE ESTIMATES; FORECAST
        1. BY TYPE, 2025-2035 (USD Million)
        2. BY CATEGORY, 2025-2035 (USD Million)
        3. BY MODE OF APPLICATION, 2025-2035 (USD Million)
      32. PRODUCT LAUNCH/PRODUCT DEVELOPMENT/APPROVAL
      33. 7.31.1
      34. ACQUISITION/PARTNERSHIP
      35. 7.32.1

    Cannabis Plant Nutrients Market Segmentation

    Cannabis Plant Nutrients Type Outlook (USD Million, 2019-2030)

    Macronutrients

    Micronutrients

    Cannabis Plant Nutrients Category Outlook (USD Million, 2019-2030)

    Conventional

    Organic

    Cannabis Plant Nutrients Mode of Application Outlook (USD Million, 2019-2030)

    Drenching

    Fertigation

    Foliar

    Cannabis Plant Nutrients Regional Outlook (USD Million, 2019-2030)

    North America Outlook (USD Million, 2019-2030)

    North America Cannabis Plant Nutrients by Nutrient Type

    Macronutrients

    Micronutrients

    North America Cannabis Plant Nutrients by Category

    Conventional

    Organic

    North America Cannabis Plant Nutrients by Mode of Application

    Drenching

    Fertigation

    Foliar

    US Outlook (USD Million, 2019-2030)

    US Cannabis Plant Nutrients by Nutrient Type

    Macronutrients

    Micronutrients

    US Cannabis Plant Nutrients by Category

    Conventional

    Organic

    US Cannabis Plant Nutrients by Mode of Application

    Drenching

    Fertigation

    Foliar

    Canada Outlook (USD Million, 2019-2030)

    Canada Cannabis Plant Nutrients by Nutrient Type

    Macronutrients

    Micronutrients

    Canada Cannabis Plant Nutrients by Category

    Conventional

    Organic

    Canada Cannabis Plant Nutrients by Mode of Application

    Drenching

    Fertigation

    Foliar

    Mexico Outlook (USD Million, 2019-2030)

    Mexico Cannabis Plant Nutrients by Nutrient Type

    Macronutrients

    Micronutrients

    Mexico Cannabis Plant Nutrients by Category

    Conventional

    Organic

    Mexico Cannabis Plant Nutrients by Mode of Application

    Drenching

    Fertigation

    Foliar

    Europe Outlook (USD Million, 2019-2030)

    Europe Cannabis Plant Nutrients by Nutrient Type

    Macronutrients

    Micronutrients

    Europe Cannabis Plant Nutrients by Category

    Conventional

    Organic

    Europe Cannabis Plant Nutrients by Mode of Application

    Drenching

    Fertigation

    Foliar

    Germany Outlook (USD Million, 2019-2030)

    Germany Cannabis Plant Nutrients by Nutrient Type

    Macronutrients

    Micronutrients

    Germany Cannabis Plant Nutrients by Category

    Conventional

    Organic

    Germany Cannabis Plant Nutrients by Mode of Application

    Drenching

    Fertigation

    Foliar

    Estonia Outlook (USD Million, 2019-2030)

    Estonia Cannabis Plant Nutrients by Nutrient Type

    Macronutrients

    Micronutrients

    Estonia Cannabis Plant Nutrients by Category

    Conventional

    Organic

    Estonia Cannabis Plant Nutrients by Mode of Application

    Drenching

    Fertigation

    Foliar

    France Outlook (USD Million, 2019-2030)

    France Cannabis Plant Nutrients by Nutrient Type

    Macronutrients

    Micronutrients

    France Cannabis Plant Nutrients by Category

    Conventional

    Organic

    France Cannabis Plant Nutrients by Mode of Application

    Drenching

    Fertigation

    Foliar

    Spain Outlook (USD Million, 2019-2030)

    Spain Cannabis Plant Nutrients by Nutrient Type

    Macronutrients

    Micronutrients

    Spain Cannabis Plant Nutrients by Category

    Conventional

    Organic

    Spain Cannabis Plant Nutrients by Mode of Application

    Drenching

    Fertigation

    Foliar

    Italy Outlook (USD Million, 2019-2030)

    Italy Cannabis Plant Nutrients by Nutrient Type

    Macronutrients

    Micronutrients

    Italy Cannabis Plant Nutrients by Category

    Conventional

    Organic

    Italy Cannabis Plant Nutrients by Mode of Application

    Drenching

    Fertigation

    Foliar

    Rest of Europe Outlook (USD Million, 2019-2030)

    Rest of Europe Cannabis Plant Nutrients by Nutrient Type

    Macronutrients

    Micronutrients

    Rest of Europe Cannabis Plant Nutrients by Category

    Conventional

    Organic

    Rest of Europe Cannabis Plant Nutrients by Mode of Application

    Drenching

    Fertigation

    Foliar

    Asia-Pacific Outlook (USD Million, 2019-2030)

    Asia-Pacific Cannabis Plant Nutrients by Nutrient Type

    Macronutrients

    Micronutrients

    Asia-Pacific Cannabis Plant Nutrients by Category

    Conventional

    Organic

    Asia-Pacific Cannabis Plant Nutrients by Mode of Application

    Drenching

    Fertigation

    Foliar

    China Outlook (USD Million, 2019-2030)

    China Cannabis Plant Nutrients by Nutrient Type

    Macronutrients

    Micronutrients

    China Cannabis Plant Nutrients by Category

    Conventional

    Organic

    China Cannabis Plant Nutrients by Mode of Application

    Drenching

    Fertigation

    Foliar

    Japan Outlook (USD Million, 2019-2030)

    Japan Cannabis Plant Nutrients by Nutrient Type

    Macronutrients

    Micronutrients

    Japan Cannabis Plant Nutrients by Category

    Conventional

    Organic

    Japan Cannabis Plant Nutrients by Mode of Application

    Drenching

    Fertigation

    Foliar

    India Outlook (USD Million, 2019-2030)

    India Cannabis Plant Nutrients by Nutrient Type

    Macronutrients

    Micronutrients

    India Cannabis Plant Nutrients by Category

    Conventional

    Organic

    India Cannabis Plant Nutrients by Mode of Application

    Drenching

    Fertigation

    Foliar

    Australia & New Zealand Outlook (USD Million, 2019-2030)

    Australia & New Zealand Cannabis Plant Nutrients by Nutrient Type

    Macronutrients

    Micronutrients

    Australia & New Zealand Cannabis Plant Nutrients by Category

    Conventional

    Organic

    Australia & New Zealand Cannabis Plant Nutrients by Mode of Application

    Drenching

    Fertigation

    Foliar

    Rest of Asia-Pacific Outlook (USD Million, 2019-2030)

    Rest of Asia-Pacific Cannabis Plant Nutrients by Nutrient Type

    Macronutrients

    Micronutrients

    Rest of Asia-Pacific Cannabis Plant Nutrients by Category

    Conventional

    Organic

    Rest of Asia-Pacific Cannabis Plant Nutrients by Mode of Application

    Drenching

    Fertigation

    Foliar

    Rest of the World Outlook (USD Million, 2019-2030)

    Rest of the World Cannabis Plant Nutrients by Nutrient Type

    Macronutrients

    Micronutrients

    Rest of the World Cannabis Plant Nutrients by Category

    Conventional

    Organic

    Rest of the World Cannabis Plant Nutrients by Mode of Application

    Drenching

    Fertigation

    Foliar

    South America Outlook (USD Million, 2019-2030)

    South America Cannabis Plant Nutrients by Nutrient Type

    Macronutrients

    Micronutrients

    South America Cannabis Plant Nutrients by Category

    Conventional

    Organic

    South America Cannabis Plant Nutrients by Mode of Application

    Drenching

    Fertigation

    Foliar

    Middle East & Africa Outlook (USD Million, 2019-2030)

    Middle East & Africa Cannabis Plant Nutrients by Nutrient Type

    Macronutrients

    Micronutrients

    Middle East & Africa Cannabis Plant Nutrients by Category

    Conventional

    Organic

    Middle East & Africa Cannabis Plant Nutrients by Mode of Application

    Drenching

    Fertigation

    Foliar

    Infographic

    Free Sample Request

    Kindly complete the form below to receive a free sample of this Report

    Get Free Sample

    Customer Strories

    “I am very pleased with how market segments have been defined in a relevant way for my purposes (such as "Portable Freezers & refrigerators" and "last-mile"). In general the report is well structured. Thanks very much for your efforts.”

    Victoria Milne

    Founder

    Compare Licence

    ×
    Features License Type
    Single User Multiuser License Enterprise User
    Price $4,950 $5,950 $7,250
    Maximum User Access Limit 1 User Upto 10 Users Unrestricted Access Throughout the Organization
    Free Customization
    Direct Access to Analyst
    Deliverable Format
    Platform Access
    Discount on Next Purchase 10% 15% 15%
    Printable Versions