Capacitor Market

Key Players: Murata Manufacturing Co., Ltd., Samsung Electro-Mechanics, TDK Corporation, Taiyo Yuden Co., Ltd., KEMET Corporation (Yageo), AVX Corporation (Kyocera), Vishay Intertechnology, Inc., Nippon Chemi-Con Corporation

Capacitor Market

Capacitor Market Size, Share and Research Report By Capacitor Type (Ceramics, Aluminum, Tantalum, Papers and Plastics, Supercapacitors), By End Use Industry (Telecom, Computers, Consumer Electronics, Automotive, Industrial, Others), By Voltage (Low Voltage, High Voltage) and By Region (North America, Europe, Asia-Pacific, and Rest of the World) –Industry Forecast Till 2035
ID: MRFR/SEM/10384-HCR
128 Pages
Aarti Dhapte, Aarti Dhapte
Last Updated: June 22, 2026

Capacitor Market Summary

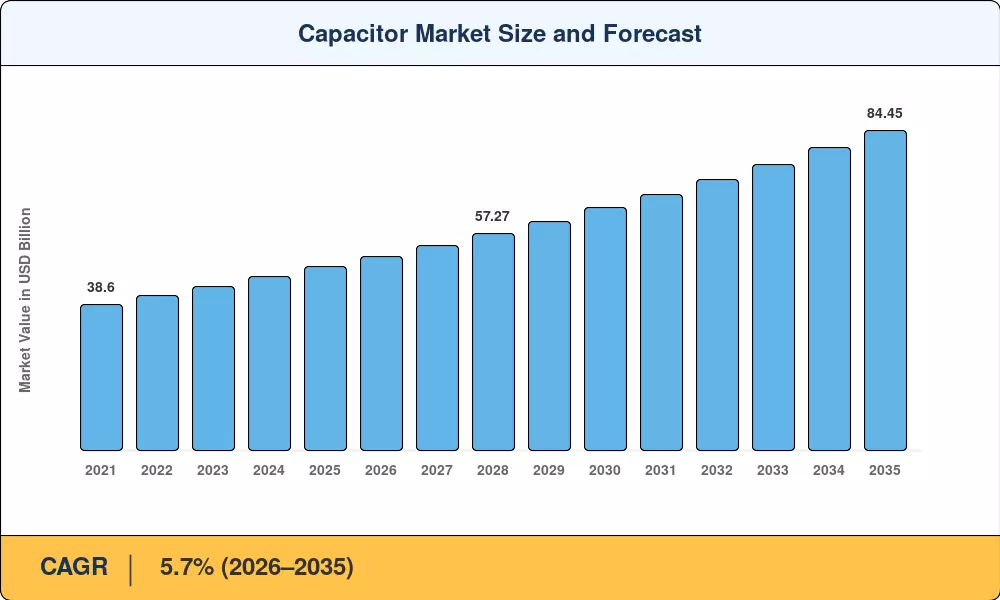
The global Capacitor Market reached an estimated USD 48.50 billion in 2025 and is projected to grow from USD 51.26 billion in 2026 to USD 84.45 billion by 2035, registering a CAGR of 5.7% during 2026–2035. This trajectory reflects two converging catalysts: the accelerating electrification of transportation — with global EV sales surpassing 17 million units in 2024 [1] — and the ongoing build-out of 5G telecommunications infrastructure that demands increasingly sophisticated passive components for signal integrity and power conditioning.

A generational shift is underway in capacitor technology. Legacy single-layer ceramic and basic aluminum electrolytic designs are yielding ground to advanced multilayer ceramic capacitors, high-capacitance polymer hybrids, and solid-state supercapacitors engineered for higher energy densities and tighter thermal envelopes. The U.S. Department of Energy's USD 3.5 billion Advanced Energy Manufacturing Tax Credit [2] and the EU's European Chips Act — directing EUR 43 billion toward semiconductor and component self-sufficiency [3] — are pulling investment into domestic capacitor fabrication lines across North America and Europe.

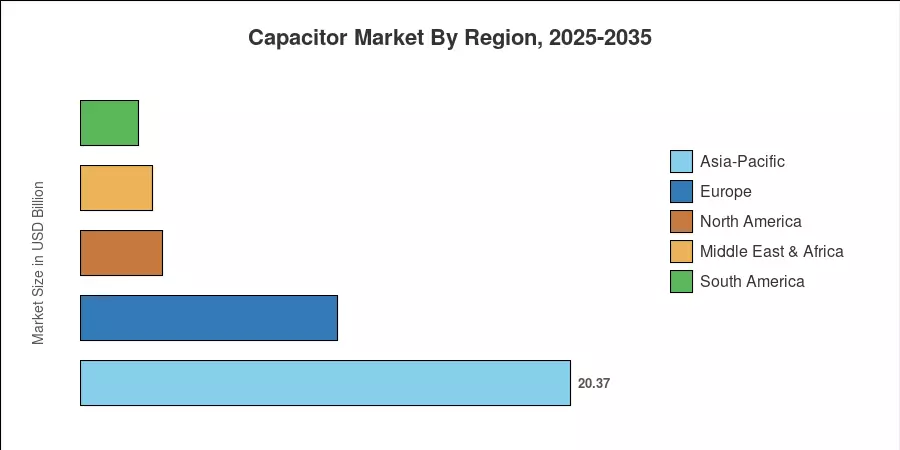
Asia-Pacific commands approximately 42% of the Capacitor Market, anchored by Japan, China, and South Korea's vertically integrated electronics supply chains. North America is the fastest-growing region, expanding at roughly 7.0% CAGR as reshoring incentives and defense procurement budgets swell. Europe holds the second-largest share at around 22%, driven by automotive OEM demand and renewable-grid investment. The decade ahead will reward manufacturers that can scale thin-film and high-voltage dielectric platforms while navigating tightening rare-earth material supply chains.


Key Report Takeaways

• By Type

  • Ceramic capacitors account for approximately 45% of the Capacitor Market, supported by ubiquitous demand in smartphones, EVs, and base stations.
  • Supercapacitors represent the fastest-growing type segment, expanding at a 9.4% CAGR through 2035 as energy-recovery and grid-storage applications scale.
  • Film capacitors hold about 15% share, sustained by industrial motor drives and renewable inverter applications.

• By End-Use Industry

  • Consumer electronics remains the largest end-use vertical, valued at roughly USD 15.52 billion in 2025.
  • The automotive segment is expanding at the fastest pace among end-use categories, driven by EV power modules and ADAS circuitry.

• By Region

  • Asia-Pacific dominates the Capacitor Market with a 42% value share in 2025, led by Japan and China.
  • North America is the fastest-growing region at 7.0% CAGR, propelled by defense spending and chip-act-linked component reshoring.


Capacitor Market Size and Forecast (2021–2035)

Market size estimates draw on a triangulated methodology combining top-down industry production data from JEITA and ECIA trade associations, bottom-up revenue models built from leading manufacturer filings, and cross-validated import-export customs records for passive electronic components across 48 countries [4].

Capacitor Market Size and Forecast
Our Impact
Enabled $4.3B Revenue Impact for Fortune 500 and Leading Multinationals
Partnering with 2000+ Global Organizations Each Year
30K+ Citations by Top-Tier Firms in the Industry

Driver Impact Analysis

Driver ~% Impact on CAGR Geographic Relevance Impact Timeline
EV and hybrid vehicle proliferation ~22% Global Short–Medium
5G infrastructure densification ~18% North America, Asia-Pacific Short-term (≤2 yr)
Renewable energy inverter demand ~16% Europe, Asia-Pacific Medium-term (2–4 yr)
Data center and AI server expansion ~14% North America, Europe Medium-term (2–4 yr)
Defense and aerospace modernization ~12% North America, Middle East Long-term (≥4 yr)
IoT and wearable device proliferation ~10% Global Short-term (≤2 yr)
Grid-scale energy storage deployment ~8% Asia-Pacific, Europe Long-term (≥4 yr)


EV and Hybrid Vehicle Proliferation

Every battery-electric vehicle contains between 8,000 and 12,000 capacitors — roughly three times the passive-component count of a comparable internal-combustion vehicle — spanning DC-link film capacitors in the inverter, ceramic decoupling caps on every control unit, and increasingly supercapacitor modules for regenerative braking [1]. The International Energy Agency projects global EV stock will reach 250 million units by 2030, translating into an incremental addressable volume exceeding 1.5 trillion capacitor units per year [9]. This single vertical is reshaping the Capacitor Market's product mix toward high-voltage, high-temperature-rated components.

5G Infrastructure Densification

Each 5G macro base station requires roughly 15,000 multilayer ceramic capacitors for power amplifier filtering and RF decoupling, while small-cell units consume 3,000–5,000 pieces each [8]. With Ericsson projecting more than 7 million 5G base-station deployments globally by 2028, the cumulative demand creates sustained pressure on ceramic capacitor supply chains — particularly for ultra-small 0201-size components that are difficult to manufacture at scale [5].

Renewable Energy Inverter Demand

Solar and wind inverters rely heavily on DC-link film capacitors and aluminum electrolytic capacitors to smooth voltage ripple and manage power conversion. The IEA's 2024 World Energy Outlook estimates global renewable capacity additions will exceed 500 GW annually by 2028, requiring approximately USD 2.1 billion in capacitor content per year for inverter manufacturing alone [10]. This driver is particularly strong in Europe and Asia-Pacific, where feed-in tariff programs and national decarbonization mandates accelerate installation timelines.

Data Center and AI Server Expansion

AI-optimized server racks draw 40–70 kW per unit, two to three times more than conventional servers, pushing capacitor requirements for voltage regulation modules and bulk decoupling to new highs [11]. Hyperscale operators — Amazon, Microsoft, Google — announced combined capex exceeding USD 150 billion for 2025 data-center construction, and each rack can contain upward of 50,000 capacitors across GPU boards, power supplies, and networking cards [11].


Restraints Impact Analysis

Restraint ~% Negative Impact Geographic Relevance Impact Timeline
Raw material price volatility (palladium, tantalum) ~25% Global Short-term (≤2 yr)
Supply-chain concentration in East Asia ~22% Global Medium-term (2–4 yr)
Counterfeit component infiltration ~20% North America, Europe Medium-term (2–4 yr)
Environmental regulations on electrolyte chemicals ~18% Europe, Asia-Pacific Long-term (≥4 yr)
Pricing pressure from contract renegotiations ~15% Global Short-term (≤2 yr)


Raw Material Price Volatility

Palladium accounts for roughly 40% of the electrode material cost in certain ceramic capacitor configurations. Prices swung between USD 900 and USD 2,400 per troy ounce over 2021–2024, compressing manufacturer margins by 200–350 basis points in peak-cost quarters [15]. Tantalum, sourced predominantly from the Democratic Republic of Congo and Rwanda, faces comparable instability exacerbated by conflict-mineral compliance overhead under the EU Conflict Minerals Regulation and U.S. Dodd-Frank Section 1502 [15].

Supply-Chain Concentration in East Asia

Over 70% of global ceramic capacitor production capacity resides in Japan, China, and South Korea [16]. Geopolitical friction — including U.S. export controls on advanced semiconductor equipment and China's retaliatory restrictions on critical mineral exports — creates recurring disruption risk for downstream Capacitor Market participants. The 2024 Noto earthquake in Japan temporarily idled three TDK and Murata facilities, causing spot-market premiums of 15–20% on affected product lines.

Counterfeit Component Infiltration

The U.S. Government Accountability Office estimates that counterfeit electronic components cost the defense supply chain USD 1.8 billion annually, with capacitors ranking among the five most frequently counterfeited passive parts [17]. Counterfeit capacitors — often relabeled lower-grade units — introduce field-failure risks and erode buyer confidence, dampening growth in sectors where traceability requirements add procurement cost.


Capacitor Market Opportunities

Next-Generation Solid-State Capacitors for EV Powertrains

Solid-state ceramic and polymer-film capacitors capable of operating above 200°C open new design space inside EV traction inverters, where proximity to SiC and GaN power modules demands extreme thermal resilience. Several manufacturers have announced pilot lines for high-temperature MLCC variants rated at 250°C, targeting commercialization by 2028.

Grid-Scale Supercapacitor Energy Storage

Utility-scale supercapacitor banks can deliver frequency-regulation response in under one second — ten times faster than lithium-ion batteries — positioning them for ancillary-services contracts valued at over USD 8 billion globally by 2030 [14]. Emerging markets in Southeast Asia and Sub-Saharan Africa, where grid instability is acute, represent greenfield deployment opportunities.

Capacitor-as-a-Service and Predictive Maintenance Platforms

Embedded sensor capacitors that monitor their own ESR degradation in real time enable condition-based maintenance for industrial motor drives and telecom power supplies. This data-monetization model allows capacitor OEMs to shift from one-time component sales to recurring service revenue, with pilot programs already generating 12–15% incremental margin for early adopters.

Defense and Aerospace Qualification Premiums

NATO member states' combined defense budgets surpassed USD 1.2 trillion in 2024, and modern radar, electronic-warfare, and directed-energy platforms require MIL-spec capacitors that carry 3–5× price premiums over commercial equivalents [12]. The Capacitor Market stands to capture significant value as Western nations prioritize supply-chain sovereignty for critical defense electronics.

Emerging-Market Industrialization in India and Vietnam

India's Production-Linked Incentive scheme for electronic components allocates INR 17,000 crore (approximately USD 2 billion) to domestic passive-component manufacturing through 2029 [20]. Vietnam's growing PCB assembly base, serving Samsung and Foxconn, pulls capacitor demand as production shifts from China, creating a new regional node in the Capacitor Market supply chain.


Capacitor Market Future Outlook

AI-Driven Design and Manufacturing Optimization

Machine-learning algorithms are already optimizing capacitor dielectric formulations at firms like Murata and Samsung Electro-Mechanics, reducing new-product development cycles from 18 months to under 10 [22]. By 2030, AI-assisted process control is expected to improve ceramic capacitor yield rates by 5–8 percentage points, directly reducing per-unit costs and expanding the addressable Capacitor Market for cost-sensitive IoT applications.

Electrification Supercycle and Wide-Bandgap Semiconductors

The transition from silicon IGBTs to SiC and GaN power switches demands capacitors with lower ESR, higher ripple-current ratings, and tighter tolerances. IEA estimates that electrification-related investment will exceed USD 1.5 trillion annually by 2030, and every dollar of power-electronics spend carries 8–12 cents of capacitor content [9][10]. The Capacitor Market will need to expand thin-film and high-capacitance ceramic platforms to keep pace.

Circular-Economy and ESG Compliance Pressures

The EU's proposed Ecodesign for Sustainable Products Regulation will require digital product passports for electronic components by 2028, compelling capacitor manufacturers to document material provenance, recycled-content percentages, and end-of-life recovery pathways [18]. Companies that invest early in tantalum-recovery and lead-free soldering infrastructure will gain qualification advantages with OEMs mandating Scope 3 emissions reductions.

Platform Economics and Vertical Integration

Tier-1 capacitor producers are extending downstream into module-level solutions — pre-assembled DC-link capacitor banks, integrated EMI filter modules, and sensor-enabled smart capacitors that feed health data into industrial IoT platforms. This vertical integration compresses the value chain, raises barriers to entry, and shifts the Capacitor Market's competitive dynamic from component pricing toward system-level value propositions.


Capacitor Market Segmentation

By Capacitor Type

Segment Key Metric Primary Demand Driver
Ceramic Capacitors 45% share (2025) Smartphones, EVs, 5G base stations
Aluminum Electrolytic Capacitors USD 11.16 B (2025) Industrial power supplies, lighting
Film Capacitors (Paper & Plastic) 5.4% CAGR Renewable inverters, motor drives
Tantalum Capacitors USD 4.85 B (2025) Military/aerospace, medical devices
Supercapacitors 9.4% CAGR Grid storage, regenerative braking


Ceramic capacitors dominate the Capacitor Market by volume and value, driven by their compact form factor, broad temperature range, and cost efficiency at scale. The smartphone segment alone consumes approximately 1,000 ceramic capacitors per handset, and the shift to 5G-capable models has pushed average content per device up by 20–30% since 2021 [5]. The automotive tier — especially EV traction inverters and ADAS radar modules — is the primary growth vector for high-capacitance, automotive-grade ceramic lines.

Supercapacitors represent the most dynamic growth pocket within the Capacitor Market. Their ability to deliver burst power at charge-discharge rates 10–100 times faster than lithium-ion cells makes them essential for regenerative braking in urban transit, UPS bridge power in data centers, and fast-response frequency regulation on utility grids [14]. Global supercapacitor capacity is projected to triple between 2025 and 2035.

By End-Use Industry

Segment Key Metric Primary Demand Driver
Consumer Electronics 32% share (2025) Smartphones, laptops, wearables
Automotive 7.6% CAGR EV power modules, ADAS
Industrial USD 8.73 B (2025) Motor drives, factory automation
Telecommunications 6.3% CAGR 5G small cells, fiber networks
Power Transmission & Distribution USD 3.88 B (2025) Grid capacitor banks, HVDC links
Others 4% share (2025) Medical, aerospace, defense


Consumer electronics remains the volume backbone of the Capacitor Market, though its share is gradually eroding as automotive and industrial verticals grow faster. A single flagship smartphone now carries 1,000+ capacitors, a laptop roughly 800, and a smartwatch approximately 250 — numbers that climb with each feature-rich generation [13].

The automotive segment is expanding at the fastest clip within end-use categories. Beyond the sheer capacitor count per EV, the transition to 800V battery architectures requires capacitors rated for higher voltages and tighter thermal margins, commanding significant price premiums over consumer-grade equivalents.

By Voltage

Segment Key Metric Primary Demand Driver
Low Voltage (≤1 kV) 72% share (2025) Consumer electronics, IT hardware
High Voltage (>1 kV) 8.1% CAGR T&D infrastructure, EV inverters


Low-voltage capacitors account for the vast majority of unit shipments in the Capacitor Market, reflecting the dominance of sub-1kV applications in smartphones, PCs, and IoT devices. High-voltage capacitors, while smaller in unit volume, carry higher ASPs and are growing rapidly alongside utility-scale renewable installations and EV 800V platform adoption.


Regional Market Share Analysis

Region Key Metric Primary Investment Themes
Asia-Pacific 42% share (2025) MLCC fabrication, EV battery-pack electronics
North America 7.0% CAGR Chip-act reshoring, defense modernization
Europe USD 10.67 B (2025) Automotive OEM demand, green-grid buildout
South America 5% share (2025) Telecom expansion, consumer electronics growth
Middle East & Africa 6.2% CAGR Infrastructure electrification, solar deployment
Total USD 48.50 B

The Capacitor Market exhibits a distinctly Asia-Pacific-weighted geography, reflecting the region's dominance in electronics manufacturing and assembly. North America's growth trajectory is the steepest, however, fueled by reshoring legislation and defense procurement tailwinds.


North America

Country Key Metric Key Driver
United States 78% of regional share Defense procurement, data-center capex [11]
Canada 5.8% CAGR Clean-energy grid investment
Mexico USD 1.26 B (2025) Nearshoring electronics assembly


The United States alone accounts for over three-quarters of North American capacitor demand, propelled by USD 52.7 billion in CHIPS and Science Act funding that is drawing passive-component suppliers to establish qualification facilities near new semiconductor fabs in Arizona, Ohio, and Texas [21]. Canada's transition toward a net-zero grid by 2035 is stimulating demand for high-voltage film capacitors in HVDC converter stations, while Mexico's electronics maquiladora corridor continues to attract capacitor-intensive PCB assembly lines.

Europe

Country Key Metric Key Driver
Germany 28% of regional share Automotive EV platforms
United Kingdom 6.4% CAGR Offshore wind and grid storage
France USD 1.39 B (2025) Nuclear modernization, defense electronics
Italy 5.1% CAGR Industrial automation
Spain 4.8% CAGR Solar PV inverter rollout
Nordic Countries USD 0.72 B (2025) Green data centers, EV adoption
Russia 3.9% CAGR Import-substitution programs
Rest of Europe 12% of regional share Distributed renewables


Germany's position as Europe's largest automotive producer anchors its Capacitor Market share: each new Volkswagen MEB-platform vehicle consumes roughly 11,000 capacitors, nearly 40% more than its ICE predecessor [6]. The UK's planned 50 GW offshore wind capacity by 2030 will require thousands of high-voltage capacitor banks for HVDC transmission links to onshore substations.

Asia-Pacific

Country Key Metric Key Driver
China 38% of regional share Consumer electronics manufacturing, EV scale
Japan USD 4.48 B (2025) Tier-1 MLCC production dominance
South Korea 6.8% CAGR Semiconductor ecosystem, display electronics
India 8.3% CAGR PLI-scheme domestic manufacturing
ASEAN USD 1.83 B (2025) Assembly migration from China
Rest of Asia-Pacific 4.5% CAGR Emerging industrial demand


China produces more than half the world's consumer electronics and is rapidly scaling domestic EV output beyond 10 million units annually, making it the single largest country-level contributor to the Capacitor Market [6]. Japan remains the technological epicenter for high-end ceramic and tantalum capacitors, with Murata, TDK, and Taiyo Yuden collectively operating over 30 fabrication lines.

South America

Country Key Metric Key Driver
Brazil 62% of regional share Consumer electronics, telecom build-out
Argentina 5.0% CAGR Renewable energy deployment
Rest of South America USD 0.46 B (2025) General industrialization


Brazil's Capacitor Market participation is driven by Manaus Free Trade Zone electronics assembly and growing domestic EV interest following the ROTA 2030 automotive innovation program.

Middle East & Africa

Country Key Metric Key Driver
Saudi Arabia 30% of regional share NEOM and Vision 2030 infrastructure
UAE 6.8% CAGR Smart-city electronics projects
South Africa USD 0.34 B (2025) Grid stabilization, mining automation
Egypt 5.9% CAGR Telecom and industrial expansion
Rest of MEA 28% of regional share Rural electrification programs


Saudi Arabia's Vision 2030 megaprojects — including NEOM's estimated USD 500 billion development — are creating outsized demand for industrial capacitors in power-distribution, building-automation, and transportation electronics across the Middle East region.


Capacitor Market By Region, 2025-2035

Competitive Benchmarking

The Capacitor Market exhibits moderate concentration, with an estimated Herfindahl-Hirschman Index of approximately 1,100–1,300. The top five players collectively hold an estimated 48–55% revenue share, while a long tail of regional specialists and niche-application manufacturers fills the remainder. Competition centers on miniaturization capability, automotive qualification breadth, and raw-material sourcing resilience.

Company Est. Revenue Share Range Key Offerings Strategic Positioning
Murata Manufacturing Co., Ltd. ~12–15% MLCC, film capacitors, polymer capacitors Global MLCC leader; vertically integrated from ceramic powders to finished modules
Samsung Electro-Mechanics ~9–12% MLCC, tantalum capacitors Scale-driven cost leadership; captive Samsung Electronics demand
TDK Corporation ~8–11% Ceramic, film, aluminum electrolytic Broad product portfolio; strong automotive qualification pipeline
Taiyo Yuden Co., Ltd. ~5–8% High-capacitance MLCC, power inductors Specialization in ultra-small, high-cap ceramic components
KEMET Corporation (Yageo) ~5–7% Tantalum, film, ceramic, supercapacitors Full-spectrum passive portfolio after Yageo acquisition
AVX Corporation (Kyocera) ~4–6% Tantalum, ceramic, supercapacitors Aerospace/defense qualification strength
Vishay Intertechnology, Inc. ~4–6% Film, ceramic, tantalum, aluminum Broad industrial and automotive reach
Nippon Chemi-Con Corporation ~3–5% Aluminum electrolytic, conductive polymer Leading position in long-life electrolytic for industrial use
Panasonic Corporation ~3–5% Film, aluminum electrolytic, polymer EV and energy-storage focus; in-house demand synergy
Würth Elektronik GmbH & Co. KG ~2–4% Ceramic, film, aluminum electrolytic European distribution strength; rapid prototyping services


Recent News & Developments


  • U.S. Department of Defense (July 2024): Issued a Trusted Supplier Program directive requiring domestic or allied-nation sourcing for capacitors in all Tier-1 weapons platforms, affecting procurement valued at approximately USD 900 million annually [12].
  • Vishay Intertechnology (April 2024): Launched a new line of automotive-qualified polymer aluminum capacitors rated at 150°C for EV onboard charger applications, certified to AEC-Q200 [7].


Capacitor Market Report Scope

Parameter Detail
Market Scope Global Capacitor Market across all capacitor types, end-use industries, voltages, and regions
Study Period 2021–2035
CAGR 5.7% (2026–2035)
Market Size — 2025 (Base Year) USD 48.50 Billion
Market Size — 2035 (Forecast End) USD 84.45 Billion
Fastest Growing Segment Supercapacitors (By Type); Automotive (By End-Use)
Companies Profiled 10 (Murata, Samsung Electro-Mechanics, TDK, Taiyo Yuden, KEMET, AVX, Vishay, Nippon Chemi-Con, Panasonic, Würth Elektronik)
Valuation Currency USD (constant 2025 dollars)


FAQs

What capacitor type offers the best long-term value for high-reliability procurement?

Tantalum polymer capacitors deliver superior volumetric efficiency and stable ESR over 20+ year lifespans, making them preferred for aerospace and medical applications [12]. Their premium over ceramic alternatives narrows at quantities above 100,000 units.

How do tariff policies affect capacitor sourcing decisions?

U.S. Section 301 tariffs add 7.5–25% duties on Chinese-origin capacitors, pushing OEMs toward Japan- and South Korea-sourced alternatives [16]. Dual-sourcing strategies that split volume across tariff jurisdictions reduce landed-cost volatility.

What testing standards should buyers require for automotive-grade capacitors?

AEC-Q200 is the baseline qualification, but Tier-1 automotive OEMs increasingly demand additional board-level reliability testing beyond the standard [7]. Buyers should verify humidity-bias and thermal-shock test data specific to the target operating profile.

How do supercapacitors compare with lithium-ion cells for backup-power applications?

Supercapacitors offer 500,000+ charge cycles versus 2,000–5,000 for lithium-ion and deliver full discharge in seconds [14]. They suit short-duration bridging loads but lack the energy density for sustained backup beyond 60 seconds.

What supply-chain traceability measures mitigate counterfeit risk?

IDEA-STD-1010 inspection protocols and blockchain-based chain-of-custody tracking are emerging as industry best practices [17]. Purchasing exclusively through authorized distributors remains the most effective single countermeasure.

Which dielectric material advancements will reshape the Capacitor Market by 2030?

Antiferroelectric hafnium-zirconium oxide thin films promise 5–10× capacitance density improvements over barium titanate in sub-micron layers [22]. Commercialization timelines hinge on deposition-tool scalability and reliability qualification.

How should procurement teams evaluate capacitor total cost of ownership?

TCO models should incorporate unit price, qualification cost, field-failure rate, and end-of-life disposal fees — not component price alone [19]. A capacitor costing 20% more upfront can reduce system warranty expense by 40% over a product lifecycle.    
Author
Author
Author Profile
Aarti Dhapte LinkedIn
AVP - Research
A consulting professional focused on helping businesses navigate complex markets through structured research and strategic insights. I partner with clients to solve high-impact business problems across market entry strategy, competitive intelligence, and opportunity assessment. Over the course of my experience, I have led and contributed to 100+ market research and consulting engagements, delivering insights across multiple industries and geographies, and supporting strategic decisions linked to $500M+ market opportunities. My core expertise lies in building robust market sizing, forecasting, and commercial models (top-down and bottom-up), alongside deep-dive competitive and industry analysis. I have played a key role in shaping go-to-market strategies, investment cases, and growth roadmaps, enabling clients to make confident, data-backed decisions in dynamic markets.
Co-Author
Co-Author Profile
Aarti Dhapte LinkedIn
AVP - Research
A consulting professional focused on helping businesses navigate complex markets through structured research and strategic insights. I partner with clients to solve high-impact business problems across market entry strategy, competitive intelligence, and opportunity assessment. Over the course of my experience, I have led and contributed to 100+ market research and consulting engagements, delivering insights across multiple industries and geographies, and supporting strategic decisions linked to $500M+ market opportunities. My core expertise lies in building robust market sizing, forecasting, and commercial models (top-down and bottom-up), alongside deep-dive competitive and industry analysis. I have played a key role in shaping go-to-market strategies, investment cases, and growth roadmaps, enabling clients to make confident, data-backed decisions in dynamic markets.

Research Approach

Secondary Research

The secondary research process involved comprehensive analysis of regulatory databases, peer-reviewed engineering journals, technical publications, and authoritative electronics industry organizations. Key sources included the US Department of Energy (DOE), European Commission Directorate-General for Internal Market, Industry, Entrepreneurship and SMEs (DG GROW), International Electrotechnical Commission (IEC), Institute of Electrical and Electronics Engineers (IEEE), Electronic Components Industry Association (ECIA), Passive Components Industry Association (PCIA), Japan Electronics and Information Technology Industries Association (JEITA), China Electronic Components Industry Association (CECA), US Bureau of Industry and Security (BIS), International Trade Administration (ITA), United Nations Industrial Development Organization (UNIDO), Organisation for Economic Co-operation and Development (OECD) Industrial Database, US Census Bureau Annual Survey of Manufactures, Eurostat Structural Business Statistics, and national electronics manufacturing associations from key markets. These sources were used to collect production statistics, regulatory compliance data, technical safety standards, raw material pricing trends, and competitive landscape analysis for ceramic capacitors, aluminum electrolytic capacitors, tantalum capacitors, film and paper capacitors, and supercapacitors/EDLC technologies.

Primary Research

Qualitative and quantitative insights were obtained by interviewing supply-side and demand-side stakeholders during the primary research process. CEOs, VPs of Manufacturing Operations, leaders of R&D and product innovation, supply chain directors, and regional sales managers from capacitor manufacturers, passive component OEMs, and dielectric material suppliers comprised supply-side sources. The procurement chiefs of automotive OEMs, electronics manufacturing services (EMS) providers, renewable energy system integrators, telecommunications infrastructure providers, and industrial automation companies were the demand-side sources. Market segmentation was validated, technology roadmap timelines were confirmed, and insights regarding capacitor adoption patterns in EV powertrains, 5G infrastructure, and industrial IoT applications were obtained through primary research. Additionally, pricing volatility was associated with palladium, tantalum, and nickel supply constraints.

Primary Respondent Breakdown:

By Designation: C-level Primaries (29%), Director Level (41%), Others (30%)

By Region: North America (31%), Europe (33%), Asia-Pacific (29%), Rest of World (7%)

Market Size Estimation

Global market valuation was derived through revenue mapping and shipment volume analysis. The methodology included:

Identification of 60+ key manufacturers across North America, Europe, Asia-Pacific, and Latin America

Product mapping across ceramic (MLCC, disc, tubular), aluminum electrolytic (SMD, radial, snap-in, screw terminal), tantalum (MnO₂, polymer, wet slug), film/PP/PET/paper, and supercapacitor/EDLC categories

Analysis of reported and modeled annual revenues specific to capacitor product portfolios

Coverage of manufacturers representing 75-80% of global market share in 2024

Extrapolation using bottom-up (unit shipment volume × ASP by dielectric type and end-use application) and top-down (manufacturer revenue validation) approaches to derive segment-specific valuations, with additional cross-verification against import/export trade data from UN Comtrade and national customs databases

Download Free Sample

Kindly complete the form below to receive a free sample of this Report

Download PDF ×

We do not share your information with anyone. However, we may send you emails based on your report interest from time to time. You may contact us at any time to opt-out.