Segmentation Quick Reference
| Dimension | Sub-Segments | Dominant Segment | Fastest Growing Segment |
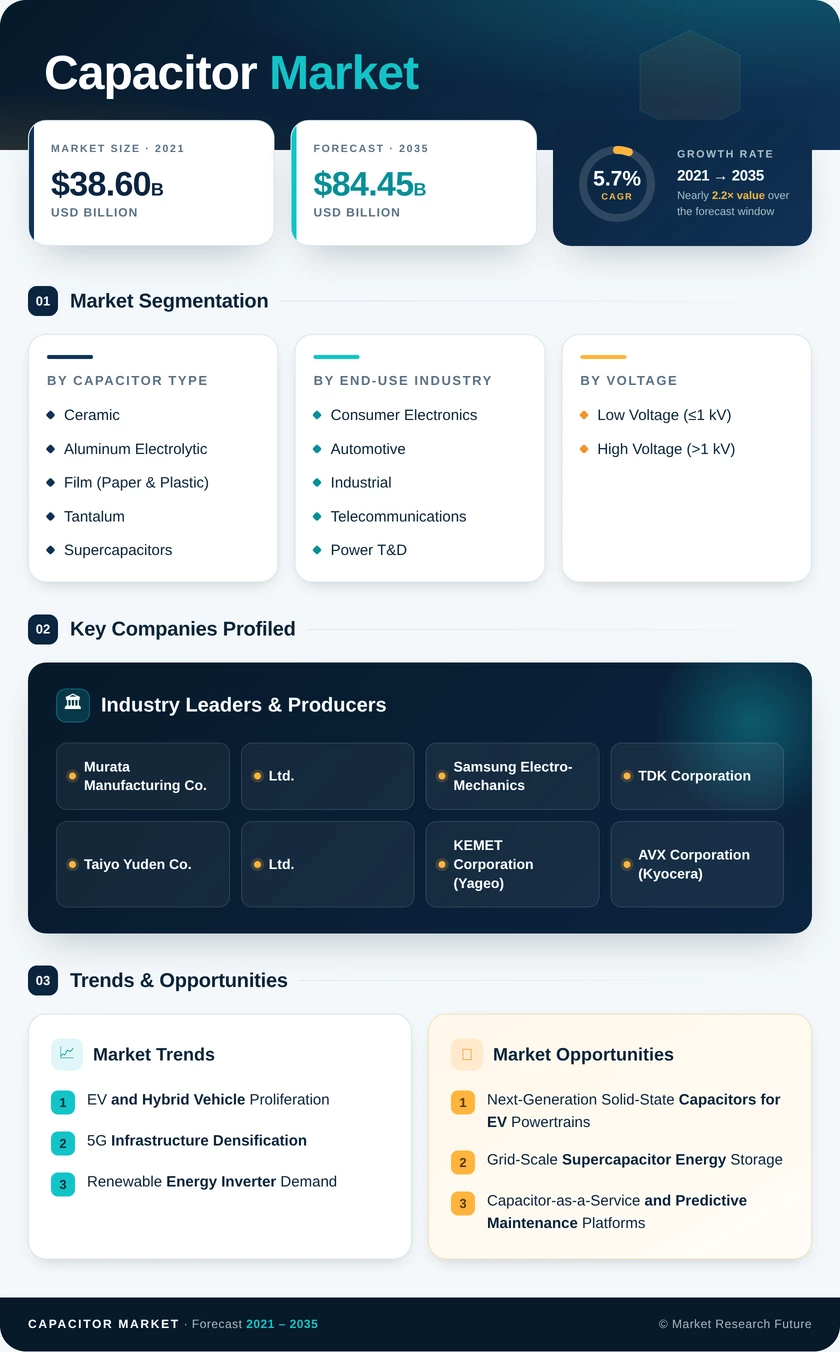
| By Capacitor Type | Ceramic, Aluminum Electrolytic, Film (Paper & Plastic), Tantalum, Supercapacitors | Ceramic Capacitors | Supercapacitors |
| By End-Use Industry | Consumer Electronics, Automotive, Industrial, Telecommunications, Power T&D, Others | Consumer Electronics | Automotive |
| By Voltage | Low Voltage (≤1 kV), High Voltage (>1 kV) | Low Voltage | High Voltage |
Market Segmentation Overview
By Capacitor Type
| Sub-Segment | Key Trend |
| Ceramic Capacitors | Miniaturization to 0201 and 01005 sizes for high-density PCB mounting; automotive-grade expansion |
| Aluminum Electrolytic Capacitors | Shift toward conductive-polymer hybrids for improved lifespan and ESR performance |
| Film Capacitors (Paper & Plastic) | Growing adoption in EV DC-link and renewable inverter applications |
| Tantalum Capacitors | Premium defense and medical-device demand; supply-chain diversification from conflict regions |
| Supercapacitors | Grid-storage pilot commercialization; regenerative braking integration in urban transit |
Ceramic capacitors continue to dominate shipment volumes across consumer, automotive, and telecom applications, while supercapacitors are carving out high-growth niches in energy storage and fast-discharge industrial scenarios.
By End-Use Industry
| Sub-Segment | Key Trend |
| Consumer Electronics | Rising capacitor content per device driven by 5G, OLED, and sensor integration |
| Automotive | Transition to 800V architectures driving demand for high-voltage, high-temperature capacitors |
| Industrial | Factory-automation and motor-drive upgrades replacing legacy electrolytic with polymer types |
| Telecommunications | 5G small-cell densification expanding ceramic and tantalum capacitor consumption |
| Power Transmission & Distribution | HVDC links and grid-stability capacitor banks growing with renewable buildout |
| Others | Aerospace, defense, and medical devices requiring MIL-spec and high-reliability grades |
Consumer electronics remains the largest single vertical, though automotive is closing the gap as electrification drives per-vehicle capacitor counts beyond 10,000 units.
By Voltage
| Sub-Segment | Key Trend |
| Low Voltage (≤1 kV) | Volume leader; ongoing miniaturization for mobile and IoT applications |
| High Voltage (>1 kV) | Faster growth trajectory; driven by EV inverters, renewable grid, and T&D infrastructure |
Low-voltage capacitors dominate total unit shipments, but high-voltage segments command higher average selling prices and are expanding at nearly double the overall market growth rate.