• Cat-intel
  • MedIntelliX
  • Resources
  • About Us
  • Hero Background
    English
    Chinese
    French
    Japanese
    Korean
    German
    Spanish

    Captive Power Generation Market Analysis

    ID: MRFR/E&P/8966-HCR
    111 Pages
    Anshula Mandaokar
    October 2025

    Captive Power Generation Market Research Report By Technology (Heat Exchangers, Turbines, Gas Engines, Transformers, Others), Fuel (Diesel, Gas, Coal, Others), Ownership (Single Ownership and Multiple Ownership), Connectivity (OffGrid and On-Grid), End Use (Industrial, Commercial, Residential) and By Region (North America, Europe, Asia-Pacific, and Rest of the World) –Market Forecast Till 2035

    Share:
    Download PDF ×

    We do not share your information with anyone. However, we may send you emails based on your report interest from time to time. You may contact us at any time to opt-out.

    Captive Power Generation Market Infographic
    $ 4,950.0
    $ 5,950.0
    $ 7,250.0

    Market Analysis

    In-depth Analysis of Captive Power Generation Market Industry Landscape

    The growth dynamics and prospects of Captive Power Generation market are shaped by various market forces influencing it. Amongst them is the need for reliable uninterrupted supply by manufacturing and commercial establishments. The term refers to production for self-consumption meaning that businesses can control their own source which reduces dependence on grid connection. Manufacturing facilities such as data centers require constant electricity supply thus, they prefer generating their own electricity so as not be tempted by the national grid. The market dynamics of captively generated electric utilities feature advanced technical designs among other factors including distributed resource solutions in electric utilities. There is continuous innovation in generator designs, combined power plants and renewable energy products that help create efficient and eco-friendly captive power systems. As industries are looking for cost-effective and environmentally friendly energy solutions, manufacturers invest in research and development to come up with advanced generation technologies. Similarly, regulatory frameworks and policies shape the Captive Power Generation market. Governments around the world introduce measures to encourage industry into captive power generation for the purposes of increasing energy security, minimizing transmission losses related to energy supply as well as fostering cleaner sources of electricity. Their support by policies has led to increased uptake of on-site power plants across major sectors." Various economic aspects such as grid electricity cost, influence Captive Power Generation Market. When they evaluate the installation of captive power plants in industries, the viability of the projects is anchored on the prevailing prices of electric power and general state of economy for that region. Escalating costs of grid electricity may lead to a situation where industrial plants consider this method as an alternative that can help them manage their operational costs more effectively and remain competitive. Although during economic recessions, new captive generation projects may slow down, many businesses still view onsite power generation as a long-term cost-saving benefit. Captive Power Generation’s market dynamics are influenced by environmental considerations and growing emphasis on sustainability. Among their captive power generation strategies being adopted by companies include renewable-energy options; cogeneration; and adoption of other eco-friendly technologies. The urge to reduce carbon footprints and comply with environmental regulations makes firms look into cleaner forms of power generation which can be sustained in future hence embedding renewable energy sources into captive systems.

    Market Summary

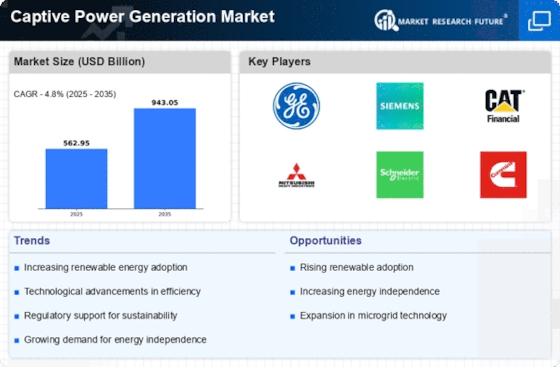
    As per MRFR analysis, the Captive Power Generation Market Size was estimated at 562.95 USD Billion in 2024. The Captive Power Generation industry is projected to grow from 589.98 USD Billion in 2025 to 943.05 USD Billion by 2035, exhibiting a compound annual growth rate (CAGR) of 4.8 during the forecast period 2025 - 2035.

    Key Market Trends & Highlights

    The Captive Power Generation Market is experiencing a transformative shift towards renewable energy and technological advancements.

    • The integration of renewable energy sources is increasingly shaping the Captive Power Generation Market, particularly in North America.
    • Technological advancements in energy management systems are enhancing operational efficiency across various segments.
    • Regulatory support for self-generation is fostering growth, especially in the Asia-Pacific region, which is currently the fastest-growing market.
    • The rising energy demand and cost efficiency are driving the adoption of gas engines, while innovations in turbines are gaining traction.

    Market Size & Forecast

    2024 Market Size 562.95 (USD Billion)
    2035 Market Size 943.05 (USD Billion)
    CAGR (2025 - 2035) 4.8%
    Largest Regional Market Share in 2024 Asia Pacific

    Major Players

    <p>General Electric (US), Siemens (DE), Caterpillar (US), Mitsubishi Heavy Industries (JP), Schneider Electric (FR), Cummins (US), Wärtsilä (FI), ABB (CH), MAN Energy Solutions (DE)</p>

    Market Trends

    The Captive Power Generation Market is currently experiencing a notable transformation, driven by various factors including the increasing demand for reliable energy sources and the growing emphasis on sustainability. Industries are increasingly recognizing the advantages of generating their own power, which not only enhances energy security but also reduces dependence on grid electricity. This shift is particularly evident in sectors such as manufacturing, mining, and commercial enterprises, where operational continuity is paramount. Furthermore, advancements in technology are facilitating the integration of renewable energy sources, thereby aligning with global efforts to mitigate climate change. In addition to technological advancements, regulatory frameworks are evolving to support the growth of the Captive Power Generation Market. Governments are implementing policies that encourage self-generation and the use of clean energy, which may further stimulate investment in this sector. As organizations seek to optimize their energy consumption and reduce costs, the trend towards captive power generation appears poised for continued expansion. The market landscape is likely to witness increased competition among energy providers, as well as innovations in energy management solutions, which could enhance efficiency and sustainability in power generation practices.

    Rise of Renewable Energy Integration

    The Captive Power Generation Market is witnessing a marked shift towards the integration of renewable energy sources. Industries are increasingly adopting solar, wind, and biomass technologies to generate power on-site, which not only reduces carbon footprints but also enhances energy independence. This trend reflects a broader commitment to sustainability and aligns with global climate goals.

    Technological Advancements in Energy Management

    Innovations in energy management systems are transforming the Captive Power Generation Market. Enhanced monitoring and control technologies enable organizations to optimize energy usage, improve efficiency, and reduce operational costs. These advancements facilitate better integration of diverse energy sources, including renewables, into existing power generation frameworks.

    Regulatory Support for Self-Generation

    Government policies are increasingly favoring self-generation initiatives within the Captive Power Generation Market. Regulatory frameworks are being established to incentivize industries to invest in captive power solutions, thereby promoting energy security and sustainability. This supportive environment is likely to drive further growth and innovation in the sector.

    The trend towards increased self-sufficiency in energy generation is reshaping the landscape of the captive power generation market, as industries seek to mitigate risks associated with grid dependency and enhance operational resilience.

    U.S. Energy Information Administration

    Captive Power Generation Market Market Drivers

    Increasing Energy Demand

    The Captive Power Generation Market is experiencing a notable surge in energy demand across various sectors, including manufacturing, mining, and commercial enterprises. This heightened demand is primarily driven by industrial growth and urbanization, which necessitate reliable and uninterrupted power supply. According to recent data, energy consumption in industrial sectors has increased by approximately 3.5 percent annually, indicating a robust need for self-generated power solutions. Companies are increasingly turning to captive power generation to mitigate risks associated with grid failures and fluctuating energy prices. This trend suggests that businesses are prioritizing energy independence, thereby propelling the growth of the captive power generation market.

    Cost Efficiency and Economic Viability

    Cost efficiency remains a pivotal driver in the Captive Power Generation Market. Organizations are increasingly recognizing the financial benefits of generating their own power, particularly in regions where electricity tariffs are high. By investing in captive power systems, companies can significantly reduce their operational costs, as they are less susceptible to price volatility in the energy market. Recent analyses indicate that businesses can save up to 30 percent on energy costs by utilizing captive generation. This economic viability is particularly appealing to sectors with high energy consumption, such as manufacturing and heavy industries, further stimulating the growth of the captive power generation market.

    Regulatory Incentives for Self-Generation

    Regulatory frameworks are increasingly favoring self-generation, which is a significant driver for the Captive Power Generation Market. Governments are implementing policies that encourage businesses to invest in captive power systems, including tax incentives, subsidies, and streamlined permitting processes. These regulatory incentives are designed to promote energy independence and reduce reliance on traditional grid systems. Recent reports indicate that regions with supportive regulatory environments have seen a 20 percent increase in captive power installations. This trend suggests that favorable policies are likely to continue driving the growth of the captive power generation market, as businesses seek to capitalize on these opportunities.

    Technological Innovations in Power Generation

    Technological advancements are reshaping the Captive Power Generation Market, enabling more efficient and sustainable energy solutions. Innovations such as combined heat and power (CHP) systems, advanced energy storage, and smart grid technologies are enhancing the performance and reliability of captive power systems. These technologies not only improve energy efficiency but also facilitate the integration of renewable energy sources, which is becoming increasingly important. The adoption of such technologies is projected to grow, with estimates suggesting a compound annual growth rate of 5 percent in the next five years. This trend indicates a shift towards more sophisticated energy management practices within the captive power generation market.

    Environmental Sustainability and Corporate Responsibility

    The growing emphasis on environmental sustainability is influencing the Captive Power Generation Market. Companies are increasingly adopting captive power generation as part of their corporate social responsibility initiatives, aiming to reduce their carbon footprint and enhance their sustainability profiles. The shift towards cleaner energy sources, such as solar and wind, is becoming more pronounced, with many organizations committing to net-zero emissions targets. Data indicates that businesses utilizing renewable captive power solutions can reduce greenhouse gas emissions by up to 50 percent. This commitment to sustainability not only aligns with consumer expectations but also positions companies favorably in the market, thereby driving the growth of the captive power generation market.

    Market Segment Insights

    By Technology: Gas Engines (Largest) vs. Turbines (Fastest-Growing)

    <p>In the Captive Power Generation Market, the technology segment exhibits a diverse array of segment values, primarily composed of Gas Engines, Turbines, Heat Exchangers, Transformers, and Others. Gas Engines dominate the market due to their efficiency and reliability, holding a substantial share compared to Turbines, which are rapidly gaining traction as a preferred choice for new installations. Heat Exchangers and Transformers also play critical roles, although they hold comparatively smaller shares in this segment.</p>

    <p>Technology: Gas Engines (Dominant) vs. Turbines (Emerging)</p>

    <p>Gas Engines have established themselves as the dominant technology in the captive power generation landscape, known for their efficiency and flexibility in power generation applications. They are particularly favored in industrial settings due to their ability to operate on various gases and their quick start-up times. On the other hand, Turbines represent an emerging technology that is rapidly gaining popularity for their scalability and high-power output, particularly in renewable contexts. As technologies evolve, Turbines are becoming increasingly integrated with renewable energy sources, offering a cleaner and more sustainable solution for captive power generation, thereby positioning themselves as a strong contender in the market.</p>

    By Fuel: Diesel (Largest) vs. Gas (Fastest-Growing)

    <p>In the Captive Power Generation Market, the fuel segment is diverse, encompassing Diesel, Gas, Coal, and Others. Diesel remains the largest fuel source owing to its widespread availability and reliability in remote applications where grid access is limited. Gas follows closely, gaining traction due to its cleaner burning properties and increasing support from government policies aimed at reducing carbon emissions. The presence of Coal remains stable as a traditional energy source, but its growth is challenged by environmental regulations favoring cleaner fuels.</p>

    <p>Diesel (Dominant) vs. Gas (Emerging)</p>

    <p>The dominance of Diesel in the captive power generation sector can be attributed to its robust performance and adaptability in various operational settings. Diesel generators are preferred for their quick start-up capabilities and high energy density, making them suitable for emergency and peak load scenarios. In contrast, Gas has emerged as a significant player, driven by the shift towards cleaner energy alternatives. With advancements in gas turbine technology and the supportive regulatory environment promoting natural gas usage, it is quickly gaining ground as an efficient and environmentally friendly option for captive power generation.</p>

    By Ownership: Single Ownership (Largest) vs. Multiple Ownership (Fastest-Growing)

    <p>In the Captive Power Generation Market, the ownership segment reveals a distinct division between Single Ownership and Multiple Ownership. Single Ownership holds a significant share of the market, characterized by individual entities investing in and managing their own power generation systems. This model offers a degree of control and reliability that appeals to large industrial players and critical infrastructure. On the other hand, Multiple Ownership models, where several stakeholders collaborate on power generation, are gaining traction, indicating a shift in operational strategies among businesses. The growth trends within the Ownership segment highlight an increasing interest in Multiple Ownership structures, mainly driven by rising energy costs and the need for energy security. Companies are recognizing the value of shared resources, which not only reduces capital expenditure but also enables scalability and flexibility in energy production. Factors such as deregulation of energy markets and advancements in technology further fuel the trend towards multiple ownership, allowing diversified investments and shared risks.</p>

    <p>Ownership: Single Ownership (Dominant) vs. Multiple Ownership (Emerging)</p>

    <p>The characteristics of Single Ownership in the Captive Power Generation Market position it as a dominant force. This model allows companies to take complete control over their energy resources, optimizing efficiency and ensuring reliable supply tailored to specific operational needs. Companies investing in single ownership often benefit from long-term stability, as they can directly manage expenditures and align energy usage with corporate strategies. In contrast, Multiple Ownership represents an emerging trend, encouraging collaboration among businesses to create pooled resources. This method fosters innovation and adaptability, enabling participants to share responsibilities and risks. As energy demands evolve, both ownership models are likely to coexist, catering to diverse business needs and operational preferences in the sector.</p>

    By Connectivity: On-Grid (Largest) vs. OffGrid (Fastest-Growing)

    <p>In the Captive Power Generation Market, the distribution of market share between On-Grid and OffGrid segments reveals a clear dominance of On-Grid solutions, which continue to serve as the backbone of power generation efforts. These interconnected systems leverage existing infrastructure, provide reliability, and cater to large-scale industrial establishments. Conversely, the OffGrid segment has seen rapid growth, driven by the need for energy independence, especially in rural areas and developing markets where electricity access is limited. As global energy demands rise and sustainability efforts gain momentum, the OffGrid segment is positioned for exponential growth. Technological advancements in renewable energy sources, such as solar and wind, coupled with governmental support for decentralized energy production, are fueling this trend. The market's shift towards decentralized generation is evident, with OffGrid solutions appealing to consumers seeking cost-effective, resilient, and clean energy alternatives, thereby shaping the market's long-term trajectory.</p>

    <p>Connectivity: On-Grid (Dominant) vs. OffGrid (Emerging)</p>

    <p>The On-Grid segment is characterized by its efficient integration with national or regional power grids, allowing for seamless energy production and distribution. This segment benefits from economies of scale, reduced operational costs, and enhanced reliability, making it the preferred choice for larger industries and commercial applications. Meanwhile, the OffGrid segment, categorized as emerging, represents a dynamic shift towards localized energy solutions. It primarily focuses on self-sufficiency and resilience, providing energy access to underserved populations. OffGrid systems often incorporate a mix of renewable energy sources and energy storage solutions, addressing the growing demand for sustainable practices and energy independence. The appeal of OffGrid technology is increasing, particularly in areas facing instability in traditional power supply, making it an attractive option for diverse energy consumers.</p>

    By End Use: Industrial (Largest) vs. Residential (Fastest-Growing)

    <p>In the Captive Power Generation Market, the industrial segment stands out as the largest contributor, benefiting from the high electricity demands of manufacturing and large-scale operations. This sector significantly relies on captive power generation to ensure energy security and efficiency, especially in regions with unreliable grid infrastructure. The commercial segment is notable as well, driven by the need for continuous power supply in hospitals, data centers, and office complexes, while the residential segment, although smaller, is quickly gaining traction due to increasing reliance on decentralized energy systems.</p>

    <p>Commercial: Dominant vs. Residential: Emerging</p>

    <p>The commercial segment is characterized by its dominance in the captive power generation landscape, with businesses seeking reliable, cost-effective energy solutions to maintain operations and reduce grid dependency. This segment encompasses a diverse range of users, including shopping malls, hospitals, and educational institutions, all of which have critical power needs. On the other hand, the residential segment is emerging rapidly, driven by increased consumer awareness of renewable energy options and government incentives for green technologies. As households look for ways to reduce electricity bills and enhance energy independence, the adoption of solar PV systems and battery storage solutions is on the rise, positioning residential captive power generation as a vital component of the future energy ecosystem.</p>

    Get more detailed insights about Captive Power Generation Market Research Report - Global Forecast till 2032

    Regional Insights

    North America : Energy Innovation Leader

    North America is witnessing significant growth in the captive power generation market, driven by increasing energy demands and a shift towards sustainable energy solutions. The region holds approximately 40% of the global market share, making it the largest market. Regulatory support for renewable energy and energy independence initiatives further catalyze this growth. The demand for reliable power sources in industrial sectors is also a key driver. The United States and Canada are the leading countries in this market, with major players like General Electric and Caterpillar dominating the landscape. The competitive environment is characterized by technological advancements and strategic partnerships among key players. The presence of established companies ensures a robust supply chain and innovation in captive power solutions, enhancing market competitiveness.

    Europe : Sustainable Energy Transition

    Europe is emerging as a significant player in the captive power generation market, driven by stringent environmental regulations and a strong push for renewable energy sources. The region accounts for approximately 30% of the global market share, making it the second-largest market. Government initiatives aimed at reducing carbon emissions and enhancing energy efficiency are key growth drivers. The increasing adoption of decentralized energy systems is also contributing to market expansion. Germany, France, and the UK are at the forefront of this market, with companies like Siemens and Schneider Electric leading the charge. The competitive landscape is marked by innovation in energy technologies and a focus on sustainability. The presence of key players fosters a dynamic environment for growth, as they invest in research and development to meet evolving energy demands.

    Asia-Pacific : Emerging Market Potential

    Asia-Pacific is rapidly becoming a powerhouse in the captive power generation market, driven by industrialization and urbanization. The region holds approximately 25% of the global market share, with countries like India and China leading the charge. The increasing demand for reliable power supply in manufacturing and infrastructure development is a significant growth driver. Government policies promoting energy security and investment in renewable technologies are also catalysts for market expansion. India and China are the leading countries in this sector, with a growing presence of key players such as Mitsubishi Heavy Industries and Wärtsilä. The competitive landscape is evolving, with local and international companies vying for market share. The focus on innovation and cost-effective solutions is shaping the future of captive power generation in the region, making it an attractive market for investment.

    Middle East and Africa : Resource-Rich Opportunities

    The Middle East and Africa region is witnessing a surge in demand for captive power generation, driven by rapid economic growth and energy needs. The region accounts for approximately 5% of the global market share, with countries like South Africa and the UAE leading the way. The increasing focus on energy diversification and investment in infrastructure projects are key growth drivers. Regulatory frameworks supporting private power generation are also enhancing market opportunities. South Africa and the UAE are the primary markets, with key players like ABB and MAN Energy Solutions actively participating. The competitive landscape is characterized by a mix of local and international companies, fostering innovation and collaboration. The region's unique energy challenges present opportunities for tailored solutions, making it an attractive market for captive power generation investments.

    Key Players and Competitive Insights

    The Captive Power Generation Market is currently characterized by a dynamic competitive landscape, driven by increasing energy demands and a growing emphasis on sustainability. Major players such as General Electric (US), Siemens (DE), and Wärtsilä (FI) are strategically positioning themselves through innovation and regional expansion. General Electric (US) focuses on integrating advanced technologies into its power generation solutions, while Siemens (DE) emphasizes digital transformation to enhance operational efficiency. Meanwhile, Wärtsilä (FI) is leveraging its expertise in flexible power generation to cater to the evolving needs of various industries, collectively shaping a competitive environment that prioritizes technological advancement and sustainability.

    Key business tactics within the Captive Power Generation Market include localizing manufacturing and optimizing supply chains to enhance responsiveness to regional demands. The market appears moderately fragmented, with a mix of established players and emerging companies vying for market share. The collective influence of key players fosters a competitive structure that encourages innovation and collaboration, as companies seek to differentiate themselves through unique value propositions.

    In August 2025, General Electric (US) announced a partnership with a leading renewable energy firm to develop hybrid power solutions that combine traditional and renewable energy sources. This strategic move is likely to enhance GE's portfolio, allowing it to offer more sustainable options to its clients while addressing the growing demand for cleaner energy solutions. The partnership underscores GE's commitment to innovation and its proactive approach to adapting to market trends.

    In September 2025, Siemens (DE) unveiled a new digital platform aimed at optimizing energy management for industrial clients. This platform integrates AI and IoT technologies to provide real-time insights into energy consumption and efficiency. The introduction of this platform signifies Siemens' focus on digitalization, which is increasingly becoming a critical factor in the competitive landscape, as companies strive to enhance operational efficiency and reduce costs.

    In July 2025, Wärtsilä (FI) launched a new line of modular power generation units designed for rapid deployment in remote areas. This initiative reflects Wärtsilä's strategy to cater to underserved markets and enhance energy access. The modular design allows for flexibility and scalability, positioning Wärtsilä as a leader in providing tailored solutions that meet diverse customer needs.

    As of October 2025, the Captive Power Generation Market is witnessing significant trends such as digitalization, sustainability, and the integration of AI technologies. Strategic alliances among key players are shaping the current landscape, fostering innovation and collaboration. Looking ahead, competitive differentiation is likely to evolve from traditional price-based competition to a focus on technological innovation, supply chain reliability, and sustainable practices, as companies adapt to the changing energy landscape.

    Key Companies in the Captive Power Generation Market market include

    Industry Developments

    Aug-2022:To cater to the captive needs of round-the-clock power and intermittent energy for Green Hydrogen, Reliance Industries plans on establishing 20 GW of solar energy generation capacity by 2025.

    Future Outlook

    Captive Power Generation Market Future Outlook

    <p>The Captive Power Generation Market is projected to grow at a 4.8% CAGR from 2024 to 2035, driven by increasing energy demands, technological advancements, and sustainability initiatives.</p>

    New opportunities lie in:

    • <p>Integration of renewable energy sources for hybrid systems</p>
    • <p>Development of energy storage solutions to enhance reliability</p>
    • <p>Expansion of microgrid technologies for localized power generation</p>

    <p>By 2035, the market is expected to achieve robust growth, positioning itself as a key player in global energy solutions.</p>

    Market Segmentation

    Captive Power Generation Market Fuel Outlook

    • Diesel
    • Gas
    • Coal
    • Others

    Captive Power Generation Market End Use Outlook

    • Industrial
    • Commercial
    • Residential

    Captive Power Generation Market Ownership Outlook

    • Single Ownership
    • Multiple Ownership

    Captive Power Generation Market Technology Outlook

    • Heat Exchangers
    • Turbines
    • Gas Engines
    • Transformers
    • Others

    Captive Power Generation Market Connectivity Outlook

    • OffGrid
    • On-Grid

    Report Scope

    MARKET SIZE 2024562.95(USD Billion)
    MARKET SIZE 2025589.98(USD Billion)
    MARKET SIZE 2035943.05(USD Billion)
    COMPOUND ANNUAL GROWTH RATE (CAGR)4.8% (2024 - 2035)
    REPORT COVERAGERevenue Forecast, Competitive Landscape, Growth Factors, and Trends
    BASE YEAR2024
    Market Forecast Period2025 - 2035
    Historical Data2019 - 2024
    Market Forecast UnitsUSD Billion
    Key Companies ProfiledMarket analysis in progress
    Segments CoveredMarket segmentation analysis in progress
    Key Market OpportunitiesIntegration of renewable energy sources enhances sustainability in the Captive Power Generation Market.
    Key Market DynamicsRising demand for energy independence drives investment in captive power generation technologies and infrastructure.
    Countries CoveredNorth America, Europe, APAC, South America, MEA

    Market Highlights

    Author

    Anshula Mandaokar
    Team Lead - Research

    She holds an experience of about 6+ years in market research and business consulting, working under the spectrum of information communication technology, telecommunications and semiconductor domains. aarti conceptualizes and implements a scalable business strategy and provides strategic leadership to the clients. her expertise lies in market estimation, competitive intelligence, pipeline analysis, customer assessment, etc.

    Leave a Comment

    Latest Comments

    John Doe
    john@example.com

    This is a great article! Really helped me understand the topic better.

    Posted on July 23, 2025, 10:15 AM
    Jane Smith
    jane@domain.com

    Thanks for sharing this. I’ve bookmarked it for later reference.

    Posted on July 22, 2025, 7:45 PM

    FAQs

    What is the projected market valuation for the Captive Power Generation Market in 2035?

    The Captive Power Generation Market is projected to reach a valuation of 943.05 USD Billion by 2035.

    What was the market valuation for the Captive Power Generation Market in 2024?

    In 2024, the overall market valuation for the Captive Power Generation Market was 562.95 USD Billion.

    What is the expected CAGR for the Captive Power Generation Market from 2025 to 2035?

    The expected CAGR for the Captive Power Generation Market during the forecast period 2025 - 2035 is 4.8%.

    Which companies are considered key players in the Captive Power Generation Market?

    Key players in the Captive Power Generation Market include General Electric, Siemens, Caterpillar, Mitsubishi Heavy Industries, Schneider Electric, Cummins, Wärtsilä, ABB, and MAN Energy Solutions.

    What are the projected values for the Gas segment in the Captive Power Generation Market?

    The Gas segment is projected to grow from 200.0 USD Billion to 320.0 USD Billion during the forecast period.

    How does the On-Grid connectivity segment perform in terms of market valuation?

    The On-Grid connectivity segment is expected to increase from 450.36 USD Billion to 758.05 USD Billion by 2035.

    1. Executive Summary
    2. Market Introduction
      1. Market Definition
      2. Scope of The Study
      3. Market Structure
    3. Research Methodology
      1. Primary Research
      2. Secondary Research
      3. Market Size Estimation
      4. Forecast Model
      5. List of Assumptions
    4. Market Landscape
    5. Market Dynamics
      1. Introduction
      2. Market Drivers
      3. Market Restraints
      4. Market Opportunities
      5. Porter’s Five
        1. Bargaining Power of Suppliers
        2. Threat of Substitutes
        3. Intensity of Rivalry
      6. Forces Analysis
      7. 5.5.1
      8. Threat of New Entrants
      9. 5.5.2
      10. Bargaining Power of Buyers
      11. Value Chain/Supply Chain Analysis
    6. Global Captive Power Generation
    7. Market, by Technology
      1. 6.1
      2. Introduction
      3. 6.2
      4. Heat Exchangers
      5. 6.2.1
      6. Market Estimates & Forecast, 2023-2032
      7. 6.3
      8. Turbines
      9. 6.3.1
      10. Market Estimates & Forecast, 2023-2032
      11. 6.3.3
      12. Market Estimates & Forecast, 2023-2032
      13. & Forecast, by Region, 2023-2032
      14. & Forecast, 2023-2032
      15. & Forecast, 2023-2032
      16. Forecast, by Region, 2023-2032
    8. Market Estimates & Forecast, by Region,
    9. Market Estimates & Forecast, by Region,
      1. Gas Engines
        1. Market Estimates & Forecast, 2023-2032
        2. Market Estimates
        3. Market Estimates & Forecast, 2023-2032
      2. Transformers
        1. Market Estimates
        2. Market Estimates & Forecast, by Region, 2023-2032
        3. Market Estimates
      3. Others
        1. Market Estimates & Forecast, 2023-2032
        2. Market Estimates &
        3. Market Estimates & Forecast, 2023-2032
    10. Global Captive Power Generation
    11. Market, by Fuel
      1. 7.1
      2. Introduction
      3. 7.2
      4. Diesel
      5. 7.2.1
      6. Market Estimates & Forecast, 2023-2032
      7. 7.3
      8. Gas
      9. Estimates & Forecast, 2023-2032
      10. Forecast, 2023-2032
      11. 7.4.2
    12. Market Estimates & Forecast, by Region,
    13. Market
    14. Market Estimates & Forecast, by Region, 2023-2032
      1. Coal
        1. Market Estimates &
    15. Market Estimates & Forecast, by Region, 2023-2032
      1. Others
        1. Market Estimates & Forecast, 2023-2032
        2. Market Estimates
      2. & Forecast, by Region, 2023-2032
    16. Global Captive Power Generation Market, by Ownership
      1. Introduction
      2. Single Ownership
        1. Market Estimates
        2. Market Estimates & Forecast, by Region, 2023-2032
      3. & Forecast, 2023-2032
      4. Multiple Ownership
        1. Market Estimates
        2. Market Estimates & Forecast, by Region, 2023-2032
      5. & Forecast, 2023-2032
    17. Global Captive Power
    18. Generation Market, by Connectivity
      1. Introduction
      2. Off-Grid
        1. Market Estimates & Forecast, 2023-2032
        2. Market Estimates
      3. & Forecast, by Region, 2023-2032
      4. On-Grid
        1. Market Estimates & Forecast, 2023-2032
        2. Market Estimates
      5. & Forecast, by Region, 2023-2032
    19. Global Captive Power Generation Market, by End Use
      1. Introduction
      2. Industrial
        1. Market Estimates
        2. Market Estimates & Forecast, by Region, 2023-2032
      3. & Forecast, 2023-2032
      4. Commercial
        1. Market Estimates
        2. Market Estimates & Forecast, by Region, 2023-2032
      5. & Forecast, 2023-2032
      6. Residential
        1. Market Estimates
        2. Market Estimates & Forecast, by Region, 2023-2032
      7. & Forecast, 2023-2032
    20. Global Captive Power
    21. Generation Market, by Region
      1. Introduction
      2. North America
        1. Market Estimates & Forecast, by Technology, 2023-2032
        2. Market Estimates
        3. Market Estimates & Forecast, by Ownership, 2023-2032
        4. Market Estimates
        5. Market Estimates & Forecast, by End Use,
      3. & Forecast, by Fuel, 2023-2032
      4. & Forecast, by Connectivity, 2023-2032
      5. 11.2.6
    22. Market Estimates & Forecast, by Country, 2023-2032
      1. 11.2.7.2
    23. US
    24. Market Estimates & Forecast, by Technology,
    25. Market Estimates & Forecast, by Ownership, 2023-2032
      1. 11.2.7.4
    26. Market Estimates & Forecast, by Connectivity,
    27. Market Estimates & Forecast, by End Use, 2023-2032
      1. 11.2.8
      2. Canada
      3. 11.2.8.1
    28. Market Estimates & Forecast, by Fuel,
    29. Market Estimates & Forecast, by Technology, 2023-2032
      1. 11.2.8.3
    30. Market Estimates & Forecast, by Ownership,
    31. Market Estimates & Forecast, by Connectivity, 2023-2032
      1. Use, 2023-2032
      2. 11.2.8.5
    32. Market Estimates & Forecast, by End
    33. Market Estimates & Forecast, by Fuel, 2023-2032
      1. 11.2.9.2
    34. Mexico
    35. Market Estimates & Forecast, by Technology,
    36. Market Estimates & Forecast, by Ownership, 2023-2032
      1. 11.2.9.4
    37. Market Estimates & Forecast, by Connectivity,
    38. Market Estimates & Forecast, by End Use, 2023-2032
      1. 11.3
      2. Europe
      3. 11.3.1
    39. Market Estimates & Forecast, by Fuel,
    40. Market Estimates & Forecast, by Technology, 2023-2032
      1. 11.3.3
    41. Market Estimates & Forecast, by Fuel,
    42. Market Estimates & Forecast, by Ownership, 2023-2032
      1. 11.3.5
    43. Market Estimates & Forecast, by Connectivity,
    44. Market Estimates & Forecast, by End Use, 2023-2032
      1. 11.3.7
      2. Germany
      3. 11.3.7.1
    45. Market Estimates & Forecast, by Country,
    46. Market Estimates & Forecast, by Technology, 2023-2032
      1. 11.3.7.3
    47. Market Estimates & Forecast, by Ownership,
    48. Market Estimates & Forecast, by Connectivity, 2023-2032
      1. Use, 2023-2032
      2. 11.3.7.5
    49. Market Estimates & Forecast, by End
    50. Market Estimates & Forecast, by Fuel, 2023-2032
      1. 11.3.8.2
    51. Russia
    52. Market Estimates & Forecast, by Technology,
    53. Market Estimates & Forecast, by Ownership, 2023-2032
      1. 11.3.8.4
    54. Market Estimates & Forecast, by Connectivity,
    55. Market Estimates & Forecast, by End Use, 2023-2032
      1. 11.3.9
      2. UK
      3. 11.3.9.1
    56. Market Estimates & Forecast, by Fuel,
    57. Market Estimates & Forecast, by Technology, 2023-2032
      1. 11.3.9.3
    58. Market Estimates & Forecast, by Ownership,
    59. Market Estimates & Forecast, by Connectivity, 2023-2032
      1. Use, 2023-2032
      2. 11.3.9.5
    60. Market Estimates & Forecast, by End
    61. Market Estimates & Forecast, by Fuel, 2023-2032
      1. 11.3.10.2
    62. France
    63. Market Estimates & Forecast, by Technology,
    64. Market Estimates & Forecast, by Ownership, 2023-2032
      1. 11.3.10.4
    65. Market Estimates & Forecast, by Connectivity,
    66. Market Estimates & Forecast, by End Use, 2023-2032
      1. 11.3.11
      2. Rest of Europe
      3. 11.3.11.1
    67. Market Estimates & Forecast, by Fuel,
    68. Market Estimates & Forecast, by Technology, 2023-2032
      1. 11.3.11.3
    69. Market Estimates & Forecast, by Ownership,
    70. Market Estimates & Forecast, by Connectivity, 2023-2032
      1. Use, 2023-2032
      2. 11.3.11.5
    71. Market Estimates & Forecast, by End
    72. Market Estimates & Forecast, by Fuel, 2023-2032
      1. Asia-Pacific
        1. Market Estimates & Forecast, by Technology,
      2. 11.4.2
    73. Market Estimates & Forecast, by Fuel, 2023-2032
      1. 11.4.4
    74. Market Estimates & Forecast, by Ownership,
    75. Market Estimates & Forecast, by Connectivity, 2023-2032
      1. 11.4.6
    76. Market Estimates & Forecast, by End Use,
    77. Market Estimates & Forecast, by Country, 2023-2032
      1. 11.4.7.2
    78. China
    79. Market Estimates & Forecast, by Technology,
    80. Market Estimates & Forecast, by Ownership, 2023-2032
      1. 11.4.7.4
    81. Market Estimates & Forecast, by Connectivity,
    82. Market Estimates & Forecast, by End Use, 2023-2032
      1. 11.4.8
      2. India
      3. 11.4.8.1
    83. Market Estimates & Forecast, by Fuel,
    84. Market Estimates & Forecast, by Technology, 2023-2032
      1. 11.4.8.3
    85. Market Estimates & Forecast, by Ownership,
    86. Market Estimates & Forecast, by Connectivity, 2023-2032
      1. Use, 2023-2032
      2. 11.4.8.5
    87. Market Estimates & Forecast, by End
    88. Market Estimates & Forecast, by Fuel, 2023-2032
      1. 11.4.9.2
    89. Japan
    90. Market Estimates & Forecast, by Technology,
    91. Market Estimates & Forecast, by Ownership, 2023-2032
      1. 11.4.9.4
    92. Market Estimates & Forecast, by Connectivity,
    93. Market Estimates & Forecast, by End Use, 2023-2032
      1. 11.4.10
      2. Australia
      3. 11.4.10.1
    94. Market Estimates & Forecast, by Fuel,
    95. Market Estimates & Forecast, by Technology, 2023-2032
      1. 11.4.10.3
    96. Market Estimates & Forecast, by Ownership,
    97. Market Estimates & Forecast, by Connectivity, 2023-2032
      1. Use, 2023-2032
      2. 11.4.10.5
    98. Market Estimates & Forecast, by End
    99. Market Estimates & Forecast, by Fuel, 2023-2032
      1. 11.4.11.2
    100. Malaysia
    101. Market Estimates & Forecast, by Technology,
    102. Market Estimates & Forecast, by Ownership, 2023-2032
      1. 11.4.11.4
    103. Market Estimates & Forecast, by Connectivity,
    104. Market Estimates & Forecast, by End Use, 2023-2032
      1. 11.4.12
      2. Rest of Asia-Pacific
      3. 11.4.12.1
    105. Market Estimates & Forecast, by Fuel,
    106. Market Estimates & Forecast, by Technology, 2023-2032
      1. 11.4.12.3
    107. Market Estimates & Forecast, by Ownership,
    108. Market Estimates & Forecast, by Connectivity, 2023-2032
      1. Use, 2023-2032
      2. 11.4.12.5
    109. Market Estimates & Forecast, by End
    110. Market Estimates & Forecast, by Fuel, 2023-2032
      1. Middle East & Africa
        1. Market Estimates & Forecast, by Technology,
      2. 11.5.2
    111. Market Estimates & Forecast, by Fuel, 2023-2032
      1. 11.5.4
    112. Market Estimates & Forecast, by Ownership,
    113. Market Estimates & Forecast, by Connectivity, 2023-2032
      1. 11.5.6
    114. Market Estimates & Forecast, by End Use,
    115. Market Estimates & Forecast, by Country, 2023-2032
      1. 11.5.7.2
    116. Saudi Arabia
    117. Market Estimates & Forecast, by Technology,
    118. Market Estimates & Forecast, by Ownership, 2023-2032
      1. 11.5.7.4
    119. Market Estimates & Forecast, by Connectivity,
    120. Market Estimates & Forecast, by End Use, 2023-2032
      1. 11.5.8
      2. UAE
      3. 11.5.8.1
    121. Market Estimates & Forecast, by Fuel,
    122. Market Estimates & Forecast, by Technology, 2023-2032
      1. 11.5.8.3
    123. Market Estimates & Forecast, by Ownership,
    124. Market Estimates & Forecast, by Connectivity, 2023-2032
      1. Use, 2023-2032
      2. 11.5.8.5
    125. Market Estimates & Forecast, by End
    126. Market Estimates & Forecast, by Fuel, 2023-2032
      1. 11.5.9.2
    127. South Africa
    128. Market Estimates & Forecast, by Technology,
    129. Market Estimates & Forecast, by Ownership, 2023-2032
      1. 11.5.9.4
    130. Market Estimates & Forecast, by Connectivity,
    131. Market Estimates & Forecast, by End Use, 2023-2032
      1. 11.5.1
      2. Rest of Middle East & Africa
      3. & Forecast, by Ownership, 2023-2032
      4. 11.5.1.4
    132. Market Estimates & Forecast, by Fuel,
    133. Market Estimates & Forecast, by Technology, 2023-2032
    134. Market Estimates
    135. Market Estimates & Forecast, by Connectivity,
    136. Market Estimates & Forecast, by End Use, 2023-2032
      1. 11.6
      2. South America
      3. 11.6.1
    137. Market Estimates & Forecast, by Fuel,
    138. Market Estimates & Forecast, by Technology, 2023-2032
      1. 11.6.3
    139. Market Estimates & Forecast, by Fuel,
    140. Market Estimates & Forecast, by Ownership, 2023-2032
      1. 11.6.5
    141. Market Estimates & Forecast, by Connectivity,
    142. Market Estimates & Forecast, by End Use, 2023-2032
      1. 11.6.7
      2. Brazil
      3. 11.6.7.1
    143. Market Estimates & Forecast, by Country,
    144. Market Estimates & Forecast, by Technology, 2023-2032
      1. 11.6.7.3
    145. Market Estimates & Forecast, by Ownership,
    146. Market Estimates & Forecast, by Connectivity, 2023-2032
      1. Use, 2023-2032
      2. 11.6.7.5
    147. Market Estimates & Forecast, by End
    148. Market Estimates & Forecast, by Fuel, 2023-2032
      1. 11.6.8.2
    149. Argentina
    150. Market Estimates & Forecast, by Technology,
    151. Market Estimates & Forecast, by Ownership, 2023-2032
      1. 11.6.8.4
    152. Market Estimates & Forecast, by Connectivity,
    153. Market Estimates & Forecast, by End Use, 2023-2032
      1. 11.6.9
      2. Rest of South America
      3. 11.6.9.1
    154. Market Estimates & Forecast, by Fuel,
    155. Market Estimates & Forecast, by Technology, 2023-2032
      1. 11.6.9.3
    156. Market Estimates & Forecast, by Fuel,
    157. Market Estimates & Forecast, by Ownership, 2023-2032
      1. 11.6.9.5
    158. Market Estimates & Forecast, by Connectivity,
    159. Market Estimates & Forecast, by End Use, 2023-2032
    160. Competitive Landscape
      1. Competitive Benchmarking of the Global Captive
      2. Power Generation Market
      3. Market Share Analysis: Global Captive Power Generation Market
      4. New Product Developments
      5. in the Captive Power Generation Market
      6. Mergers & Acquisitions in the Captive Power Generation
      7. Market
      8. 12.5
      9. Partnership/Collaboration/Joint Ventures in the Captive Power Generation Market
      10. Contracts &
      11. Agreements in the Captive Power Generation Market
      12. Expansions & Investments in the Captive
      13. Power Generation Market
    161. Company Profile
      1. Clarke Energy, a Kohler Company
        1. Company Overview
        2. Products/Services Offered
        3. Financial Overview
        4. Key Developments
        5. Key Strategies
        6. SWOT Analysis
      2. Thermax Limited
        1. Company Overview
        2. Products/Services
        3. Financial Overview
        4. Key Developments
        5. Key Strategies
        6. SWOT Analysis
      3. Offered
      4. 13.2.3
      5. Financial Overview
      6. 13.2.4
      7. Key Developments
      8. 13.2.5
      9. Key Strategies
      10. 13.2.6
      11. SWOT Analysis
      12. 13.3
      13. NALCO India
      14. 13.3.1
      15. Company Overview
      16. 13.3.2
      17. Products/Services Offered
      18. Siemens
        1. Company Overview
        2. Products/Services Offered
        3. Financial Overview
        4. Key Developments
        5. Key Strategies
        6. SWOT Analysis
      19. Wartsila
        1. Company Overview
        2. Products/Services
        3. Financial Overview
        4. Key Developments
        5. Key Strategies
        6. SWOT Analysis
      20. Offered
      21. 13.5.3
      22. Financial Overview
      23. 13.5.4
      24. Key Developments
      25. 13.5.5
      26. Key Strategies
      27. 13.5.6
      28. SWOT Analysis
      29. 13.6
      30. LafargeHolcim
      31. 13.6.1
      32. Company Overview
      33. 13.6.2
      34. Products/Services Offered
      35. Doosan Corporation
        1. Company Overview
        2. Products/Services Offered
        3. Financial Overview
        4. Key Developments
        5. Key Strategies
        6. SWOT Analysis
      36. ArcelorMittal
        1. Company Overview
        2. Products/Services
        3. Financial Overview
        4. Key Developments
        5. Key Strategies
        6. SWOT Analysis
      37. Offered
      38. 13.8.3
      39. Financial Overview
      40. 13.8.4
      41. Key Developments
      42. 13.8.5
      43. Key Strategies
      44. 13.8.6
      45. SWOT Analysis
      46. 13.9
      47. Hindustan Zinc.
      48. 13.9.1
      49. Company Overview
      50. 13.9.2
      51. Products/Services Offered
      52. General Electric
        1. Company Overview
        2. Products/Services Offered
        3. Financial Overview
        4. Key Developments
        5. Key Strategies
        6. SWOT Analysis
      53. Reliance Industries
        1. Company Overview
        2. Products/Services
        3. Company Overview
        4. Products/Services Offered
        5. Financial Overview
        6. Key Developments
        7. Key Strategies
        8. SWOT Analysis
      54. Offered
      55. 13.11.3
      56. Financial Overview
      57. 13.11.4
      58. Key Developments
      59. 13.11.5
      60. Key Strategies
      61. 13.11.6
      62. SWOT Analysis
      63. 13.12
      64. Jindal Steel & Power
      65. Hindalco Industries
        1. Company Overview
        2. Products/Services Offered
        3. Financial Overview
        4. Key Developments
        5. Key Strategies
        6. SWOT Analysis
      66. Essar Steel
        1. Company Overview
        2. Products/Services
        3. Company Overview
        4. Products/Services Offered
        5. Financial Overview
        6. Key Developments
        7. Key Strategies
        8. SWOT Analysis
      67. Offered
      68. 13.14.3
      69. Financial Overview
      70. 13.14.4
      71. Key Developments
      72. 13.14.5
      73. Key Strategies
      74. 13.14.6
      75. SWOT Analysis
      76. 13.15
      77. Bharat Heavy Electricals
      78. List of Tables
    162. Global Captive Power Generation Market, by
      1. Region, 2023-2032 (USD Million)
    163. North America Captive Power Generation Market, by Country,
      1. Table
    164. Europe Captive Power Generation Market, by Country, 2023-2032 (USD Million)
    165. Asia-Pacific
    166. Captive Power Generation Market, by Country, 2023-2032 (USD Million)
    167. Middle East & Africa
    168. Captive Power Generation Market, by Country, 2023-2032
    169. South America Captive Power Generation Market,
      1. by Country, 2023-2032 (USD Million)
    170. Global Captive Power Generation Market, by Technology,
    171. North America Captive Power Generation Market, by Technology,
      1. Table
    172. Europe Captive Power Generation Market, by Technology, 2023-2032 (USD Million)
    173. Asia-Pacific
    174. Captive Power Generation Market, by Technology, 2023-2032
    175. Middle East & Africa Captive Power Generation
    176. Market, by Technology,
      1. Table
    177. South America Captive Power Generation Market, by Technology, 2023-2032
    178. Asia-Pacific
    179. Captive Power Generation Market, by Fuel, 2023-2032
    180. Middle East & Africa Captive Power Generation
    181. Market, by Fuel,
      1. Table
    182. South America Captive Power Generation Market, by Fuel, 2023-2032
    183. Asia-Pacific Captive
    184. Power Generation Market, by Ownership, 2023-2032
    185. Middle East & Africa Captive Power Generation
    186. Market, by Ownership,
      1. Table
    187. South America Captive Power Generation Market, by Ownership, 2023-2032
    188. Asia-Pacific
    189. Captive Power Generation Market, by Connectivity, 2023-2032
    190. Middle East & Africa Captive Power Generation
    191. Market, by Connectivity,
    192. South America Captive Power Generation Market, by Connectivity,
      1. Table
    193. Asia-Pacific Captive Power Generation Market, by End Use, 2023-2032
    194. Middle East
    195. & Africa Captive Power Generation Market, by End Use,
    196. South America Captive Power Generation Market,
      1. by End Use, 2023-2032
      2. Table
    197. Global Captive Power Generation Market: by Region, 2023-2032 (USD Million)
    198. North America
    199. Captive Power Generation Market, by Country, 2023-2032
    200. North America Captive Power Generation Market,
      1. by Technology, 2023-2032
    201. North America Captive Power Generation Market, by Fuel, 2023-2032
    202. North America
    203. Captive Power Generation Market, by Ownership, 2023-2032
    204. North America Captive Power Generation Market,
      1. by Connectivity, 2023-2032
    205. North America Captive Power Generation Market, by End Use,
      1. Table
    206. US Captive Power Generation Market, by Technology, 2023-2032 (USD Million)
    207. US Captive Power
    208. Generation Market, by Fuel, 2023-2032 (USD Million)
    209. US Captive Power Generation Market, by Ownership,
      1. Table
    210. US Captive Power Generation Market, by Connectivity, 2023-2032
    211. US Captive Power Generation
    212. Market, by End Use, 2023-2032
    213. Canada Captive Power Generation Market, by Technology, 2023-2032
      1. (USD Million)
      2. Table
    214. Canada Captive Power Generation Market, by Fuel, 2023-2032 (USD Million)
    215. Canada Captive
    216. Power Generation Market, by Ownership, 2023-2032
    217. Canada Captive Power Generation Market,
      1. by Connectivity, 2023-2032
    218. Canada Captive Power Generation Market, by End Use, 2023-2032
    219. Mexico Captive
    220. Power Generation Market, by Technology, 2023-2032 (USD Million)
    221. Mexico Captive Power
    222. Generation Market, by Fuel, 2023-2032 (USD Million)
    223. Mexico Captive Power Generation Market,
      1. by Ownership, 2023-2032
    224. Mexico Captive Power Generation Market, by Connectivity, 2023-2032
    225. Mexico Captive
    226. Power Generation Market, by End Use, 2023-2032
    227. Europe Captive Power Generation Market,
      1. by Country, 2023-2032 (USD Million)
    228. Europe Captive Power Generation Market, by Technology,
    229. Europe Captive Power Generation Market, by Fuel, 2023-2032
      1. (USD Million)
      2. Table
    230. Europe Captive Power Generation Market, by Ownership, 2023-2032
    231. Europe Captive Power
    232. Generation Market, by Connectivity, 2023-2032
    233. Europe Captive Power Generation Market,
      1. by End Use, 2023-2032
      2. Table
    234. UK Captive Power Generation Market, by Technology, 2023-2032 (USD Million)
    235. UK Captive Power
    236. Generation Market, by Fuel, 2023-2032 (USD Million)
    237. UK Captive Power Generation Market, by Ownership,
      1. Table
    238. UK Captive Power Generation Market, by Connectivity, 2023-2032
    239. UK Captive Power Generation
    240. Market, by End Use, 2023-2032
    241. France Captive Power Generation Market, by Technology, 2023-2032
      1. (USD Million)
      2. Table
    242. France Captive Power Generation Market, by Fuel, 2023-2032 (USD Million)
    243. France Captive
    244. Power Generation Market, by Ownership, 2023-2032
    245. France Captive Power Generation Market,
      1. by Connectivity, 2023-2032
    246. France Captive Power Generation Market, by End Use, 2023-2032
    247. Germany Captive
    248. Power Generation Market, by Technology, 2023-2032 (USD Million)
    249. Germany Captive Power
    250. Generation Market, by Fuel, 2023-2032 (USD Million)
    251. Germany Captive Power Generation Market,
      1. by Ownership, 2023-2032
    252. Germany Captive Power Generation Market, by Connectivity,
      1. Table
    253. Germany Captive Power Generation Market, by End Use, 2023-2032
    254. Russia Captive Power
    255. Generation Market, by Technology, 2023-2032 (USD Million)
    256. Russia Captive Power Generation Market,
      1. by Fuel, 2023-2032 (USD Million)
    257. Russia Captive Power Generation Market, by Ownership, 2023-2032
    258. Russia Captive
    259. Power Generation Market, by Connectivity, 2023-2032
    260. Russia Captive Power Generation Market,
      1. by End Use, 2023-2032
      2. Table
    261. Rest of Europe Captive Power Generation Market, by Technology, 2023-2032
    262. Rest of Europe
    263. Captive Power Generation Market, by Fuel, 2023-2032
    264. Rest of Europe Captive Power Generation
    265. Market, by Ownership, 2023-2032
    266. Rest of Europe Captive Power Generation Market, by Connectivity,
      1. Table
    267. Rest of Europe Captive Power Generation Market, by End Use, 2023-2032
    268. Asia-Pacific
    269. Captive Power Generation Market, by Country, 2023-2032
    270. Asia-Pacific Captive Power Generation Market,
      1. by Technology, 2023-2032 (USD Million)
    271. Asia-Pacific Captive Power Generation Market, by
      1. Fuel, 2023-2032
      2. Table
    272. Asia-Pacific Captive Power Generation Market, by Ownership, 2023-2032
    273. Asia-Pacific
    274. Captive Power Generation Market, by Connectivity, 2023-2032
    275. Asia-Pacific Captive Power Generation Market,
      1. by End Use, 2023-2032
      2. Table
    276. China Captive Power Generation Market, by Technology, 2023-2032 (USD Million)
    277. China Captive
    278. Power Generation Market, by Fuel, 2023-2032 (USD Million)
    279. China Captive Power Generation Market, by
      1. Ownership, 2023-2032
      2. Table
    280. China Captive Power Generation Market, by Connectivity, 2023-2032
    281. China Captive Power
    282. Generation Market, by End Use, 2023-2032
    283. India Captive Power Generation Market, by Technology,
    284. India Captive Power Generation Market, by Fuel, 2023-2032
      1. (USD Million)
      2. Table
    285. India Captive Power Generation Market, by Ownership, 2023-2032
    286. India Captive Power
    287. Generation Market, by Connectivity, 2023-2032
    288. India Captive Power Generation Market, by
      1. End Use, 2023-2032
      2. Table
    289. Japan Captive Power Generation Market, by Technology, 2023-2032 (USD Million)
    290. Japan Captive
    291. Power Generation Market, by Fuel, 2023-2032 (USD Million)
    292. Japan Captive Power Generation Market, by
      1. Ownership, 2023-2032
      2. Table
    293. Japan Captive Power Generation Market, by Connectivity, 2023-2032
    294. Japan Captive Power
    295. Generation Market, by End Use, 2023-2032
    296. Australia Captive Power Generation Market, by Technology,
    297. Australia Captive Power Generation Market, by Fuel, 2023-2032
      1. (USD Million)
      2. Table
    298. Australia Captive Power Generation Market, by Ownership, 2023-2032
    299. Australia Captive
    300. Power Generation Market, by Connectivity, 2023-2032
    301. Australia Captive Power Generation Market,
      1. by End Use, 2023-2032
      2. Table
    302. Malaysia Captive Power Generation Market, by Technology, 2023-2032 (USD Million)
    303. Malaysia Captive
    304. Power Generation Market, by Fuel, 2023-2032 (USD Million)
    305. Malaysia Captive Power Generation Market,
      1. by Ownership, 2023-2032
    306. Malaysia Captive Power Generation Market, by Connectivity,
      1. Table
    307. Malaysia Captive Power Generation Market, by End Use, 2023-2032
    308. Rest of Asia-Pacific
    309. Captive Power Generation Market, by Technology, 2023-2032
    310. Rest of Asia-Pacific Captive Power Generation
    311. Market, by Fuel, 2023-2032
    312. Rest of Asia-Pacific Captive Power Generation Market, by
      1. Ownership, 2023-2032
      2. Table
    313. Rest of Asia-Pacific Captive Power Generation Market, by Connectivity, 2023-2032
    314. Rest of Asia-Pacific
    315. Captive Power Generation Market, by End Use, 2023-2032
    316. Middle East & Africa Captive Power
    317. Generation Market, by Technology, 2023-2032
    318. Middle East & Africa Captive Power
    319. Generation Market, by Fuel, 2023-2032
    320. Middle East & Africa Captive Power Generation
    321. Market, by Ownership, 2023-2032
    322. Middle East & Africa Captive Power Generation Market,
      1. by Connectivity, 2023-2032
    323. Middle East & Africa Captive Power Generation Market,
      1. by End Use, 2023-2032
      2. Table
    324. Middle East & Africa Captive Power Generation Market, by Region, 2023-2032
    325. Saudi Arabia
    326. Captive Power Generation Market, by Technology, 2023-2032 (USD Million)
    327. Saudi Arabia
    328. Captive Power Generation Market, by Fuel, 2023-2032
    329. Saudi Arabia Captive Power Generation Market,
      1. by Ownership, 2023-2032
    330. Saudi Arabia Captive Power Generation Market, by Connectivity,
      1. Table
    331. Saudi Arabia Captive Power Generation Market, by End Use, 2023-2032
    332. UAE Captive
    333. Power Generation Market, by Technology, 2023-2032 (USD Million)
    334. UAE Captive Power Generation
    335. Market, by Fuel, 2023-2032 (USD Million)
    336. UAE Captive Power Generation Market, by Ownership,
      1. Table
    337. UAE Captive Power Generation Market, by Connectivity, 2023-2032
    338. UAE Captive Power Generation
    339. Market, by End Use, 2023-2032
    340. South Africa Captive Power Generation Market, by Technology,
    341. South Africa Captive Power Generation Market, by Fuel, 2023-2032
    342. South Africa
    343. Captive Power Generation Market, by Ownership, 2023-2032
    344. South Africa Captive Power Generation Market,
      1. by Connectivity, 2023-2032
    345. South Africa Captive Power Generation Market, by End Use,
      1. Table
    346. Rest of Middle East & Africa Captive Power Generation Market, by Technology,
    347. Rest of Middle
    348. East & Africa Captive Power Generation Market, by Fuel,
    349. Rest of Middle East & Africa Captive
    350. Power Generation Market, by Ownership, 2023-2032
    351. Rest of Middle East & Africa Captive
    352. Power Generation Market, by Connectivity, 2023-2032
    353. Rest of Middle East & Africa Captive
    354. Power Generation Market, by End Use, 2023-2032
    355. South America Captive Power Generation
    356. Market, by Technology, 2023-2032
    357. South America Captive Power Generation Market, by Fuel, 2023-2032
    358. South America
    359. Captive Power Generation Market, by Ownership, 2023-2032
    360. South America Captive Power Generation
    361. Market, by Connectivity, 2023-2032
    362. South America Captive Power Generation Market,
      1. by End Use, 2023-2032
      2. Table
    363. South America Captive Power Generation Market, by Country, 2023-2032
    364. Brazil Captive
    365. Power Generation Market, by Technology, 2023-2032 (USD Million)
    366. Brazil Captive Power
    367. Generation Market, by Fuel, 2023-2032 (USD Million)
    368. Brazil Captive Power Generation Market,
      1. by Ownership, 2023-2032
    369. Brazil Captive Power Generation Market, by Connectivity,
      1. Table
    370. Brazil Captive Power Generation Market, by End Use, 2023-2032
    371. Argentina Captive Power
    372. Generation Market, by Technology, 2023-2032 (USD Million)
    373. Argentina Captive Power Generation Market,
      1. by Fuel, 2023-2032 (USD Million)
    374. Argentina Captive Power Generation Market, by Ownership,
      1. Table
    375. Argentina Captive Power Generation Market, by Connectivity, 2023-2032
    376. Argentina Captive
    377. Power Generation Market, by End Use, 2023-2032
    378. Rest of South America Captive Power Generation
    379. Market, by Technology, 2023-2032
    380. Rest of South America Captive Power Generation Market, by
      1. Fuel, 2023-2032
      2. Table
    381. Rest of South America Captive Power Generation Market, by Ownership, 2023-2032
    382. Rest of South
    383. America Captive Power Generation Market, by Connectivity, 2023-2032
    384. Rest of South America
    385. Captive Power Generation Market, by End Use, 2023-2032
      1. List of Figures
    386. Research Process of MRFR
    387. Top-Down and Bottom-Up
      1. Approach
      2. Figure
    388. Market Dynamics
      1. Figure
    389. Impact Analysis: Market Drivers
    390. Impact Analysis: Market Restraints
    391. Porter’s Five Forces Analysis
    392. Value Chain
      1. Analysis
      2. Figure
    393. Global Captive Power Generation Market Share, by Technology, 2023 (%)
    394. Global Captive
    395. Power Generation Market, by Technology, 2023-2032 (USD Million)
    396. Global Captive Power
    397. Generation Market Share, by Fuel, 2023 (%)
    398. Global Captive Power Generation Market,
      1. by Fuel, 2023-2032 (USD Million)
    399. Global Captive Power Generation Market Share, by Ownership,
      1. Figure
    400. Global Captive Power Generation Market, by Ownership, 2023-2032 (USD Million)
    401. Global Captive
    402. Power Generation Market Share, by Connectivity, 2023 (%)
    403. Global Captive Power Generation Market,
      1. by Connectivity, 2023-2032 (USD Million)
    404. Global Captive Power Generation Market Share,
      1. by End Use, 2023 (%)
      2. Figure
    405. Global Captive Power Generation Market, by End Use, 2023-2032 (USD Million)
    406. Global Captive
    407. Power Generation Market Share (%), by Region, 2023
    408. Global Captive Power Generation Market,
      1. by Region, 2023-2032 (USD Million)
    409. North America Captive Power Generation Market
      1. Share (%), 2023
      2. Figure
    410. North America Captive Power Generation Market, by Country, 2023-2032 (USD Million)
    411. Europe Captive
      1. Power Generation Market Share (%), 2023
    412. Europe Captive Power Generation Market, by Country,
    413. Asia-Pacific Captive Power Generation Market Share (%), 2023
    414. Asia-Pacific
    415. Captive Power Generation Market, by Country, 2023-2032 (USD Million)
    416. Middle East & Africa
      1. Captive Power Generation Market Share (%), 2023
    417. Middle East & Africa Captive Power
    418. Generation Market, by Region, 2023-2032 (USD Million)
    419. South America Captive Power Generation
      1. Market Share (%), 2023
      2. Figure
    420. South America Captive Power Generation Market, by Region, 2023-2032 (USD Million)

    Captive Power Generation Market Segmentation

    Captive Power Generation Market Technology Outlook (USD Billion, 2018-2032)

    • Heat Exchangers
    • Turbines
    • Gas Engines
    • Transformers
    • Others

    Captive Power Generation Market Fuel Outlook (USD Billion, 2018-2032)

    • Diesel
    • Gas
    • Coal
    • Others

    Captive Power Generation Market Ownership Outlook (USD Billion, 2018-2032)

    • Single Ownership
    • Multiple Ownership

    Captive Power Generation Market Connectivity Outlook (USD Billion, 2018-2032)

    • OffGrid
    • On-Grid

    Captive Power Generation Market End Use Outlook (USD Billion, 2018-2032)

    • Industrial
    • Commercial
    • Residential

    Captive Power Generation Market Regional Outlook (USD Billion, 2018-2032)

    • North America Outlook (USD Billion, 2018-2032)

      • Captive Power Generation Market by Technology
        • Heat Exchangers
        • Turbines
        • Gas Engines
        • Transformers
        • Others
      • Captive Power Generation Market by Fuel
        • Diesel
        • Gas
        • Coal
        • Others
      • Captive Power Generation Market by Ownership
        • Single Ownership
        • Multiple Ownership
      • Captive Power Generation Market by Connectivity
        • OffGrid
        • On-Grid
      • Captive Power Generation Market by End Use
        • Industrial
        • Commercial
        • Residential
      • US Outlook (USD Billion, 2018-2032)

      • Captive Power Generation Market by Technology
        • Heat Exchangers
        • Turbines
        • Gas Engines
        • Transformers
        • Others
      • Captive Power Generation Market by Fuel
        • Diesel
        • Gas
        • Coal
        • Others
      • Captive Power Generation Market by Ownership
        • Single Ownership
        • Multiple Ownership
      • Captive Power Generation Market by Connectivity
        • OffGrid
        • On-Grid
      • Captive Power Generation Market by End Use
        • Industrial
        • Commercial
        • Residential
      • Canada Outlook (USD Billion, 2018-2032)

      • Captive Power Generation Market by Technology
        • Heat Exchangers
        • Turbines
        • Gas Engines
        • Transformers
        • Others
      • Captive Power Generation Market by Fuel
        • Diesel
        • Gas
        • Coal
        • Others
      • Captive Power Generation Market by Ownership
        • Single Ownership
        • Multiple Ownership
      • Captive Power Generation Market by Connectivity
        • OffGrid
        • On-Grid
      • Captive Power Generation Market by End Use
        • Industrial
        • Commercial
        • Residential
    • Europe Outlook (USD Billion, 2018-2032)

      • Captive Power Generation Market by Technology
        • Heat Exchangers
        • Turbines
        • Gas Engines
        • Transformers
        • Others
      • Captive Power Generation Market by Fuel
        • Diesel
        • Gas
        • Coal
        • Others
      • Captive Power Generation Market by Ownership
        • Single Ownership
        • Multiple Ownership
      • Captive Power Generation Market by Connectivity
        • OffGrid
        • On-Grid
      • Captive Power Generation Market by End Use
        • Industrial
        • Commercial
        • Residential
      • Germany Outlook (USD Billion, 2018-2032)

      • Captive Power Generation Market by Technology
        • Heat Exchangers
        • Turbines
        • Gas Engines
        • Transformers
        • Others
      • Captive Power Generation Market by Fuel
        • Diesel
        • Gas
        • Coal
        • Others
      • Captive Power Generation Market by Ownership
        • Single Ownership
        • Multiple Ownership
      • Captive Power Generation Market by Connectivity
        • OffGrid
        • On-Grid
      • Captive Power Generation Market by End Use
        • Industrial
        • Commercial
        • Residential
      • France Outlook (USD Billion, 2018-2032)

      • Captive Power Generation Market by Technology
        • Heat Exchangers
        • Turbines
        • Gas Engines
        • Transformers
        • Others
      • Captive Power Generation Market by Fuel
        • Diesel
        • Gas
        • Coal
        • Others
      • Captive Power Generation Market by Ownership
        • Single Ownership
        • Multiple Ownership
      • Captive Power Generation Market by Connectivity
        • OffGrid
        • On-Grid
      • Captive Power Generation Market by End Use
        • Industrial
        • Commercial
        • Residential
      • UK Outlook (USD Billion, 2018-2032)

      • Captive Power Generation Market by Technology
        • Heat Exchangers
        • Turbines
        • Gas Engines
        • Transformers
        • Others
      • Captive Power Generation Market by Fuel
        • Diesel
        • Gas
        • Coal
        • Others
      • Captive Power Generation Market by Ownership
        • Single Ownership
        • Multiple Ownership
      • Captive Power Generation Market by Connectivity
        • OffGrid
        • On-Grid
      • Captive Power Generation Market by End Use
        • Industrial
        • Commercial
        • Residential
      • Italy Outlook (USD Billion, 2018-2032)

      • Captive Power Generation Market by Technology
        • Heat Exchangers
        • Turbines
        • Gas Engines
        • Transformers
        • Others
      • Captive Power Generation Market by Fuel
        • Diesel
        • Gas
        • Coal
        • Others
      • Captive Power Generation Market by Ownership
        • Single Ownership
        • Multiple Ownership
      • Captive Power Generation Market by Connectivity
        • OffGrid
        • On-Grid
      • Captive Power Generation Market by End Use
        • Industrial
        • Commercial
        • Residential
      • Spain Outlook (USD Billion, 2018-2032)

      • Captive Power Generation Market by Technology
        • Heat Exchangers
        • Turbines
        • Gas Engines
        • Transformers
        • Others
      • Captive Power Generation Market by Fuel
        • Diesel
        • Gas
        • Coal
        • Others
      • Captive Power Generation Market by Ownership
        • Single Ownership
        • Multiple Ownership
      • Captive Power Generation Market by Connectivity
        • OffGrid
        • On-Grid
      • Captive Power Generation Market by End Use
        • Industrial
        • Commercial
        • Residential
      • Rest Of Europe Outlook (USD Billion, 2018-2032)

      • Captive Power Generation Market by Technology
        • Heat Exchangers
        • Turbines
        • Gas Engines
        • Transformers
        • Others
      • Captive Power Generation Market by Fuel
        • Diesel
        • Gas
        • Coal
        • Others
      • Captive Power Generation Market by Ownership
        • Single Ownership
        • Multiple Ownership
      • Captive Power Generation Market by Connectivity
        • OffGrid
        • On-Grid
      • Captive Power Generation Market by End Use
        • Industrial
        • Commercial
        • Residential
    • Asia-Pacific Outlook (USD Billion, 2018-2032)

      • Captive Power Generation Market by Technology
        • Heat Exchangers
        • Turbines
        • Gas Engines
        • Transformers
        • Others
      • Captive Power Generation Market by Fuel
        • Diesel
        • Gas
        • Coal
        • Others
      • Captive Power Generation Market by Ownership
        • Single Ownership
        • Multiple Ownership
      • Captive Power Generation Market by Connectivity
        • OffGrid
        • On-Grid
      • Captive Power Generation Market by End Use
        • Industrial
        • Commercial
        • Residential
      • China Outlook (USD Billion, 2018-2032)

      • Captive Power Generation Market by Technology
        • Heat Exchangers
        • Turbines
        • Gas Engines
        • Transformers
        • Others
      • Captive Power Generation Market by Fuel
        • Diesel
        • Gas
        • Coal
        • Others
      • Captive Power Generation Market by Ownership
        • Single Ownership
        • Multiple Ownership
      • Captive Power Generation Market by Connectivity
        • OffGrid
        • On-Grid
      • Captive Power Generation Market by End Use
        • Industrial
        • Commercial
        • Residential
      • Japan Outlook (USD Billion, 2018-2032)

      • Captive Power Generation Market by Technology
        • Heat Exchangers
        • Turbines
        • Gas Engines
        • Transformers
        • Others
      • Captive Power Generation Market by Fuel
        • Diesel
        • Gas
        • Coal
        • Others
      • Captive Power Generation Market by Ownership
        • Single Ownership
        • Multiple Ownership
      • Captive Power Generation Market by Connectivity
        • OffGrid
        • On-Grid
      • Captive Power Generation Market by End Use
        • Industrial
        • Commercial
        • Residential
      • India Outlook (USD Billion, 2018-2032)

      • Captive Power Generation Market by Technology
        • Heat Exchangers
        • Turbines
        • Gas Engines
        • Transformers
        • Others
      • Captive Power Generation Market by Fuel
        • Diesel
        • Gas
        • Coal
        • Others
      • Captive Power Generation Market by Ownership
        • Single Ownership
        • Multiple Ownership
      • Captive Power Generation Market by Connectivity
        • OffGrid
        • On-Grid
      • Captive Power Generation Market by End Use
        • Industrial
        • Commercial
        • Residential
      • Australia Outlook (USD Billion, 2018-2032)

      • Captive Power Generation Market by Technology
        • Heat Exchangers
        • Turbines
        • Gas Engines
        • Transformers
        • Others
      • Captive Power Generation Market by Fuel
        • Diesel
        • Gas
        • Coal
        • Others
      • Captive Power Generation Market by Ownership
        • Single Ownership
        • Multiple Ownership
      • Captive Power Generation Market by Connectivity
        • OffGrid
        • On-Grid
      • Captive Power Generation Market by End Use
        • Industrial
        • Commercial
        • Residential
      • Rest of Asia-Pacific Outlook (USD Billion, 2018-2032)

      • Captive Power Generation Market by Technology
        • Heat Exchangers
        • Turbines
        • Gas Engines
        • Transformers
        • Others
      • Captive Power Generation Market by Fuel
        • Diesel
        • Gas
        • Coal
        • Others
      • Captive Power Generation Market by Ownership
        • Single Ownership
        • Multiple Ownership
      • Captive Power Generation Market by Connectivity
        • OffGrid
        • On-Grid
      • Captive Power Generation Market by End Use
        • Industrial
        • Commercial
        • Residential
    • Rest of the World Outlook (USD Billion, 2018-2032)

      • Captive Power Generation Market by Technology
        • Heat Exchangers
        • Turbines
        • Gas Engines
        • Transformers
        • Others
      • Captive Power Generation Market by Fuel
        • Diesel
        • Gas
        • Coal
        • Others
      • Captive Power Generation Market by Ownership
        • Single Ownership
        • Multiple Ownership
      • Captive Power Generation Market by Connectivity
        • OffGrid
        • On-Grid
      • Captive Power Generation Market by End Use
        • Industrial
        • Commercial
        • Residential
      • Middle East Outlook (USD Billion, 2018-2032)

      • Captive Power Generation Market by Technology
        • Heat Exchangers
        • Turbines
        • Gas Engines
        • Transformers
        • Others
      • Captive Power Generation Market by Fuel
        • Diesel
        • Gas
        • Coal
        • Others
      • Captive Power Generation Market by Ownership
        • Single Ownership
        • Multiple Ownership
      • Captive Power Generation Market by Connectivity
        • OffGrid
        • On-Grid
      • Captive Power Generation Market by End Use
        • Industrial
        • Commercial
        • Residential
      • Africa Outlook (USD Billion, 2018-2032)

      • Captive Power Generation Market by Technology
        • Heat Exchangers
        • Turbines
        • Gas Engines
        • Transformers
        • Others
      • Captive Power Generation Market by Fuel
        • Diesel
        • Gas
        • Coal
        • Others
      • Captive Power Generation Market by Ownership
        • Single Ownership
        • Multiple Ownership
      • Captive Power Generation Market by Connectivity
        • OffGrid
        • On-Grid
      • Captive Power Generation Market by End Use
        • Industrial
        • Commercial
        • Residential
      • Latin America Outlook (USD Billion, 2018-2032)

      • Captive Power Generation Market by Technology
        • Heat Exchangers
        • Turbines
        • Gas Engines
        • Transformers
        • Others
      • Captive Power Generation Market by Fuel
        • Diesel
        • Gas
        • Coal
        • Others
      • Captive Power Generation Market by Ownership
        • Single Ownership
        • Multiple Ownership
      • Captive Power Generation Market by Connectivity
        • OffGrid
        • On-Grid
      • Captive Power Generation Market by End Use
        • Industrial
        • Commercial
        • Residential
    Infographic

    Free Sample Request

    Kindly complete the form below to receive a free sample of this Report

    Get Free Sample

    Customer Strories

    “I am very pleased with how market segments have been defined in a relevant way for my purposes (such as "Portable Freezers & refrigerators" and "last-mile"). In general the report is well structured. Thanks very much for your efforts.”

    Victoria Milne

    Founder
    Case Study
    Chemicals and Materials