×
  • Cat-intel
  • MedIntelliX
  • Resources
  • About Us
  • Hero Background
    English
    Chinese
    French
    Japanese
    Korean
    German
    Spanish

    Captive Power Generation Market Share

    ID: MRFR/EnP/8966-HCR
    111 Pages
    Anshula Mandaokar
    October 2025

    Captive Power Generation Market Research Report By Technology (Heat Exchangers, Turbines, Gas Engines, Transformers, Others), Fuel (Diesel, Gas, Coal, Others), Ownership (Single Ownership and Multiple Ownership), Connectivity (OffGrid and On-Grid), End Use (Industrial, Commercial, Residential) and By Region (North America, Europe, Asia-Pacific, and Rest of the World) –Market Forecast Till 2035

    Share:
    Download PDF ×

    We do not share your information with anyone. However, we may send you emails based on your report interest from time to time. You may contact us at any time to opt-out.

    Captive Power Generation Market Infographic
    Purchase Options

    Market Share

    Captive Power Generation Market Share Analysis

    "The Captive Power Generation market is undergoing notable trends influenced by the changing dynamics of the energy sector and evolving industrial requirements. One notable trend is that more industries are adopting captive power generation to ensure they have secure sources of electricity other than depending entirely on the national grids. As businesses demand uninterrupted operation of their activities when electricity is not available from utilities; investments in captive plants like diesel generators, gas turbines or cogeneration units become strategic decisions. This shift reflects increased awareness among industries about grid disturbances with regards to ensuring continued uninterrupted power supply for critical processes. Another significant development in captive power generation market is incorporation of renewable sources within it. To achieve green objectives and lower carbon footprints, several firms have started incorporating solar, wind or biomass based plants into their own independent facilities. This supports wider industry trend toward greener alternatives in energy supplies. Hybrid captive systems combining conventional with non-conventional sources are becoming popular due to desire by firms minimize their environmental impacts while optimizing energy costs.

    Moreover technological advancements dictate where it can be heading next., Technological advances influence how markets change in response to new products being introduced into them.Capabilities such as AI software systems create efficiency when used together with digital surveillance programs which assist device control operators; this not only improves data management but also allows for improved decision making thereby reducing equipment downtime. Thus, the use of these tools clearly reflects an ongoing digitalization shift in the energy sector that is driven by the necessity for exploiting technology to improve operations.

    Energy efficiency and cost optimization are market trends that dominate the captive power generation industry. Industries have increasingly taken up combined heat and power (CHP) or cogeneration systems that use waste heat from electricity generation for industrial processes or heating. These systems enhance overall energy performance, reduce fuel consumption and save money. This wave resonates with twin objectives of economic viability improvement and environmental impact minimisation.

    Author
    Anshula Mandaokar
    Team Lead - Research

    Anshula Mandaokar holds an academic degree in Chemical Engineering and has been contributing to the field for more than 5 years. She has expertise in Market Research and Business Consulting and serves as a Team Lead for a reputed Market Research firm under the Chemicals and Materials domain spectrum. She has worked on multiple projects, generating explicit results in a quick turnaround time. Her understanding of data interpretation justifies her role as a leader.

    Leave a Comment

    FAQs

    What is the projected market valuation for the Captive Power Generation Market in 2035?

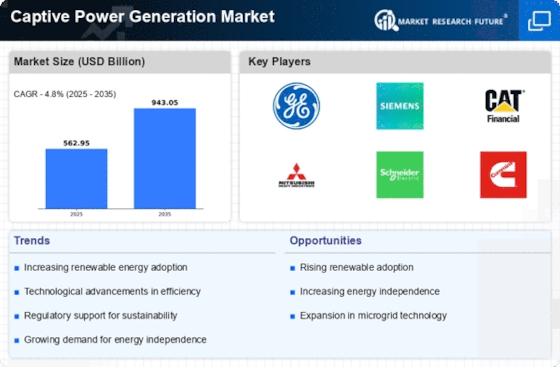
    The Captive Power Generation Market is projected to reach a valuation of 943.05 USD Billion by 2035.

    What was the market valuation for the Captive Power Generation Market in 2024?

    In 2024, the overall market valuation for the Captive Power Generation Market was 562.95 USD Billion.

    What is the expected CAGR for the Captive Power Generation Market from 2025 to 2035?

    The expected CAGR for the Captive Power Generation Market during the forecast period 2025 - 2035 is 4.8%.

    Which companies are considered key players in the Captive Power Generation Market?

    Key players in the Captive Power Generation Market include General Electric, Siemens, Caterpillar, Mitsubishi Heavy Industries, Schneider Electric, Cummins, Wärtsilä, ABB, and MAN Energy Solutions.

    What are the projected values for the Gas segment in the Captive Power Generation Market?

    The Gas segment is projected to grow from 200.0 USD Billion to 320.0 USD Billion during the forecast period.

    How does the On-Grid connectivity segment perform in terms of market valuation?

    The On-Grid connectivity segment is expected to increase from 450.36 USD Billion to 758.05 USD Billion by 2035.

    Market Summary

    As per MRFR analysis, the Captive Power Generation Market Size was estimated at 562.95 USD Billion in 2024. The Captive Power Generation industry is projected to grow from 589.98 USD Billion in 2025 to 943.05 USD Billion by 2035, exhibiting a compound annual growth rate (CAGR) of 4.8 during the forecast period 2025 - 2035.

    Key Market Trends & Highlights

    The Captive Power Generation Market is experiencing a transformative shift towards renewable energy and technological advancements.

    • The integration of renewable energy sources is increasingly shaping the Captive Power Generation Market, particularly in North America.
    • Technological advancements in energy management systems are enhancing operational efficiency across various segments.
    • Regulatory support for self-generation is fostering growth, especially in the Asia-Pacific region, which is currently the fastest-growing market.
    • The rising energy demand and cost efficiency are driving the adoption of gas engines, while innovations in turbines are gaining traction.

    Market Size & Forecast

    2024 Market Size 562.95 (USD Billion)
    2035 Market Size 943.05 (USD Billion)
    CAGR (2025 - 2035) 4.8%
    Largest Regional Market Share in 2024 Asia Pacific

    Major Players

    <p>General Electric (US), Siemens (DE), Caterpillar (US), Mitsubishi Heavy Industries (JP), Schneider Electric (FR), Cummins (US), Wärtsilä (FI), ABB (CH), MAN Energy Solutions (DE)</p>

    Market Trends

    The Captive Power Generation Market is currently experiencing a notable transformation, driven by various factors including the increasing demand for reliable energy sources and the growing emphasis on sustainability. Industries are increasingly recognizing the advantages of generating their own power, which not only enhances energy security but also reduces dependence on grid electricity. This shift is particularly evident in sectors such as manufacturing, mining, and commercial enterprises, where operational continuity is paramount. Furthermore, advancements in technology are facilitating the integration of renewable energy sources, thereby aligning with global efforts to mitigate climate change. In addition to technological advancements, regulatory frameworks are evolving to support the growth of the Captive Power Generation Market. Governments are implementing policies that encourage self-generation and the use of clean energy, which may further stimulate investment in this sector. As organizations seek to optimize their energy consumption and reduce costs, the trend towards captive power generation appears poised for continued expansion. The market landscape is likely to witness increased competition among energy providers, as well as innovations in energy management solutions, which could enhance efficiency and sustainability in power generation practices.

    Rise of Renewable Energy Integration

    The Captive Power Generation Market is witnessing a marked shift towards the integration of renewable energy sources. Industries are increasingly adopting solar, wind, and biomass technologies to generate power on-site, which not only reduces carbon footprints but also enhances energy independence. This trend reflects a broader commitment to sustainability and aligns with global climate goals.

    Technological Advancements in Energy Management

    Innovations in energy management systems are transforming the Captive Power Generation Market. Enhanced monitoring and control technologies enable organizations to optimize energy usage, improve efficiency, and reduce operational costs. These advancements facilitate better integration of diverse energy sources, including renewables, into existing power generation frameworks.

    Regulatory Support for Self-Generation

    Government policies are increasingly favoring self-generation initiatives within the Captive Power Generation Market. Regulatory frameworks are being established to incentivize industries to invest in captive power solutions, thereby promoting energy security and sustainability. This supportive environment is likely to drive further growth and innovation in the sector.

    Captive Power Generation Market Market Drivers

    Increasing Energy Demand

    The Captive Power Generation Market is experiencing a notable surge in energy demand across various sectors, including manufacturing, mining, and commercial enterprises. This heightened demand is primarily driven by industrial growth and urbanization, which necessitate reliable and uninterrupted power supply. According to recent data, energy consumption in industrial sectors has increased by approximately 3.5 percent annually, indicating a robust need for self-generated power solutions. Companies are increasingly turning to captive power generation to mitigate risks associated with grid failures and fluctuating energy prices. This trend suggests that businesses are prioritizing energy independence, thereby propelling the growth of the captive power generation market.

    Cost Efficiency and Economic Viability

    Cost efficiency remains a pivotal driver in the Captive Power Generation Market. Organizations are increasingly recognizing the financial benefits of generating their own power, particularly in regions where electricity tariffs are high. By investing in captive power systems, companies can significantly reduce their operational costs, as they are less susceptible to price volatility in the energy market. Recent analyses indicate that businesses can save up to 30 percent on energy costs by utilizing captive generation. This economic viability is particularly appealing to sectors with high energy consumption, such as manufacturing and heavy industries, further stimulating the growth of the captive power generation market.

    Regulatory Incentives for Self-Generation

    Regulatory frameworks are increasingly favoring self-generation, which is a significant driver for the Captive Power Generation Market. Governments are implementing policies that encourage businesses to invest in captive power systems, including tax incentives, subsidies, and streamlined permitting processes. These regulatory incentives are designed to promote energy independence and reduce reliance on traditional grid systems. Recent reports indicate that regions with supportive regulatory environments have seen a 20 percent increase in captive power installations. This trend suggests that favorable policies are likely to continue driving the growth of the captive power generation market, as businesses seek to capitalize on these opportunities.

    Technological Innovations in Power Generation

    Technological advancements are reshaping the Captive Power Generation Market, enabling more efficient and sustainable energy solutions. Innovations such as combined heat and power (CHP) systems, advanced energy storage, and smart grid technologies are enhancing the performance and reliability of captive power systems. These technologies not only improve energy efficiency but also facilitate the integration of renewable energy sources, which is becoming increasingly important. The adoption of such technologies is projected to grow, with estimates suggesting a compound annual growth rate of 5 percent in the next five years. This trend indicates a shift towards more sophisticated energy management practices within the captive power generation market.

    Environmental Sustainability and Corporate Responsibility

    The growing emphasis on environmental sustainability is influencing the Captive Power Generation Market. Companies are increasingly adopting captive power generation as part of their corporate social responsibility initiatives, aiming to reduce their carbon footprint and enhance their sustainability profiles. The shift towards cleaner energy sources, such as solar and wind, is becoming more pronounced, with many organizations committing to net-zero emissions targets. Data indicates that businesses utilizing renewable captive power solutions can reduce greenhouse gas emissions by up to 50 percent. This commitment to sustainability not only aligns with consumer expectations but also positions companies favorably in the market, thereby driving the growth of the captive power generation market.

    Market Segment Insights

    By Technology: Gas Engines (Largest) vs. Turbines (Fastest-Growing)

    <p>In the Captive Power Generation Market, the technology segment exhibits a diverse array of segment values, primarily composed of Gas Engines, Turbines, Heat Exchangers, Transformers, and Others. Gas Engines dominate the market due to their efficiency and reliability, holding a substantial share compared to Turbines, which are rapidly gaining traction as a preferred choice for new installations. Heat Exchangers and Transformers also play critical roles, although they hold comparatively smaller shares in this segment.</p>

    <p>Technology: Gas Engines (Dominant) vs. Turbines (Emerging)</p>

    <p>Gas Engines have established themselves as the dominant technology in the captive power generation landscape, known for their efficiency and flexibility in power generation applications. They are particularly favored in industrial settings due to their ability to operate on various gases and their quick start-up times. On the other hand, Turbines represent an emerging technology that is rapidly gaining popularity for their scalability and high-power output, particularly in renewable contexts. As technologies evolve, Turbines are becoming increasingly integrated with renewable energy sources, offering a cleaner and more sustainable solution for captive power generation, thereby positioning themselves as a strong contender in the market.</p>

    By Fuel: Diesel (Largest) vs. Gas (Fastest-Growing)

    <p>In the Captive Power Generation Market, the fuel segment is diverse, encompassing Diesel, Gas, Coal, and Others. Diesel remains the largest fuel source owing to its widespread availability and reliability in remote applications where grid access is limited. Gas follows closely, gaining traction due to its cleaner burning properties and increasing support from government policies aimed at reducing carbon emissions. The presence of Coal remains stable as a traditional energy source, but its growth is challenged by environmental regulations favoring cleaner fuels.</p>

    <p>Diesel (Dominant) vs. Gas (Emerging)</p>

    <p>The dominance of Diesel in the captive power generation sector can be attributed to its robust performance and adaptability in various operational settings. Diesel generators are preferred for their quick start-up capabilities and high energy density, making them suitable for emergency and peak load scenarios. In contrast, Gas has emerged as a significant player, driven by the shift towards cleaner energy alternatives. With advancements in gas turbine technology and the supportive regulatory environment promoting natural gas usage, it is quickly gaining ground as an efficient and environmentally friendly option for captive power generation.</p>

    By Ownership: Single Ownership (Largest) vs. Multiple Ownership (Fastest-Growing)

    <p>In the Captive Power Generation Market, the ownership segment reveals a distinct division between Single Ownership and Multiple Ownership. Single Ownership holds a significant share of the market, characterized by individual entities investing in and managing their own power generation systems. This model offers a degree of control and reliability that appeals to large industrial players and critical infrastructure. On the other hand, Multiple Ownership models, where several stakeholders collaborate on power generation, are gaining traction, indicating a shift in operational strategies among businesses. The growth trends within the Ownership segment highlight an increasing interest in Multiple Ownership structures, mainly driven by rising energy costs and the need for energy security. Companies are recognizing the value of shared resources, which not only reduces capital expenditure but also enables scalability and flexibility in energy production. Factors such as deregulation of energy markets and advancements in technology further fuel the trend towards multiple ownership, allowing diversified investments and shared risks.</p>

    <p>Ownership: Single Ownership (Dominant) vs. Multiple Ownership (Emerging)</p>

    <p>The characteristics of Single Ownership in the Captive Power Generation Market position it as a dominant force. This model allows companies to take complete control over their energy resources, optimizing efficiency and ensuring reliable supply tailored to specific operational needs. Companies investing in single ownership often benefit from long-term stability, as they can directly manage expenditures and align energy usage with corporate strategies. In contrast, Multiple Ownership represents an emerging trend, encouraging collaboration among businesses to create pooled resources. This method fosters innovation and adaptability, enabling participants to share responsibilities and risks. As energy demands evolve, both ownership models are likely to coexist, catering to diverse business needs and operational preferences in the sector.</p>

    By Connectivity: On-Grid (Largest) vs. OffGrid (Fastest-Growing)

    <p>In the Captive Power Generation Market, the distribution of market share between On-Grid and OffGrid segments reveals a clear dominance of On-Grid solutions, which continue to serve as the backbone of power generation efforts. These interconnected systems leverage existing infrastructure, provide reliability, and cater to large-scale industrial establishments. Conversely, the OffGrid segment has seen rapid growth, driven by the need for energy independence, especially in rural areas and developing markets where electricity access is limited. As global energy demands rise and sustainability efforts gain momentum, the OffGrid segment is positioned for exponential growth. Technological advancements in renewable energy sources, such as solar and wind, coupled with governmental support for decentralized energy production, are fueling this trend. The market's shift towards decentralized generation is evident, with OffGrid solutions appealing to consumers seeking cost-effective, resilient, and clean energy alternatives, thereby shaping the market's long-term trajectory.</p>

    <p>Connectivity: On-Grid (Dominant) vs. OffGrid (Emerging)</p>

    <p>The On-Grid segment is characterized by its efficient integration with national or regional power grids, allowing for seamless energy production and distribution. This segment benefits from economies of scale, reduced operational costs, and enhanced reliability, making it the preferred choice for larger industries and commercial applications. Meanwhile, the OffGrid segment, categorized as emerging, represents a dynamic shift towards localized energy solutions. It primarily focuses on self-sufficiency and resilience, providing energy access to underserved populations. OffGrid systems often incorporate a mix of renewable energy sources and energy storage solutions, addressing the growing demand for sustainable practices and energy independence. The appeal of OffGrid technology is increasing, particularly in areas facing instability in traditional power supply, making it an attractive option for diverse energy consumers.</p>

    By End Use: Industrial (Largest) vs. Residential (Fastest-Growing)

    <p>In the Captive Power Generation Market, the industrial segment stands out as the largest contributor, benefiting from the high electricity demands of manufacturing and large-scale operations. This sector significantly relies on captive power generation to ensure energy security and efficiency, especially in regions with unreliable grid infrastructure. The commercial segment is notable as well, driven by the need for continuous power supply in hospitals, data centers, and office complexes, while the residential segment, although smaller, is quickly gaining traction due to increasing reliance on decentralized energy systems.</p>

    <p>Commercial: Dominant vs. Residential: Emerging</p>

    <p>The commercial segment is characterized by its dominance in the captive power generation landscape, with businesses seeking reliable, cost-effective energy solutions to maintain operations and reduce grid dependency. This segment encompasses a diverse range of users, including shopping malls, hospitals, and educational institutions, all of which have critical power needs. On the other hand, the residential segment is emerging rapidly, driven by increased consumer awareness of renewable energy options and government incentives for green technologies. As households look for ways to reduce electricity bills and enhance energy independence, the adoption of solar PV systems and battery storage solutions is on the rise, positioning residential captive power generation as a vital component of the future energy ecosystem.</p>

    Get more detailed insights about Captive Power Generation Market Research Report - Global Forecast till 2035

    Regional Insights

    North America : Energy Innovation Leader

    North America is witnessing significant growth in the captive power generation market, driven by increasing energy demands and a shift towards sustainable energy solutions. The region holds approximately 40% of the global market share, making it the largest market. Regulatory support for renewable energy and energy independence initiatives further catalyze this growth. The demand for reliable power sources in industrial sectors is also a key driver. The United States and Canada are the leading countries in this market, with major players like General Electric and Caterpillar dominating the landscape. The competitive environment is characterized by technological advancements and strategic partnerships among key players. The presence of established companies ensures a robust supply chain and innovation in captive power solutions, enhancing market competitiveness.

    Europe : Sustainable Energy Transition

    Europe is emerging as a significant player in the captive power generation market, driven by stringent environmental regulations and a strong push for renewable energy sources. The region accounts for approximately 30% of the global market share, making it the second-largest market. Government initiatives aimed at reducing carbon emissions and enhancing energy efficiency are key growth drivers. The increasing adoption of decentralized energy systems is also contributing to market expansion. Germany, France, and the UK are at the forefront of this market, with companies like Siemens and Schneider Electric leading the charge. The competitive landscape is marked by innovation in energy technologies and a focus on sustainability. The presence of key players fosters a dynamic environment for growth, as they invest in research and development to meet evolving energy demands.

    Asia-Pacific : Emerging Market Potential

    Asia-Pacific is rapidly becoming a powerhouse in the captive power generation market, driven by industrialization and urbanization. The region holds approximately 25% of the global market share, with countries like India and China leading the charge. The increasing demand for reliable power supply in manufacturing and infrastructure development is a significant growth driver. Government policies promoting energy security and investment in renewable technologies are also catalysts for market expansion. India and China are the leading countries in this sector, with a growing presence of key players such as Mitsubishi Heavy Industries and Wärtsilä. The competitive landscape is evolving, with local and international companies vying for market share. The focus on innovation and cost-effective solutions is shaping the future of captive power generation in the region, making it an attractive market for investment.

    Middle East and Africa : Resource-Rich Opportunities

    The Middle East and Africa region is witnessing a surge in demand for captive power generation, driven by rapid economic growth and energy needs. The region accounts for approximately 5% of the global market share, with countries like South Africa and the UAE leading the way. The increasing focus on energy diversification and investment in infrastructure projects are key growth drivers. Regulatory frameworks supporting private power generation are also enhancing market opportunities. South Africa and the UAE are the primary markets, with key players like ABB and MAN Energy Solutions actively participating. The competitive landscape is characterized by a mix of local and international companies, fostering innovation and collaboration. The region's unique energy challenges present opportunities for tailored solutions, making it an attractive market for captive power generation investments.

    Key Players and Competitive Insights

    The Captive Power Generation Market is currently characterized by a dynamic competitive landscape, driven by increasing energy demands and a growing emphasis on sustainability. Major players such as General Electric (US), Siemens (DE), and Wärtsilä (FI) are strategically positioning themselves through innovation and regional expansion. General Electric (US) focuses on integrating advanced technologies into its power generation solutions, while Siemens (DE) emphasizes digital transformation to enhance operational efficiency. Meanwhile, Wärtsilä (FI) is leveraging its expertise in flexible power generation to cater to the evolving needs of various industries, collectively shaping a competitive environment that prioritizes technological advancement and sustainability.

    Key business tactics within the Captive Power Generation Market include localizing manufacturing and optimizing supply chains to enhance responsiveness to regional demands. The market appears moderately fragmented, with a mix of established players and emerging companies vying for market share. The collective influence of key players fosters a competitive structure that encourages innovation and collaboration, as companies seek to differentiate themselves through unique value propositions.

    In August 2025, General Electric (US) announced a partnership with a leading renewable energy firm to develop hybrid power solutions that combine traditional and renewable energy sources. This strategic move is likely to enhance GE's portfolio, allowing it to offer more sustainable options to its clients while addressing the growing demand for cleaner energy solutions. The partnership underscores GE's commitment to innovation and its proactive approach to adapting to market trends.

    In September 2025, Siemens (DE) unveiled a new digital platform aimed at optimizing energy management for industrial clients. This platform integrates AI and IoT technologies to provide real-time insights into energy consumption and efficiency. The introduction of this platform signifies Siemens' focus on digitalization, which is increasingly becoming a critical factor in the competitive landscape, as companies strive to enhance operational efficiency and reduce costs.

    In July 2025, Wärtsilä (FI) launched a new line of modular power generation units designed for rapid deployment in remote areas. This initiative reflects Wärtsilä's strategy to cater to underserved markets and enhance energy access. The modular design allows for flexibility and scalability, positioning Wärtsilä as a leader in providing tailored solutions that meet diverse customer needs.

    As of October 2025, the Captive Power Generation Market is witnessing significant trends such as digitalization, sustainability, and the integration of AI technologies. Strategic alliances among key players are shaping the current landscape, fostering innovation and collaboration. Looking ahead, competitive differentiation is likely to evolve from traditional price-based competition to a focus on technological innovation, supply chain reliability, and sustainable practices, as companies adapt to the changing energy landscape.

    Key Companies in the Captive Power Generation Market market include

    Industry Developments

    Aug-2022:To cater to the captive needs of round-the-clock power and intermittent energy for Green Hydrogen, Reliance Industries plans on establishing 20 GW of solar energy generation capacity by 2025.

    Future Outlook

    Captive Power Generation Market Future Outlook

    <p>The Captive Power Generation Market is projected to grow at a 4.8% CAGR from 2024 to 2035, driven by increasing energy demands, technological advancements, and sustainability initiatives.</p>

    New opportunities lie in:

    • <p>Integration of renewable energy sources for hybrid systems</p>
    • <p>Development of energy storage solutions to enhance reliability</p>
    • <p>Expansion of microgrid technologies for localized power generation</p>

    <p>By 2035, the market is expected to achieve robust growth, positioning itself as a key player in global energy solutions.</p>

    Market Segmentation

    Captive Power Generation Market Fuel Outlook

    • Diesel
    • Gas
    • Coal
    • Others

    Captive Power Generation Market End Use Outlook

    • Industrial
    • Commercial
    • Residential

    Captive Power Generation Market Ownership Outlook

    • Single Ownership
    • Multiple Ownership

    Captive Power Generation Market Technology Outlook

    • Heat Exchangers
    • Turbines
    • Gas Engines
    • Transformers
    • Others

    Captive Power Generation Market Connectivity Outlook

    • OffGrid
    • On-Grid

    Report Scope

    MARKET SIZE 2024562.95(USD Billion)
    MARKET SIZE 2025589.98(USD Billion)
    MARKET SIZE 2035943.05(USD Billion)
    COMPOUND ANNUAL GROWTH RATE (CAGR)4.8% (2024 - 2035)
    REPORT COVERAGERevenue Forecast, Competitive Landscape, Growth Factors, and Trends
    BASE YEAR2024
    Market Forecast Period2025 - 2035
    Historical Data2019 - 2024
    Market Forecast UnitsUSD Billion
    Key Companies ProfiledMarket analysis in progress
    Segments CoveredMarket segmentation analysis in progress
    Key Market OpportunitiesIntegration of renewable energy sources enhances sustainability in the Captive Power Generation Market.
    Key Market DynamicsRising demand for energy independence drives investment in captive power generation technologies and infrastructure.
    Countries CoveredNorth America, Europe, APAC, South America, MEA

    FAQs

    What is the projected market valuation for the Captive Power Generation Market in 2035?

    The Captive Power Generation Market is projected to reach a valuation of 943.05 USD Billion by 2035.

    What was the market valuation for the Captive Power Generation Market in 2024?

    In 2024, the overall market valuation for the Captive Power Generation Market was 562.95 USD Billion.

    What is the expected CAGR for the Captive Power Generation Market from 2025 to 2035?

    The expected CAGR for the Captive Power Generation Market during the forecast period 2025 - 2035 is 4.8%.

    Which companies are considered key players in the Captive Power Generation Market?

    Key players in the Captive Power Generation Market include General Electric, Siemens, Caterpillar, Mitsubishi Heavy Industries, Schneider Electric, Cummins, Wärtsilä, ABB, and MAN Energy Solutions.

    What are the projected values for the Gas segment in the Captive Power Generation Market?

    The Gas segment is projected to grow from 200.0 USD Billion to 320.0 USD Billion during the forecast period.

    How does the On-Grid connectivity segment perform in terms of market valuation?

    The On-Grid connectivity segment is expected to increase from 450.36 USD Billion to 758.05 USD Billion by 2035.

    1. SECTION I: EXECUTIVE SUMMARY AND KEY HIGHLIGHTS
      1. EXECUTIVE SUMMARY
        1. Market Overview
        2. Key Findings
        3. Market Segmentation
        4. Competitive Landscape
        5. Challenges and Opportunities
        6. Future Outlook
    2. SECTION II: SCOPING, METHODOLOGY AND MARKET STRUCTURE
      1. MARKET INTRODUCTION
        1. Definition
        2. Scope of the study
      2. RESEARCH METHODOLOGY
        1. Overview
        2. Data Mining
        3. Secondary Research
        4. Primary Research
        5. Forecasting Model
        6. Market Size Estimation
        7. Data Triangulation
        8. Validation
    3. SECTION III: QUALITATIVE ANALYSIS
      1. MARKET DYNAMICS
        1. Overview
        2. Drivers
        3. Restraints
        4. Opportunities
      2. MARKET FACTOR ANALYSIS
        1. Value chain Analysis
        2. Porter's Five Forces Analysis
        3. COVID-19 Impact Analysis
    4. SECTION IV: QUANTITATIVE ANALYSIS
      1. Energy & Power, BY Technology (USD Billion)
        1. Heat Exchangers
        2. Turbines
        3. Gas Engines
        4. Transformers
        5. Others
      2. Energy & Power, BY Fuel (USD Billion)
        1. Diesel
        2. Gas
        3. Coal
        4. Others
      3. Energy & Power, BY Ownership (USD Billion)
        1. Single Ownership
        2. Multiple Ownership
      4. Energy & Power, BY Connectivity (USD Billion)
        1. OffGrid
        2. On-Grid
      5. Energy & Power, BY End Use (USD Billion)
        1. Industrial
        2. Commercial
        3. Residential
      6. Energy & Power, BY Region (USD Billion)
        1. North America
        2. Europe
        3. APAC
        4. South America
        5. MEA
    5. SECTION V: COMPETITIVE ANALYSIS
      1. Competitive Landscape
        1. Overview
        2. Competitive Analysis
        3. Market share Analysis
        4. Major Growth Strategy in the Energy & Power
        5. Competitive Benchmarking
        6. Leading Players in Terms of Number of Developments in the Energy & Power
        7. Key developments and growth strategies
        8. Major Players Financial Matrix
      2. Company Profiles
        1. General Electric (US)
        2. Siemens (DE)
        3. Caterpillar (US)
        4. Mitsubishi Heavy Industries (JP)
        5. Schneider Electric (FR)
        6. Cummins (US)
        7. Wärtsilä (FI)
        8. ABB (CH)
        9. MAN Energy Solutions (DE)
      3. Appendix
        1. References
        2. Related Reports
    6. LIST OF FIGURES
      1. MARKET SYNOPSIS
      2. NORTH AMERICA MARKET ANALYSIS
      3. US MARKET ANALYSIS BY TECHNOLOGY
      4. US MARKET ANALYSIS BY FUEL
      5. US MARKET ANALYSIS BY OWNERSHIP
      6. US MARKET ANALYSIS BY CONNECTIVITY
      7. US MARKET ANALYSIS BY END USE
      8. CANADA MARKET ANALYSIS BY TECHNOLOGY
      9. CANADA MARKET ANALYSIS BY FUEL
      10. CANADA MARKET ANALYSIS BY OWNERSHIP
      11. CANADA MARKET ANALYSIS BY CONNECTIVITY
      12. CANADA MARKET ANALYSIS BY END USE
      13. EUROPE MARKET ANALYSIS
      14. GERMANY MARKET ANALYSIS BY TECHNOLOGY
      15. GERMANY MARKET ANALYSIS BY FUEL
      16. GERMANY MARKET ANALYSIS BY OWNERSHIP
      17. GERMANY MARKET ANALYSIS BY CONNECTIVITY
      18. GERMANY MARKET ANALYSIS BY END USE
      19. UK MARKET ANALYSIS BY TECHNOLOGY
      20. UK MARKET ANALYSIS BY FUEL
      21. UK MARKET ANALYSIS BY OWNERSHIP
      22. UK MARKET ANALYSIS BY CONNECTIVITY
      23. UK MARKET ANALYSIS BY END USE
      24. FRANCE MARKET ANALYSIS BY TECHNOLOGY
      25. FRANCE MARKET ANALYSIS BY FUEL
      26. FRANCE MARKET ANALYSIS BY OWNERSHIP
      27. FRANCE MARKET ANALYSIS BY CONNECTIVITY
      28. FRANCE MARKET ANALYSIS BY END USE
      29. RUSSIA MARKET ANALYSIS BY TECHNOLOGY
      30. RUSSIA MARKET ANALYSIS BY FUEL
      31. RUSSIA MARKET ANALYSIS BY OWNERSHIP
      32. RUSSIA MARKET ANALYSIS BY CONNECTIVITY
      33. RUSSIA MARKET ANALYSIS BY END USE
      34. ITALY MARKET ANALYSIS BY TECHNOLOGY
      35. ITALY MARKET ANALYSIS BY FUEL
      36. ITALY MARKET ANALYSIS BY OWNERSHIP
      37. ITALY MARKET ANALYSIS BY CONNECTIVITY
      38. ITALY MARKET ANALYSIS BY END USE
      39. SPAIN MARKET ANALYSIS BY TECHNOLOGY
      40. SPAIN MARKET ANALYSIS BY FUEL
      41. SPAIN MARKET ANALYSIS BY OWNERSHIP
      42. SPAIN MARKET ANALYSIS BY CONNECTIVITY
      43. SPAIN MARKET ANALYSIS BY END USE
      44. REST OF EUROPE MARKET ANALYSIS BY TECHNOLOGY
      45. REST OF EUROPE MARKET ANALYSIS BY FUEL
      46. REST OF EUROPE MARKET ANALYSIS BY OWNERSHIP
      47. REST OF EUROPE MARKET ANALYSIS BY CONNECTIVITY
      48. REST OF EUROPE MARKET ANALYSIS BY END USE
      49. APAC MARKET ANALYSIS
      50. CHINA MARKET ANALYSIS BY TECHNOLOGY
      51. CHINA MARKET ANALYSIS BY FUEL
      52. CHINA MARKET ANALYSIS BY OWNERSHIP
      53. CHINA MARKET ANALYSIS BY CONNECTIVITY
      54. CHINA MARKET ANALYSIS BY END USE
      55. INDIA MARKET ANALYSIS BY TECHNOLOGY
      56. INDIA MARKET ANALYSIS BY FUEL
      57. INDIA MARKET ANALYSIS BY OWNERSHIP
      58. INDIA MARKET ANALYSIS BY CONNECTIVITY
      59. INDIA MARKET ANALYSIS BY END USE
      60. JAPAN MARKET ANALYSIS BY TECHNOLOGY
      61. JAPAN MARKET ANALYSIS BY FUEL
      62. JAPAN MARKET ANALYSIS BY OWNERSHIP
      63. JAPAN MARKET ANALYSIS BY CONNECTIVITY
      64. JAPAN MARKET ANALYSIS BY END USE
      65. SOUTH KOREA MARKET ANALYSIS BY TECHNOLOGY
      66. SOUTH KOREA MARKET ANALYSIS BY FUEL
      67. SOUTH KOREA MARKET ANALYSIS BY OWNERSHIP
      68. SOUTH KOREA MARKET ANALYSIS BY CONNECTIVITY
      69. SOUTH KOREA MARKET ANALYSIS BY END USE
      70. MALAYSIA MARKET ANALYSIS BY TECHNOLOGY
      71. MALAYSIA MARKET ANALYSIS BY FUEL
      72. MALAYSIA MARKET ANALYSIS BY OWNERSHIP
      73. MALAYSIA MARKET ANALYSIS BY CONNECTIVITY
      74. MALAYSIA MARKET ANALYSIS BY END USE
      75. THAILAND MARKET ANALYSIS BY TECHNOLOGY
      76. THAILAND MARKET ANALYSIS BY FUEL
      77. THAILAND MARKET ANALYSIS BY OWNERSHIP
      78. THAILAND MARKET ANALYSIS BY CONNECTIVITY
      79. THAILAND MARKET ANALYSIS BY END USE
      80. INDONESIA MARKET ANALYSIS BY TECHNOLOGY
      81. INDONESIA MARKET ANALYSIS BY FUEL
      82. INDONESIA MARKET ANALYSIS BY OWNERSHIP
      83. INDONESIA MARKET ANALYSIS BY CONNECTIVITY
      84. INDONESIA MARKET ANALYSIS BY END USE
      85. REST OF APAC MARKET ANALYSIS BY TECHNOLOGY
      86. REST OF APAC MARKET ANALYSIS BY FUEL
      87. REST OF APAC MARKET ANALYSIS BY OWNERSHIP
      88. REST OF APAC MARKET ANALYSIS BY CONNECTIVITY
      89. REST OF APAC MARKET ANALYSIS BY END USE
      90. SOUTH AMERICA MARKET ANALYSIS
      91. BRAZIL MARKET ANALYSIS BY TECHNOLOGY
      92. BRAZIL MARKET ANALYSIS BY FUEL
      93. BRAZIL MARKET ANALYSIS BY OWNERSHIP
      94. BRAZIL MARKET ANALYSIS BY CONNECTIVITY
      95. BRAZIL MARKET ANALYSIS BY END USE
      96. MEXICO MARKET ANALYSIS BY TECHNOLOGY
      97. MEXICO MARKET ANALYSIS BY FUEL
      98. MEXICO MARKET ANALYSIS BY OWNERSHIP
      99. MEXICO MARKET ANALYSIS BY CONNECTIVITY
      100. MEXICO MARKET ANALYSIS BY END USE
      101. ARGENTINA MARKET ANALYSIS BY TECHNOLOGY
      102. ARGENTINA MARKET ANALYSIS BY FUEL
      103. ARGENTINA MARKET ANALYSIS BY OWNERSHIP
      104. ARGENTINA MARKET ANALYSIS BY CONNECTIVITY
      105. ARGENTINA MARKET ANALYSIS BY END USE
      106. REST OF SOUTH AMERICA MARKET ANALYSIS BY TECHNOLOGY
      107. REST OF SOUTH AMERICA MARKET ANALYSIS BY FUEL
      108. REST OF SOUTH AMERICA MARKET ANALYSIS BY OWNERSHIP
      109. REST OF SOUTH AMERICA MARKET ANALYSIS BY CONNECTIVITY
      110. REST OF SOUTH AMERICA MARKET ANALYSIS BY END USE
      111. MEA MARKET ANALYSIS
      112. GCC COUNTRIES MARKET ANALYSIS BY TECHNOLOGY
      113. GCC COUNTRIES MARKET ANALYSIS BY FUEL
      114. GCC COUNTRIES MARKET ANALYSIS BY OWNERSHIP
      115. GCC COUNTRIES MARKET ANALYSIS BY CONNECTIVITY
      116. GCC COUNTRIES MARKET ANALYSIS BY END USE
      117. SOUTH AFRICA MARKET ANALYSIS BY TECHNOLOGY
      118. SOUTH AFRICA MARKET ANALYSIS BY FUEL
      119. SOUTH AFRICA MARKET ANALYSIS BY OWNERSHIP
      120. SOUTH AFRICA MARKET ANALYSIS BY CONNECTIVITY
      121. SOUTH AFRICA MARKET ANALYSIS BY END USE
      122. REST OF MEA MARKET ANALYSIS BY TECHNOLOGY
      123. REST OF MEA MARKET ANALYSIS BY FUEL
      124. REST OF MEA MARKET ANALYSIS BY OWNERSHIP
      125. REST OF MEA MARKET ANALYSIS BY CONNECTIVITY
      126. REST OF MEA MARKET ANALYSIS BY END USE
      127. KEY BUYING CRITERIA OF ENERGY & POWER
      128. RESEARCH PROCESS OF MRFR
      129. DRO ANALYSIS OF ENERGY & POWER
      130. DRIVERS IMPACT ANALYSIS: ENERGY & POWER
      131. RESTRAINTS IMPACT ANALYSIS: ENERGY & POWER
      132. SUPPLY / VALUE CHAIN: ENERGY & POWER
      133. ENERGY & POWER, BY TECHNOLOGY, 2024 (% SHARE)
      134. ENERGY & POWER, BY TECHNOLOGY, 2024 TO 2035 (USD Billion)
      135. ENERGY & POWER, BY FUEL, 2024 (% SHARE)
      136. ENERGY & POWER, BY FUEL, 2024 TO 2035 (USD Billion)
      137. ENERGY & POWER, BY OWNERSHIP, 2024 (% SHARE)
      138. ENERGY & POWER, BY OWNERSHIP, 2024 TO 2035 (USD Billion)
      139. ENERGY & POWER, BY CONNECTIVITY, 2024 (% SHARE)
      140. ENERGY & POWER, BY CONNECTIVITY, 2024 TO 2035 (USD Billion)
      141. ENERGY & POWER, BY END USE, 2024 (% SHARE)
      142. ENERGY & POWER, BY END USE, 2024 TO 2035 (USD Billion)
      143. BENCHMARKING OF MAJOR COMPETITORS
    7. LIST OF TABLES
      1. LIST OF ASSUMPTIONS
      2. 7.1.1
      3. North America MARKET SIZE ESTIMATES; FORECAST
        1. BY TECHNOLOGY, 2025-2035 (USD Billion)
        2. BY FUEL, 2025-2035 (USD Billion)
        3. BY OWNERSHIP, 2025-2035 (USD Billion)
        4. BY CONNECTIVITY, 2025-2035 (USD Billion)
        5. BY END USE, 2025-2035 (USD Billion)
      4. US MARKET SIZE ESTIMATES; FORECAST
        1. BY TECHNOLOGY, 2025-2035 (USD Billion)
        2. BY FUEL, 2025-2035 (USD Billion)
        3. BY OWNERSHIP, 2025-2035 (USD Billion)
        4. BY CONNECTIVITY, 2025-2035 (USD Billion)
        5. BY END USE, 2025-2035 (USD Billion)
      5. Canada MARKET SIZE ESTIMATES; FORECAST
        1. BY TECHNOLOGY, 2025-2035 (USD Billion)
        2. BY FUEL, 2025-2035 (USD Billion)
        3. BY OWNERSHIP, 2025-2035 (USD Billion)
        4. BY CONNECTIVITY, 2025-2035 (USD Billion)
        5. BY END USE, 2025-2035 (USD Billion)
      6. Europe MARKET SIZE ESTIMATES; FORECAST
        1. BY TECHNOLOGY, 2025-2035 (USD Billion)
        2. BY FUEL, 2025-2035 (USD Billion)
        3. BY OWNERSHIP, 2025-2035 (USD Billion)
        4. BY CONNECTIVITY, 2025-2035 (USD Billion)
        5. BY END USE, 2025-2035 (USD Billion)
      7. Germany MARKET SIZE ESTIMATES; FORECAST
        1. BY TECHNOLOGY, 2025-2035 (USD Billion)
        2. BY FUEL, 2025-2035 (USD Billion)
        3. BY OWNERSHIP, 2025-2035 (USD Billion)
        4. BY CONNECTIVITY, 2025-2035 (USD Billion)
        5. BY END USE, 2025-2035 (USD Billion)
      8. UK MARKET SIZE ESTIMATES; FORECAST
        1. BY TECHNOLOGY, 2025-2035 (USD Billion)
        2. BY FUEL, 2025-2035 (USD Billion)
        3. BY OWNERSHIP, 2025-2035 (USD Billion)
        4. BY CONNECTIVITY, 2025-2035 (USD Billion)
        5. BY END USE, 2025-2035 (USD Billion)
      9. France MARKET SIZE ESTIMATES; FORECAST
        1. BY TECHNOLOGY, 2025-2035 (USD Billion)
        2. BY FUEL, 2025-2035 (USD Billion)
        3. BY OWNERSHIP, 2025-2035 (USD Billion)
        4. BY CONNECTIVITY, 2025-2035 (USD Billion)
        5. BY END USE, 2025-2035 (USD Billion)
      10. Russia MARKET SIZE ESTIMATES; FORECAST
        1. BY TECHNOLOGY, 2025-2035 (USD Billion)
        2. BY FUEL, 2025-2035 (USD Billion)
        3. BY OWNERSHIP, 2025-2035 (USD Billion)
        4. BY CONNECTIVITY, 2025-2035 (USD Billion)
        5. BY END USE, 2025-2035 (USD Billion)
      11. Italy MARKET SIZE ESTIMATES; FORECAST
        1. BY TECHNOLOGY, 2025-2035 (USD Billion)
        2. BY FUEL, 2025-2035 (USD Billion)
        3. BY OWNERSHIP, 2025-2035 (USD Billion)
        4. BY CONNECTIVITY, 2025-2035 (USD Billion)
        5. BY END USE, 2025-2035 (USD Billion)
      12. Spain MARKET SIZE ESTIMATES; FORECAST
        1. BY TECHNOLOGY, 2025-2035 (USD Billion)
        2. BY FUEL, 2025-2035 (USD Billion)
        3. BY OWNERSHIP, 2025-2035 (USD Billion)
        4. BY CONNECTIVITY, 2025-2035 (USD Billion)
        5. BY END USE, 2025-2035 (USD Billion)
      13. Rest of Europe MARKET SIZE ESTIMATES; FORECAST
        1. BY TECHNOLOGY, 2025-2035 (USD Billion)
        2. BY FUEL, 2025-2035 (USD Billion)
        3. BY OWNERSHIP, 2025-2035 (USD Billion)
        4. BY CONNECTIVITY, 2025-2035 (USD Billion)
        5. BY END USE, 2025-2035 (USD Billion)
      14. APAC MARKET SIZE ESTIMATES; FORECAST
        1. BY TECHNOLOGY, 2025-2035 (USD Billion)
        2. BY FUEL, 2025-2035 (USD Billion)
        3. BY OWNERSHIP, 2025-2035 (USD Billion)
        4. BY CONNECTIVITY, 2025-2035 (USD Billion)
        5. BY END USE, 2025-2035 (USD Billion)
      15. China MARKET SIZE ESTIMATES; FORECAST
        1. BY TECHNOLOGY, 2025-2035 (USD Billion)
        2. BY FUEL, 2025-2035 (USD Billion)
        3. BY OWNERSHIP, 2025-2035 (USD Billion)
        4. BY CONNECTIVITY, 2025-2035 (USD Billion)
        5. BY END USE, 2025-2035 (USD Billion)
      16. India MARKET SIZE ESTIMATES; FORECAST
        1. BY TECHNOLOGY, 2025-2035 (USD Billion)
        2. BY FUEL, 2025-2035 (USD Billion)
        3. BY OWNERSHIP, 2025-2035 (USD Billion)
        4. BY CONNECTIVITY, 2025-2035 (USD Billion)
        5. BY END USE, 2025-2035 (USD Billion)
      17. Japan MARKET SIZE ESTIMATES; FORECAST
        1. BY TECHNOLOGY, 2025-2035 (USD Billion)
        2. BY FUEL, 2025-2035 (USD Billion)
        3. BY OWNERSHIP, 2025-2035 (USD Billion)
        4. BY CONNECTIVITY, 2025-2035 (USD Billion)
        5. BY END USE, 2025-2035 (USD Billion)
      18. South Korea MARKET SIZE ESTIMATES; FORECAST
        1. BY TECHNOLOGY, 2025-2035 (USD Billion)
        2. BY FUEL, 2025-2035 (USD Billion)
        3. BY OWNERSHIP, 2025-2035 (USD Billion)
        4. BY CONNECTIVITY, 2025-2035 (USD Billion)
        5. BY END USE, 2025-2035 (USD Billion)
      19. Malaysia MARKET SIZE ESTIMATES; FORECAST
        1. BY TECHNOLOGY, 2025-2035 (USD Billion)
        2. BY FUEL, 2025-2035 (USD Billion)
        3. BY OWNERSHIP, 2025-2035 (USD Billion)
        4. BY CONNECTIVITY, 2025-2035 (USD Billion)
        5. BY END USE, 2025-2035 (USD Billion)
      20. Thailand MARKET SIZE ESTIMATES; FORECAST
        1. BY TECHNOLOGY, 2025-2035 (USD Billion)
        2. BY FUEL, 2025-2035 (USD Billion)
        3. BY OWNERSHIP, 2025-2035 (USD Billion)
        4. BY CONNECTIVITY, 2025-2035 (USD Billion)
        5. BY END USE, 2025-2035 (USD Billion)
      21. Indonesia MARKET SIZE ESTIMATES; FORECAST
        1. BY TECHNOLOGY, 2025-2035 (USD Billion)
        2. BY FUEL, 2025-2035 (USD Billion)
        3. BY OWNERSHIP, 2025-2035 (USD Billion)
        4. BY CONNECTIVITY, 2025-2035 (USD Billion)
        5. BY END USE, 2025-2035 (USD Billion)
      22. Rest of APAC MARKET SIZE ESTIMATES; FORECAST
        1. BY TECHNOLOGY, 2025-2035 (USD Billion)
        2. BY FUEL, 2025-2035 (USD Billion)
        3. BY OWNERSHIP, 2025-2035 (USD Billion)
        4. BY CONNECTIVITY, 2025-2035 (USD Billion)
        5. BY END USE, 2025-2035 (USD Billion)
      23. South America MARKET SIZE ESTIMATES; FORECAST
        1. BY TECHNOLOGY, 2025-2035 (USD Billion)
        2. BY FUEL, 2025-2035 (USD Billion)
        3. BY OWNERSHIP, 2025-2035 (USD Billion)
        4. BY CONNECTIVITY, 2025-2035 (USD Billion)
        5. BY END USE, 2025-2035 (USD Billion)
      24. Brazil MARKET SIZE ESTIMATES; FORECAST
        1. BY TECHNOLOGY, 2025-2035 (USD Billion)
        2. BY FUEL, 2025-2035 (USD Billion)
        3. BY OWNERSHIP, 2025-2035 (USD Billion)
        4. BY CONNECTIVITY, 2025-2035 (USD Billion)
        5. BY END USE, 2025-2035 (USD Billion)
      25. Mexico MARKET SIZE ESTIMATES; FORECAST
        1. BY TECHNOLOGY, 2025-2035 (USD Billion)
        2. BY FUEL, 2025-2035 (USD Billion)
        3. BY OWNERSHIP, 2025-2035 (USD Billion)
        4. BY CONNECTIVITY, 2025-2035 (USD Billion)
        5. BY END USE, 2025-2035 (USD Billion)
      26. Argentina MARKET SIZE ESTIMATES; FORECAST
        1. BY TECHNOLOGY, 2025-2035 (USD Billion)
        2. BY FUEL, 2025-2035 (USD Billion)
        3. BY OWNERSHIP, 2025-2035 (USD Billion)
        4. BY CONNECTIVITY, 2025-2035 (USD Billion)
        5. BY END USE, 2025-2035 (USD Billion)
      27. Rest of South America MARKET SIZE ESTIMATES; FORECAST
        1. BY TECHNOLOGY, 2025-2035 (USD Billion)
        2. BY FUEL, 2025-2035 (USD Billion)
        3. BY OWNERSHIP, 2025-2035 (USD Billion)
        4. BY CONNECTIVITY, 2025-2035 (USD Billion)
        5. BY END USE, 2025-2035 (USD Billion)
      28. MEA MARKET SIZE ESTIMATES; FORECAST
        1. BY TECHNOLOGY, 2025-2035 (USD Billion)
        2. BY FUEL, 2025-2035 (USD Billion)
        3. BY OWNERSHIP, 2025-2035 (USD Billion)
        4. BY CONNECTIVITY, 2025-2035 (USD Billion)
        5. BY END USE, 2025-2035 (USD Billion)
      29. GCC Countries MARKET SIZE ESTIMATES; FORECAST
        1. BY TECHNOLOGY, 2025-2035 (USD Billion)
        2. BY FUEL, 2025-2035 (USD Billion)
        3. BY OWNERSHIP, 2025-2035 (USD Billion)
        4. BY CONNECTIVITY, 2025-2035 (USD Billion)
        5. BY END USE, 2025-2035 (USD Billion)
      30. South Africa MARKET SIZE ESTIMATES; FORECAST
        1. BY TECHNOLOGY, 2025-2035 (USD Billion)
        2. BY FUEL, 2025-2035 (USD Billion)
        3. BY OWNERSHIP, 2025-2035 (USD Billion)
        4. BY CONNECTIVITY, 2025-2035 (USD Billion)
        5. BY END USE, 2025-2035 (USD Billion)
      31. Rest of MEA MARKET SIZE ESTIMATES; FORECAST
        1. BY TECHNOLOGY, 2025-2035 (USD Billion)
        2. BY FUEL, 2025-2035 (USD Billion)
        3. BY OWNERSHIP, 2025-2035 (USD Billion)
        4. BY CONNECTIVITY, 2025-2035 (USD Billion)
        5. BY END USE, 2025-2035 (USD Billion)
      32. PRODUCT LAUNCH/PRODUCT DEVELOPMENT/APPROVAL
      33. 7.31.1
      34. ACQUISITION/PARTNERSHIP
      35. 7.32.1

    Captive Power Generation Market Segmentation

    Captive Power Generation Market Technology Outlook (USD Billion, 2018-2032)

    • Heat Exchangers
    • Turbines
    • Gas Engines
    • Transformers
    • Others

    Captive Power Generation Market Fuel Outlook (USD Billion, 2018-2032)

    • Diesel
    • Gas
    • Coal
    • Others

    Captive Power Generation Market Ownership Outlook (USD Billion, 2018-2032)

    • Single Ownership
    • Multiple Ownership

    Captive Power Generation Market Connectivity Outlook (USD Billion, 2018-2032)

    • OffGrid
    • On-Grid

    Captive Power Generation Market End Use Outlook (USD Billion, 2018-2032)

    • Industrial
    • Commercial
    • Residential

    Captive Power Generation Market Regional Outlook (USD Billion, 2018-2032)

    • North America Outlook (USD Billion, 2018-2032)

      • Captive Power Generation Market by Technology
        • Heat Exchangers
        • Turbines
        • Gas Engines
        • Transformers
        • Others
      • Captive Power Generation Market by Fuel
        • Diesel
        • Gas
        • Coal
        • Others
      • Captive Power Generation Market by Ownership
        • Single Ownership
        • Multiple Ownership
      • Captive Power Generation Market by Connectivity
        • OffGrid
        • On-Grid
      • Captive Power Generation Market by End Use
        • Industrial
        • Commercial
        • Residential
      • US Outlook (USD Billion, 2018-2032)

      • Captive Power Generation Market by Technology
        • Heat Exchangers
        • Turbines
        • Gas Engines
        • Transformers
        • Others
      • Captive Power Generation Market by Fuel
        • Diesel
        • Gas
        • Coal
        • Others
      • Captive Power Generation Market by Ownership
        • Single Ownership
        • Multiple Ownership
      • Captive Power Generation Market by Connectivity
        • OffGrid
        • On-Grid
      • Captive Power Generation Market by End Use
        • Industrial
        • Commercial
        • Residential
      • Canada Outlook (USD Billion, 2018-2032)

      • Captive Power Generation Market by Technology
        • Heat Exchangers
        • Turbines
        • Gas Engines
        • Transformers
        • Others
      • Captive Power Generation Market by Fuel
        • Diesel
        • Gas
        • Coal
        • Others
      • Captive Power Generation Market by Ownership
        • Single Ownership
        • Multiple Ownership
      • Captive Power Generation Market by Connectivity
        • OffGrid
        • On-Grid
      • Captive Power Generation Market by End Use
        • Industrial
        • Commercial
        • Residential
    • Europe Outlook (USD Billion, 2018-2032)

      • Captive Power Generation Market by Technology
        • Heat Exchangers
        • Turbines
        • Gas Engines
        • Transformers
        • Others
      • Captive Power Generation Market by Fuel
        • Diesel
        • Gas
        • Coal
        • Others
      • Captive Power Generation Market by Ownership
        • Single Ownership
        • Multiple Ownership
      • Captive Power Generation Market by Connectivity
        • OffGrid
        • On-Grid
      • Captive Power Generation Market by End Use
        • Industrial
        • Commercial
        • Residential
      • Germany Outlook (USD Billion, 2018-2032)

      • Captive Power Generation Market by Technology
        • Heat Exchangers
        • Turbines
        • Gas Engines
        • Transformers
        • Others
      • Captive Power Generation Market by Fuel
        • Diesel
        • Gas
        • Coal
        • Others
      • Captive Power Generation Market by Ownership
        • Single Ownership
        • Multiple Ownership
      • Captive Power Generation Market by Connectivity
        • OffGrid
        • On-Grid
      • Captive Power Generation Market by End Use
        • Industrial
        • Commercial
        • Residential
      • France Outlook (USD Billion, 2018-2032)

      • Captive Power Generation Market by Technology
        • Heat Exchangers
        • Turbines
        • Gas Engines
        • Transformers
        • Others
      • Captive Power Generation Market by Fuel
        • Diesel
        • Gas
        • Coal
        • Others
      • Captive Power Generation Market by Ownership
        • Single Ownership
        • Multiple Ownership
      • Captive Power Generation Market by Connectivity
        • OffGrid
        • On-Grid
      • Captive Power Generation Market by End Use
        • Industrial
        • Commercial
        • Residential
      • UK Outlook (USD Billion, 2018-2032)

      • Captive Power Generation Market by Technology
        • Heat Exchangers
        • Turbines
        • Gas Engines
        • Transformers
        • Others
      • Captive Power Generation Market by Fuel
        • Diesel
        • Gas
        • Coal
        • Others
      • Captive Power Generation Market by Ownership
        • Single Ownership
        • Multiple Ownership
      • Captive Power Generation Market by Connectivity
        • OffGrid
        • On-Grid
      • Captive Power Generation Market by End Use
        • Industrial
        • Commercial
        • Residential
      • Italy Outlook (USD Billion, 2018-2032)

      • Captive Power Generation Market by Technology
        • Heat Exchangers
        • Turbines
        • Gas Engines
        • Transformers
        • Others
      • Captive Power Generation Market by Fuel
        • Diesel
        • Gas
        • Coal
        • Others
      • Captive Power Generation Market by Ownership
        • Single Ownership
        • Multiple Ownership
      • Captive Power Generation Market by Connectivity
        • OffGrid
        • On-Grid
      • Captive Power Generation Market by End Use
        • Industrial
        • Commercial
        • Residential
      • Spain Outlook (USD Billion, 2018-2032)

      • Captive Power Generation Market by Technology
        • Heat Exchangers
        • Turbines
        • Gas Engines
        • Transformers
        • Others
      • Captive Power Generation Market by Fuel
        • Diesel
        • Gas
        • Coal
        • Others
      • Captive Power Generation Market by Ownership
        • Single Ownership
        • Multiple Ownership
      • Captive Power Generation Market by Connectivity
        • OffGrid
        • On-Grid
      • Captive Power Generation Market by End Use
        • Industrial
        • Commercial
        • Residential
      • Rest Of Europe Outlook (USD Billion, 2018-2032)

      • Captive Power Generation Market by Technology
        • Heat Exchangers
        • Turbines
        • Gas Engines
        • Transformers
        • Others
      • Captive Power Generation Market by Fuel
        • Diesel
        • Gas
        • Coal
        • Others
      • Captive Power Generation Market by Ownership
        • Single Ownership
        • Multiple Ownership
      • Captive Power Generation Market by Connectivity
        • OffGrid
        • On-Grid
      • Captive Power Generation Market by End Use
        • Industrial
        • Commercial
        • Residential
    • Asia-Pacific Outlook (USD Billion, 2018-2032)

      • Captive Power Generation Market by Technology
        • Heat Exchangers
        • Turbines
        • Gas Engines
        • Transformers
        • Others
      • Captive Power Generation Market by Fuel
        • Diesel
        • Gas
        • Coal
        • Others
      • Captive Power Generation Market by Ownership
        • Single Ownership
        • Multiple Ownership
      • Captive Power Generation Market by Connectivity
        • OffGrid
        • On-Grid
      • Captive Power Generation Market by End Use
        • Industrial
        • Commercial
        • Residential
      • China Outlook (USD Billion, 2018-2032)

      • Captive Power Generation Market by Technology
        • Heat Exchangers
        • Turbines
        • Gas Engines
        • Transformers
        • Others
      • Captive Power Generation Market by Fuel
        • Diesel
        • Gas
        • Coal
        • Others
      • Captive Power Generation Market by Ownership
        • Single Ownership
        • Multiple Ownership
      • Captive Power Generation Market by Connectivity
        • OffGrid
        • On-Grid
      • Captive Power Generation Market by End Use
        • Industrial
        • Commercial
        • Residential
      • Japan Outlook (USD Billion, 2018-2032)

      • Captive Power Generation Market by Technology
        • Heat Exchangers
        • Turbines
        • Gas Engines
        • Transformers
        • Others
      • Captive Power Generation Market by Fuel
        • Diesel
        • Gas
        • Coal
        • Others
      • Captive Power Generation Market by Ownership
        • Single Ownership
        • Multiple Ownership
      • Captive Power Generation Market by Connectivity
        • OffGrid
        • On-Grid
      • Captive Power Generation Market by End Use
        • Industrial
        • Commercial
        • Residential
      • India Outlook (USD Billion, 2018-2032)

      • Captive Power Generation Market by Technology
        • Heat Exchangers
        • Turbines
        • Gas Engines
        • Transformers
        • Others
      • Captive Power Generation Market by Fuel
        • Diesel
        • Gas
        • Coal
        • Others
      • Captive Power Generation Market by Ownership
        • Single Ownership
        • Multiple Ownership
      • Captive Power Generation Market by Connectivity
        • OffGrid
        • On-Grid
      • Captive Power Generation Market by End Use
        • Industrial
        • Commercial
        • Residential
      • Australia Outlook (USD Billion, 2018-2032)

      • Captive Power Generation Market by Technology
        • Heat Exchangers
        • Turbines
        • Gas Engines
        • Transformers
        • Others
      • Captive Power Generation Market by Fuel
        • Diesel
        • Gas
        • Coal
        • Others
      • Captive Power Generation Market by Ownership
        • Single Ownership
        • Multiple Ownership
      • Captive Power Generation Market by Connectivity
        • OffGrid
        • On-Grid
      • Captive Power Generation Market by End Use
        • Industrial
        • Commercial
        • Residential
      • Rest of Asia-Pacific Outlook (USD Billion, 2018-2032)

      • Captive Power Generation Market by Technology
        • Heat Exchangers
        • Turbines
        • Gas Engines
        • Transformers
        • Others
      • Captive Power Generation Market by Fuel
        • Diesel
        • Gas
        • Coal
        • Others
      • Captive Power Generation Market by Ownership
        • Single Ownership
        • Multiple Ownership
      • Captive Power Generation Market by Connectivity
        • OffGrid
        • On-Grid
      • Captive Power Generation Market by End Use
        • Industrial
        • Commercial
        • Residential
    • Rest of the World Outlook (USD Billion, 2018-2032)

      • Captive Power Generation Market by Technology
        • Heat Exchangers
        • Turbines
        • Gas Engines
        • Transformers
        • Others
      • Captive Power Generation Market by Fuel
        • Diesel
        • Gas
        • Coal
        • Others
      • Captive Power Generation Market by Ownership
        • Single Ownership
        • Multiple Ownership
      • Captive Power Generation Market by Connectivity
        • OffGrid
        • On-Grid
      • Captive Power Generation Market by End Use
        • Industrial
        • Commercial
        • Residential
      • Middle East Outlook (USD Billion, 2018-2032)

      • Captive Power Generation Market by Technology
        • Heat Exchangers
        • Turbines
        • Gas Engines
        • Transformers
        • Others
      • Captive Power Generation Market by Fuel
        • Diesel
        • Gas
        • Coal
        • Others
      • Captive Power Generation Market by Ownership
        • Single Ownership
        • Multiple Ownership
      • Captive Power Generation Market by Connectivity
        • OffGrid
        • On-Grid
      • Captive Power Generation Market by End Use
        • Industrial
        • Commercial
        • Residential
      • Africa Outlook (USD Billion, 2018-2032)

      • Captive Power Generation Market by Technology
        • Heat Exchangers
        • Turbines
        • Gas Engines
        • Transformers
        • Others
      • Captive Power Generation Market by Fuel
        • Diesel
        • Gas
        • Coal
        • Others
      • Captive Power Generation Market by Ownership
        • Single Ownership
        • Multiple Ownership
      • Captive Power Generation Market by Connectivity
        • OffGrid
        • On-Grid
      • Captive Power Generation Market by End Use
        • Industrial
        • Commercial
        • Residential
      • Latin America Outlook (USD Billion, 2018-2032)

      • Captive Power Generation Market by Technology
        • Heat Exchangers
        • Turbines
        • Gas Engines
        • Transformers
        • Others
      • Captive Power Generation Market by Fuel
        • Diesel
        • Gas
        • Coal
        • Others
      • Captive Power Generation Market by Ownership
        • Single Ownership
        • Multiple Ownership
      • Captive Power Generation Market by Connectivity
        • OffGrid
        • On-Grid
      • Captive Power Generation Market by End Use
        • Industrial
        • Commercial
        • Residential
    Infographic

    Free Sample Request

    Kindly complete the form below to receive a free sample of this Report

    Get Free Sample

    Customer Strories

    “I am very pleased with how market segments have been defined in a relevant way for my purposes (such as "Portable Freezers & refrigerators" and "last-mile"). In general the report is well structured. Thanks very much for your efforts.”

    Victoria Milne

    Founder

    Compare Licence

    ×
    Features License Type
    Single User Multiuser License Enterprise User
    Price $4,950 $5,950 $7,250
    Maximum User Access Limit 1 User Upto 10 Users Unrestricted Access Throughout the Organization
    Free Customization
    Direct Access to Analyst
    Deliverable Format
    Platform Access
    Discount on Next Purchase 10% 15% 15%
    Printable Versions