Segmentation Quick Reference
| Dimension | Sub-Segments | Dominant Segment | Fastest Growing Segment |
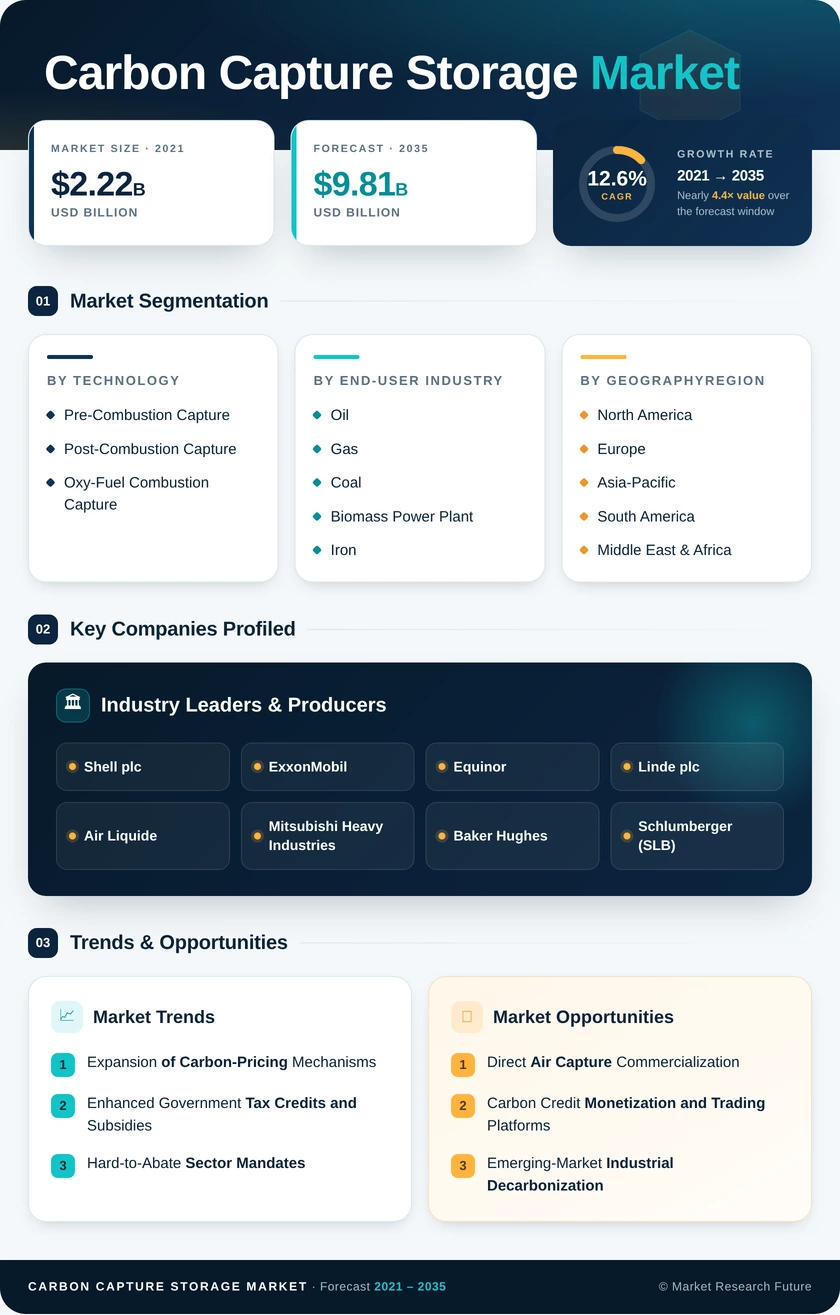
| Carbon Capture Storage Market | Pre-Combustion Capture, Post-Combustion Capture, Oxy-Fuel Combustion Capture | Pre-Combustion Capture | Oxy-Fuel Combustion Capture |
| End-User Industry | Oil and Gas, Coal and Biomass Power Plant, Iron and Steel, Cement, Chemical | Oil and Gas | Chemical |
| Region | North America, Europe, Asia-Pacific, South America, Middle East & Africa | North America | Europe |
Market Segmentation Overview
By Carbon Capture Storage Market
| Sub-Segment | Key Trend |
| Pre-Combustion Capture | Dominant technology tied to gasification and blue hydrogen production; mature cost profile |
| Post-Combustion Capture | Retrofit-friendly architecture attracting demand from existing coal and natural gas fleets |
| Oxy-Fuel Combustion Capture | Emerging adoption in cement and glass manufacturing due to high-purity CO2 output |
Pre-combustion capture retains its leadership position through deep integration with syngas and hydrogen production pathways, while oxy-fuel combustion capture is transitioning from pilot to commercial scale in heavy-industry kilns where its concentrated exhaust stream simplifies downstream compression and transport.
By End-User Industry
| Sub-Segment | Key Trend |
| Oil and Gas | Largest adopter leveraging existing subsurface expertise and EOR infrastructure |
| Coal and Biomass Power Plant | Retrofit mandates and bioenergy CCS (BECCS) create dual policy-driven demand |
| Iron and Steel | Blast-furnace decarbonization via top-gas recycling and capture integration |
| Cement | Process-emission abatement with oxy-fuel and calcium-looping technologies |
| Chemical | Fastest-growing segment driven by ammonia, methanol, and ethylene plant decarbonization requirements |
The oil and gas sector's scale and operational familiarity with CO2 handling sustain its market-leading position, while the chemical segment's rapid growth reflects intensifying regulatory pressure on high-purity industrial emission sources that lack viable electrification alternatives.
By Region
| Sub-Segment | Key Trend |
| North America | Dominant region supported by 45Q tax credits, Gulf Coast infrastructure, and state-level primacy |
| Europe | Fastest-growing region propelled by EU ETS pricing, Northern Lights, and cross-border networks |
| Asia-Pacific | Coal-fleet retrofit demand in China and strategic national CCS programs in Japan and South Korea |
| South America | Pre-salt CO2 reinjection in Brazil; early-stage regulatory development elsewhere |
| Middle East & Africa | Gas-processing capture and sovereign decarbonization investments in Gulf states |
North America's leadership reflects decades of EOR-linked capture experience combined with transformative policy incentives, while Europe's accelerating trajectory is reshaping the competitive region as integrated hub infrastructure scales across the North Sea basin.