Carbon Capture and Storage Market

Key Players: Shell plc, ExxonMobil, Equinor, Linde plc, Air Liquide, Mitsubishi Heavy Industries, Baker Hughes, Schlumberger (SLB)

Carbon Capture and Storage Market

Carbon Capture and Storage Market Size, Share & Growth Analysis Report By Technology (Pre-Combustion Capture, Post-Combustion Capture, Oxy-Fuel Combustion Capture), By End-User Industry (Oil and Gas, Coal and Biomass Power Plant, Iron and Steel, Cement, Chemical) and By Regional - Growth & Industry Forecast to 2035
ID: MRFR/EnP/1330-HCR
128 Pages
Chitranshi Jaiswal
Last Updated: June 18, 2026

Carbon Capture and Storage Market Summary

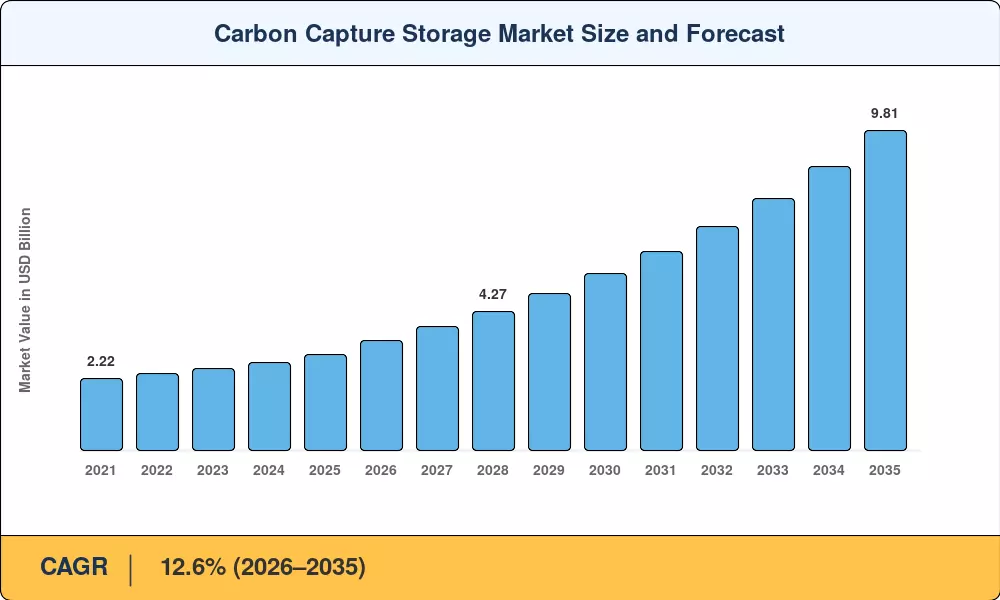
The Carbon Capture and Storage Market stood at USD 2.95 Billion in 2025 and is projected to reach USD 3.37 Billion in 2026 before climbing to USD 9.81 Billion by 2035, registering a CAGR of 12.6% during 2026–2035. This expansion traces directly to the U.S. Inflation Reduction Act's enhanced 45Q tax credit — now worth up to USD 85 per tonne for dedicated geological storage — and the European Union's Carbon Border Adjustment Mechanism, which prices embedded emissions in imported steel, cement, and aluminium [1][2]. Together, these instruments have shifted the Carbon Capture and Storage Market from niche demonstration projects to bankable commercial infrastructure.

The technology landscape is moving fast. First-generation amine scrubbers that dominated early post-combustion CO2 capture installations are giving way to advanced solvent blends, membrane contactors, and solid-sorbent systems that promise 30–40% lower energy penalties [3]. The U.S. Department of Energy committed USD 3.5 billion through its Carbon Capture Demonstration Projects Program to accelerate next-generation capture at coal, gas, and industrial facilities, while the EU Innovation Fund allocated EUR 1.8 billion across fifteen large-scale CCS projects in 2024 alone [4][5].

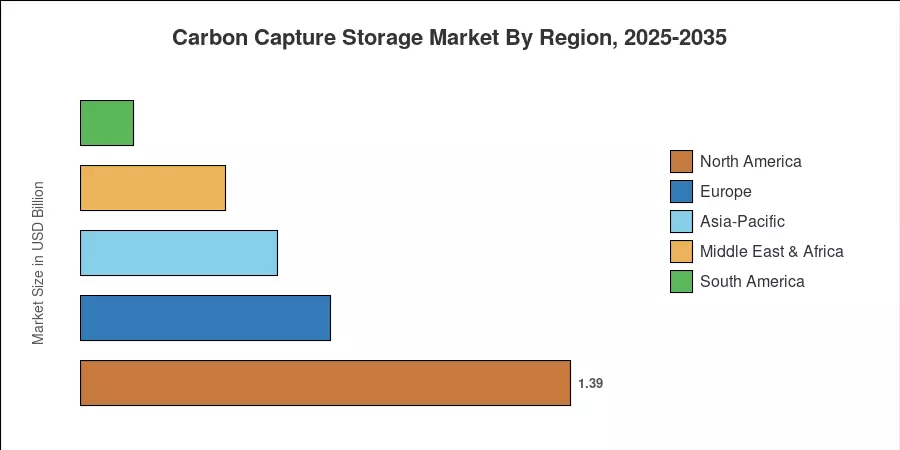
North America commands roughly 47% of the Carbon Capture and Storage Market, anchored by the Gulf Coast's mature pipeline network and sequestration geology. Europe, propelled by aggressive decarbonization targets and cross-border CO2 transport agreements, is the fastest-growing region at a projected CAGR of approximately 24%. Asia-Pacific holds the second-largest share at around 19%, driven by China's coal-dependent power fleet and Japan's strategic investments in offshore storage. The decade ahead will test whether policy momentum translates into sustained deployment at the gigaton scale.


Key Report Takeaways

• By Technology

  • Pre-combustion capture accounted for approximately 76% of the Carbon Capture and Storage Market in 2025, reflecting its established role in hydrogen production and syngas processing.
  • Oxy-fuel combustion capture is positioned as the fastest-growing technology segment at a projected CAGR of roughly 19.6% through 2035.

• By End-User Industry

  • The oil and gas segment represented about 64% of the Carbon Capture and Storage Market size in 2025.
  • The chemical sector is expected to expand at a CAGR of approximately 27% between 2026 and 2035, driven by ammonia and ethylene decarbonization mandates.

• By Region

  • North America led the Carbon Capture and Storage Market with close to 47% revenue share in 2025.
  • Europe is projected to deliver the fastest regional growth, supported by the EU ETS Phase IV framework and North Sea storage developments.
  • Asia-Pacific contributed roughly USD 0.56 billion in 2025, anchored by industrial capture projects in China and Japan.


Carbon Capture and Storage Market Size and Forecast (2021–2035)

Market Research Future derives historical estimates from operational facility databases maintained by the Global CCS Institute, supplemented by disclosed capital expenditure filings and emissions-intensity benchmarks from the IEA Greenhouse Gas R&D Programme. Forecast projections apply a bottom-up capacity model cross-validated against policy pipeline analysis and announced project FID schedules [6][7].

Carbon Capture Storage Market Size and Forecast
Our Impact
Enabled $4.3B Revenue Impact for Fortune 500 and Leading Multinationals
Partnering with 2000+ Global Organizations Each Year
30K+ Citations by Top-Tier Firms in the Industry

Driver Impact Analysis

Driver ~% Impact on CAGR Geographic Relevance Impact Timeline
Expansion of carbon-pricing mechanisms ~22% Global Short-term (≤2 yr)
Enhanced government tax credits and subsidies ~20% North America, Europe Short-term (≤2 yr)
Hard-to-abate sector decarbonization mandates ~18% Europe, Asia-Pacific Medium-term (2–4 yr)
CO2 transport and storage infrastructure buildout ~15% North America, Europe Medium-term (2–4 yr)
Declining capture technology costs ~12% Global Long-term (≥4 yr)
Corporate net-zero commitments and ESG disclosure ~8% Global Medium-term (2–4 yr)
Blue hydrogen demand growth ~5% North America, MEA Long-term (≥4 yr)


Expansion of Carbon-Pricing Mechanisms

The EU Emissions Trading System Phase IV lowered its annual ceiling by 4.3% from 2024, driving allowance prices above EUR 90 per tonne by the end of 2024, which made capture-and-store economics feasible for cement and steel companies [1]. Canada’s government carbon pricing has hit CAD 80/tonne in 2024 and is set to increase to CAD 170 by 2030, producing a reliable price signal that underpins project finance for Alberta’s Carbon Trunk Line and accompanying capture facilities [17]. For the Carbon Capture and Storage Market, the increasing costs of unchecked emissions make CCS a cost-minimising operational necessity instead of an optional abatement strategy.


Enhanced Government Tax Credits and Subsidies

The 45Q credit restructure under the IRA provides $85 per ton for geological storage and $60 per ton for enhanced oil recovery, with direct-pay provisions that allow developers to monetize credits upfront, before revenues are generated [2]. This one policy instrument has freed more than USD 10 billion in announced project funding across the U.S. Gulf Coast between 2023 and 2025 [9]. Norway's NOK 17.1 billion state-funded Longship project illustrates how sovereign investment lowers the risk for first-mover infrastructure and draws private co-investment into the Carbon Capture and Storage Market [12].


Hard-to-Abate Sector Mandates

Cement production is responsible for almost 8% of the world’s CO2 emissions. The clinker process has inevitable process emissions, which cannot be resolved by electrification alone [18]. The updated EU Industrial Emissions Directive mandates Best Available Technique assessments to include CCS preparedness for new permits granted after 2026, whereas Japan’s GX Transition Bonds allocated JPY 1.1 trillion for industrial decarbonization, including steelworks carbon capture [10]. These directives provide for a minimum need by the Carbon Capture and Storage Market, regardless of the energy sector’s dynamics.


CO2 Transport and Storage Infrastructure Buildout

The U.S. Gulf Coast CCS corridor plans include over 3,200 km of dedicated CO2 pipeline, connecting capture facilities in Louisiana and Texas to offshore saline aquifer storage [9]. In Europe, the Northern Lights project achieved its first CO2 injection in 2025, creating an open-access storage service model that multiple industrial emitters can contract into without building proprietary infrastructure [12]. This shared-infrastructure approach dramatically reduces per-project capital intensity and accelerates deployment timelines across the Carbon Capture and Storage Market.


Restraints Impact Analysis

Restraint impact percentages reflect estimated drags on the growth trajectory. They represent analytical assessments of headwinds, not precise offsets to the forecast CAGR.

Restraint ~% Impact on CAGR Geographic Relevance Impact Timeline
High upfront capital costs –6% Global Short-term (≤2 yr)
Long permitting and environmental review cycles –5% North America, Europe Medium-term (2–4 yr)
Public opposition and storage liability concerns –4% Europe, Asia-Pacific Long-term (≥4 yr)
Competition from renewable alternatives –3% Global Medium-term (2–4 yr)
Limited qualified workforce for CCS operations –2% Global Medium-term (2–4 yr)


High Upfront Capital Costs

A commercial-scale capture unit tied to a 500 MW coal plant can cost USD 800 Million to USD 1.2 Billion in capital investment, creating significant pressure on project economics even with 45Q credits [3]. For smaller industrial emitters, especially in cement and chemicals, the capital-to-revenue ratio makes standalone collection financially difficult without aggregated hub infrastructure. This is further aggravated by financing deficits in poor nations, as international development banks have been sluggish to certify CCS as eligible under green bond regimes [14].


Long Permitting and Environmental Review Cycles

The U.S. Class VI Underground Injection Control permit process averaged 4.7 years per application as of 2024, creating a bottleneck that delays storage site development well beyond capture facility construction timelines [19]. The EPA's primacy delegation to individual states has partially relieved federal backlog, but most states lack the technical staff and regulatory frameworks to process applications at the pace the Carbon Capture and Storage Market requires.

Public Opposition and Storage Liability Concerns

Community opposition to routing CO2 pipelines and to geological storage has delayed or terminated several projects in the U.S. Midwest, including high-profile ethanol-corridor pipeline ideas [20]. In Europe, moratoriums on onshore storage in Germany and the Netherlands are a reflection of the ongoing public concern over induced seismicity and long-term liability for containment. These social-license problems introduce unforeseen delays and push developers toward more expensive offshore storage alternatives in the Carbon Capture and Storage Market.


Carbon Capture and Storage Market Opportunities

Direct Air Capture Commercialization

DAC technology sits at the frontier of the Carbon Capture and Storage Market, with Climeworks and Carbon Engineering scaling modular facilities that capture CO2 directly from ambient air. The U.S. DOE's four Regional DAC Hub awards — totaling USD 3.5 billion — aim to bring per-tonne costs below USD 200 by 2030, opening a pathway to compliance-grade carbon removal credits [13].

Carbon Credit Monetization and Trading Platforms

Voluntary carbon markets reached USD 2 billion in transaction value by 2024, and verified CCS-based removal credits command premium pricing — often three to five times the price of nature-based offsets [15]. Companies that integrate capture operations with digital MRV (measurement, reporting, verification) platforms can monetize stored CO2 as a tradeable asset class, creating new revenue streams beyond regulatory compliance.

Emerging-Market Industrial Decarbonization

India’s NITI Aayog published its baseline framework in late 2022, followed by the Department of Science and Technology launching an R&D Roadmap in late 2025, and the 2026 Union Budget introducing a flagship Rs. 20,000 crore Carbon Capture Utilization and Storage development outlay . Southeast Asian refinery operators face tightening export-market emissions requirements under CBAM-adjacent schemes, creating latent demand in a region with substantial offshore storage geology.

Blue Hydrogen as Anchor Demand

Blue hydrogen production — natural gas reforming paired with CCS — provides a stable, large-volume demand anchor for capture infrastructure. The U.S. Regional Clean Hydrogen Hubs program allocated USD 7 billion across seven hubs, several of which specify CCS-equipped SMR or ATR facilities as core assets [16].

Cross-Border CO2 Transport Networks

The EU's CO2 transport infrastructure development, enabled by amendments to the London Protocol permitting cross-border CO2 shipment, unlocks shared storage resources for landlocked industrial emitters [12]. The Øresund-Kattegat-Skagerrak corridor and the Porthos project in the Netherlands illustrate how multi-country networks distribute costs and accelerate the Carbon Capture and Storage Market across smaller economies.


Carbon Capture and Storage Market Future Outlook

Digital Optimization and AI-Driven Operations

Machine learning is transforming how capture facilities operate, with real-time solvent management algorithms reducing energy penalties by 10–15% at pilot installations [3]. Predictive maintenance models trained on compressor and column sensor data cut unplanned downtime, improving annual CO2 throughput and strengthening the economic case for the Carbon Capture and Storage Market over the next decade.

Hub-and-Cluster Platform Economics

The shift from point-to-point project design toward shared transport-and-storage hubs fundamentally alters cost structures. The IEA estimates that hub models reduce per-tonne storage costs by 40–60% compared with standalone projects [11]. This platform approach transforms the Carbon Capture and Storage Market into a networked infrastructure business, attracting utilities and logistics companies alongside traditional energy players.

Electrification and Green-Blue Hydrogen Convergence

As green hydrogen costs decline toward USD 2–3 per kg by 2030, blue hydrogen producers will need to demonstrate lifecycle emission parity to compete for offtake agreements [16]. This competition drives continuous improvement in capture rates — from the current 90% benchmark toward 95–99% — and pushes the Carbon Capture and Storage Market toward higher-performance next-generation systems.

ESG Disclosure and Carbon-Removal Accounting Standards

The ISSB's S2 climate disclosure standard and the EU's CSRD mandate Scope 1 emissions reporting at the facility level, creating audit-trail requirements that favor permanent geological storage over less verifiable offset categories [15]. Companies that invest in CCS-linked digital MRV infrastructure will hold a compliance advantage as reporting requirements tighten, strengthening institutional demand for the Carbon Capture and Storage Market through 2035.


Carbon Capture and Storage Market Segmentation

By Technology

Segment Key Metric Primary Demand Driver
Pre-Combustion Capture ~76% share (2025) Hydrogen production; IGCC power plants
Post-Combustion Capture CAGR ~14.5% Retrofit flexibility for existing coal and gas plants
Oxy-Fuel Combustion Capture CAGR ~19.6% High CO2 purity; cement and glass applications


Pre-combustion capture dominates the Carbon Capture and Storage Market because gasification and reforming processes inherently produce high-concentration CO2 streams that are cheaper to separate. The technology's integration with blue hydrogen production ensures continued demand as clean hydrogen mandates proliferate across North America and Europe.

Oxy-fuel combustion capture, while currently the smallest segment by revenue, is gaining traction in cement kilns and glass furnaces where its ability to produce a nearly pure CO2 exhaust stream eliminates the need for energy-intensive solvent regeneration. Pilot projects at HeidelbergCement's Brevik plant in Norway and LafargeHolcim facilities in Europe have validated the technology at scale [18].

By End-User Industry

Segment Key Metric Primary Demand Driver
Oil and Gas ~64% share (2025) EOR applications; gas-processing separation
Coal and Biomass Power Plant USD 0.44 Billion (2025) Retrofit mandates; BECCS potential
Iron and Steel CAGR ~18% Blast-furnace emissions; EU ETS exposure
Cement CAGR ~21% Unavoidable process emissions; CBAM pressure
Chemical CAGR ~27% Ammonia and ethylene decarbonization; regulatory push


Oil and gas operators anchor the Carbon Capture and Storage Market because they combine technical familiarity with subsurface operations, existing pipeline assets, and financial scale to underwrite large projects. ExxonMobil's Baytown hub, Shell's Quest facility in Alberta, and Chevron's Gorgon project collectively capture over 9 MTPA, establishing operational benchmarks that de-risk subsequent deployments [9].

The chemical segment's projected CAGR of approximately 27% reflects tightening emissions regulations for ammonia synthesis and ethylene cracking — processes where electrification offers limited abatement potential and CCS remains the primary decarbonization lever [5].


Regional Market Share Analysis

Region Key Metric Primary Investment Themes
North America ~47% revenue share (2025) 45Q tax credits; Gulf Coast hub buildout; blue hydrogen
Europe ~24% CAGR (2026–2035) EU ETS Phase IV; Northern Lights; cross-border transport
Asia-Pacific USD 0.56 Billion (2025) Coal-fleet retrofit; offshore storage; national CCS missions
South America ~5% revenue share (2025) Pre-salt geology; oil-sector EOR-to-storage transition
Middle East & Africa CAGR ~14% (2026–2035) Gas processing capture; sovereign decarbonization funds
Total USD 2.95 Billion (2025)

The Carbon Capture and Storage Market exhibits pronounced geographic concentration, with North America and Europe collectively representing over 70% of global revenue. Regional dynamics reflect divergent policy architectures, geological endowments, and industrial emission profiles.


North America

Country Key Metric Key Driver
US ~78% of regional share 45Q credits; Class VI permitting acceleration
Canada CAGR ~16% Alberta CCUS hub; federal carbon price escalation
Mexico USD 0.04 Billion (2025) Pemex refinery modernization; emerging regulatory framework


The U.S. dominates North America's Carbon Capture and Storage Market through the convergence of 45Q incentives, state-level primacy delegations, and the Gulf Coast's unmatched pipeline and saline-aquifer infrastructure. Canada's Alberta Carbon Trunk Line and the Pathways Alliance — a consortium of six oil-sands producers targeting 22 MTPA of capture by 2030 — position the country as a global CCS leader on a per-capita basis [9][17].

Europe

Country Key Metric Key Driver
Germany ~18% of regional share Industrial decarbonization; CCS Strategy Act 2024
UK CAGR ~27% Track-1 clusters (HyNet, East Coast); revenue support mechanisms
France USD 0.05 Billion (2025) Dunkirk industrial cluster; TotalEnergies partnerships
Italy CAGR ~21% Ravenna CCS hub; Eni-led offshore storage
Spain ~4% of regional share Cement-sector pilot projects
Nordic Countries CAGR ~25% Northern Lights; Longship; bioenergy CCS
Russia USD 0.03 Billion (2025) Gazprom gas-processing capture
Rest of Europe ~8% of regional share Netherlands Porthos; Polish coal transition


Europe's Carbon Capture and Storage Market trajectory is defined by the EU ETS allowance price, which crossed EUR 90 in 2024 and underpins project-level IRR calculations across the continent. The UK's Track-1 and Track-2 cluster approach — guaranteeing transport-and-storage revenue through a regulated-asset-base model — has attracted over GBP 20 billion in announced investment [12].

Asia-Pacific

Country Key Metric Key Driver
China ~42% of regional share Coal-power retrofit; Sinopec Qilu-Shengli CCUS project
India CAGR ~22% National CCUS Mission; steel and cement mandates
Japan USD 0.08 Billion (2025) CCS Long-Term Roadmap; Tomakomai offshore storage
South Korea CAGR ~19% Donghae gas-field CO2 storage; K-CCUS Alliance
ASEAN ~6% of regional share Offshore storage potential; refinery decarbonization
Rest of Asia-Pacific CAGR ~15% Australia Gorgon CCS; Moomba project


China's Carbon Capture and Storage Market growth centers on its coal-fired fleet — the world's largest — where the NDRC's 2024 guidance mandating CCS-readiness for all new coal plants above 600 MW capacity signals regulatory intent that will accelerate retrofit demand [10]. Japan's GX Transition Bonds provide a sovereign-backed financing vehicle that reduces borrowing costs for CCS developers across the region.

South America

Country Key Metric Key Driver
Brazil ~68% of regional share Petrobras pre-salt CO2 reinjection; Santos Basin geology
Argentina CAGR ~17% Vaca Muerta gas processing; emerging CCS regulations
Rest of South America USD 0.02 Billion (2025) Early-stage policy development


Brazil's Petrobras operates one of the world's largest CO2 separation and reinjection programs at its pre-salt fields, handling over 10 MTPA — a scale that positions the company as a potential hub operator for third-party industrial CO2 in the Carbon Capture and Storage Market [14].

Middle East & Africa

Country Key Metric Key Driver
Saudi Arabia ~45% of regional share Jubail CCS facility; Saudi Aramco decarbonization strategy
UAE CAGR ~18% Al Reyadah facility expansion; Abu Dhabi CCS roadmap
South Africa USD 0.01 Billion (2025) Sasol coal-to-liquids capture potential
Egypt CAGR ~14% Gas-processing capture; Mediterranean storage assessment
Rest of MEA ~12% of regional share Early feasibility studies; World Bank technical assistance


Saudi Aramco's Jubail facility — capturing 0.8 MTPA from its ethylene glycol plant — represents the region's most advanced commercial CCS operation, while the UAE's partnership with ADNOC on expanded capture capacity signals growing Gulf state commitment to the Carbon Capture and Storage Market [16].


Carbon Capture Storage Market By Region, 2025-2035

Competitive Benchmarking

The Carbon Capture and Storage Market exhibits medium concentration, with the top five players accounting for an estimated 35–42% of global revenue. The competitive field blends major integrated energy companies with specialized technology providers and industrial-gas firms. An estimated HHI of approximately 650–850 indicates a moderately fragmented landscape where scale advantages in pipeline access and storage rights coexist with technology differentiation in capture systems.

Company Est. Revenue Share Range Key Offerings Strategic Positioning
Shell plc ~8–11% Quest CCS; Polaris project; Northern Lights JV Integrated operator with end-to-end capture-to-storage capability
ExxonMobil ~7–10% Baytown hub; LaBarge facility; low-carbon solutions division Largest announced CCS investment portfolio among supermajors
Equinor ~5–7% Northern Lights; Sleipner; Snøhvit Pioneer in offshore saline-aquifer storage
Linde plc ~4–6% Solvents and gas-separation systems; hydrogen-CCS integration Technology licensor with global EPC partnerships
Air Liquide ~3–5% Cryocap technology; industrial CO2 purification Specialty capture systems for refinery and chemical applications
Mitsubishi Heavy Industries ~3–5% KM CDR Process; modular capture units Leading post-combustion technology licensor in the Asia-Pacific
Baker Hughes ~3–4% Compact CO2 compression; subsurface monitoring Oilfield services pivot toward carbon management
Schlumberger (SLB) ~2–4% End-to-end digital CCS; storage characterization Data-driven storage site assessment and monitoring
Aker Carbon Capture ~2–3% Just Catch modular units; Brevik partnership Modular, small-to-mid-scale capture specialist
TotalEnergies ~2–3% Aramis project; Northern Lights equity stake Multi-basin storage portfolio across Europe and MEA
Fluor Corporation ~1–2% Econamine FG Plus technology; EPC services Established post-combustion solvent technology
Honeywell UOP ~1–2% CO2 Fractionation; advanced solvents Refinery and petrochemical capture integration


Recent News & Developments


  • Northern Lights JV (August 2025): Commenced commercial CO2 injection operations at its offshore facility west of Bergen, Norway, becoming Europe's first open-access CO2 transport and storage service [12].
  • U.S. EPA (November 2025): Formally granted independent Class VI Underground Injection Control (UIC) primacy to the State of Texas, accelerating storage site development across the Carbon Capture and Storage Market [19].
  • HeidelbergCement / Heidelberg Materials (December2024): Achieved mechanical completion of the Brevik full-scale CCS facility in Norway, designed to capture 400,000 tonnes of CO2 annually from cement production [18].
  • Chevron (November 2023): Expanded the Gorgon CCS project in Western Australia with additional injection well capacity, targeting 4.0 MTPA to meet revised regulatory capture obligations [10].


Carbon Capture and Storage Market Report Scope

Parameter Detail
Market Scope Global Carbon Capture and Storage Market by Technology, End-User Industry, and Region
Study Period 2021–2035
CAGR 12.6% (2026–2035)
Base Year Market Size USD 2.95 Billion (2025)
Forecast Endpoint USD 9.81 Billion (2035)
Fastest Growing Segment (Technology) Oxy-Fuel Combustion Capture
Fastest Growing Segment (End-User) Chemical
Companies Profiled 12
Valuation Currency USD Billion


FAQs

What minimum CO2 purity levels do geological storage operators typically require?

Most saline-aquifer operators specify ≥95% CO2 purity to prevent corrosion in injection wells and minimize non-condensable gas handling. Depleted hydrocarbon reservoirs may accept 90–93% purity depending on residual gas composition [3].

How do CCS project developers typically structure long-term storage liability transfer?

Developers negotiate a post-closure transfer period — generally 10–20 years of monitoring — after which liability shifts to the host government. The EU CCS Directive and select U.S. state frameworks codify these transfer timelines [19].

What role does CO2 utilization play in improving capture-project economics?

Utilization pathways such as building-materials carbonation and synthetic fuels provide supplementary revenue but rarely exceed 5–10% of total captured volumes. Storage remains the primary disposition route for the Carbon Capture and Storage Market [6].

How do modular capture units compare to integrated mega-projects on cost per tonne?

Modular systems like Aker's Just Catch achieve USD 60–80 per tonne at capacities under 100,000 TPA. Integrated facilities targeting 1+ MTPA can reach USD 40–55 per tonne through scale economies [3].

What insurance products cover CO2 leakage risk during transport and injection?

Specialty insurers now offer well-integrity and subsurface-containment policies with annual premiums of 1–3% of project capital. Lloyd's syndicates and Munich Re have led product development in this space [20].

How does CCS financing differ between tax-equity structures and project-finance debt?

U.S. projects increasingly use tax-equity partnerships to monetize 45Q credits, while European developers rely on contract-for-difference revenue supports that enable conventional project-finance lending [2][12].

What monitoring technologies verify long-term CO2 containment underground?

Operators deploy seismic surveys, downhole pressure sensors, and surface-flux monitoring arrays. Satellite-based InSAR measurements detect millimeter-scale ground deformation indicative of plume migration [7].


Author
Author
Author Profile
Chitranshi Jaiswal LinkedIn
Team Lead - Research
Chitranshi is a Team Leader in the Chemicals & Materials (CnM) and Energy & Power (EnP) domains, with 6+ years of experience in market research. She leads and mentors teams to deliver cross-domain projects that equip clients with actionable insights and growth strategies. She is skilled in market estimation, forecasting, competitive benchmarking, and both primary & secondary research, enabling her to turn complex data into decision-ready insights. An engineer and MBA professional, she combines technical expertise with strategic acumen to solve dynamic market challenges. Chitranshi has successfully managed projects that support market entry, investment planning, and competitive positioning, while building strong client relationships. Certified in Advanced Excel & Power BI she leverages data-driven approaches to ensure accuracy, clarity, and impactful outcomes.

Research Approach


Secondary Research

The secondary research process involved comprehensive analysis of environmental regulatory databases, peer-reviewed energy journals, technical engineering publications, and authoritative climate organizations. Key sources included the US Environmental Protection Agency (EPA), US Department of Energy (DOE), International Energy Agency (IEA), Global CCS Institute (GCCSI), Intergovernmental Panel on Climate Change (IPCC), European Commission Directorate-General for Climate Action, European Environment Agency (EEA), International Association of Oil & Gas Producers (IOGP), Carbon Capture Coalition, World Business Council for Sustainable Development (WBCSD), International Journal of Greenhouse Gas Control, Energy & Environmental Science Journal, National Center for Biotechnology Information (NCBI/PubMed) for environmental health studies, World Bank Carbon Pricing Dashboard, OECD Environment Statistics, and national energy ministry reports from key markets including Norway, UK, Canada, Australia, China, and Japan. These sources were used to collect carbon pricing data, CCS project pipeline statistics, storage capacity assessments, regulatory policy frameworks, emission reduction targets, and technology cost curves for post-combustion capture, pre-combustion systems, direct air capture, bioenergy with carbon capture and storage (BECCS), and enhanced oil recovery (EOR) applications.


Primary Research

To gather both qualitative and quantitative insights, supply-side and demand-side stakeholders were interviewed during the primary research phase. Commercial leads from oil and gas majors, industrial gas providers, technology licensors, and engineering procurement construction (EPC) firms were among the supply-side sources, along with CEOs, CTOs of Carbon Capture Technologies, Heads of CCS Project Development, and regulatory affairs directors. Demand-side sources included procurement leads from energy-intensive sectors implementing CCS solutions, process engineers from chemical refineries, facility directors from power generation utilities, plant managers from cement and steel production, and carbon storage site operators. Primary study verified CO₂ storage site development pipelines, validated technology adoption timetables, and collected information on project funding methods, 45Q tax credit utilization, and carbon credit monetization tactics.

Primary Respondent Breakdown:

By Designation: C-level Primaries (28%), Director Level (42%), Others (30%)

By Region: North America (32%), Europe (35%), Asia-Pacific (25%), Rest of World (8%)


Market Size Estimation

Global market valuation was derived through project pipeline valuation and capture capacity analysis. The methodology included:

Identification of 60+ key technology providers and project developers across North America, Europe, Asia-Pacific, and Middle East

Technology mapping across post-combustion capture, pre-combustion capture, oxy-fuel combustion, direct air capture, BECCS, and geological storage methods

Analysis of announced and under-construction project capacities with associated capital expenditure (CAPEX) and operational expenditure (OPEX) modeling

Coverage of developers and operators representing 75-80% of global operational and under-development CCS capacity in 2024

Extrapolation using bottom-up (cumulative capture capacity × unit cost by technology type and region) and top-down (major player revenue validation and government funding allocation analysis) approaches to derive segment-specific valuations for capture equipment, transportation infrastructure, and storage site development

Download Free Sample

Kindly complete the form below to receive a free sample of this Report

Download PDF ×

We do not share your information with anyone. However, we may send you emails based on your report interest from time to time. You may contact us at any time to opt-out.