Cell Counting Market (2026 - 2035)

Cell Counting Market Research Report: Size, Share, Trend Analysis By Product (Consumables, Instruments) By Applications (Research Application, Clinical & Diagnostic Applications, Others) By End-User (Pharmaceutical & Biotechnology Companies, Hospitals, Research Institutes, Others) Forecast till 2035

Forecast Period
2026-2035
CAGR
6.9%
2025 Market Size
USD 10.78 Billion
2035 Market Size
USD 21.00 Billion
Healthcare ● Updated August 26, 2026 Report ID: MRFR/HC/7128-HCR | Pages: 125 | Author: Vikita Thakur, Kinjoll Dey

Cell Counting Market Summary

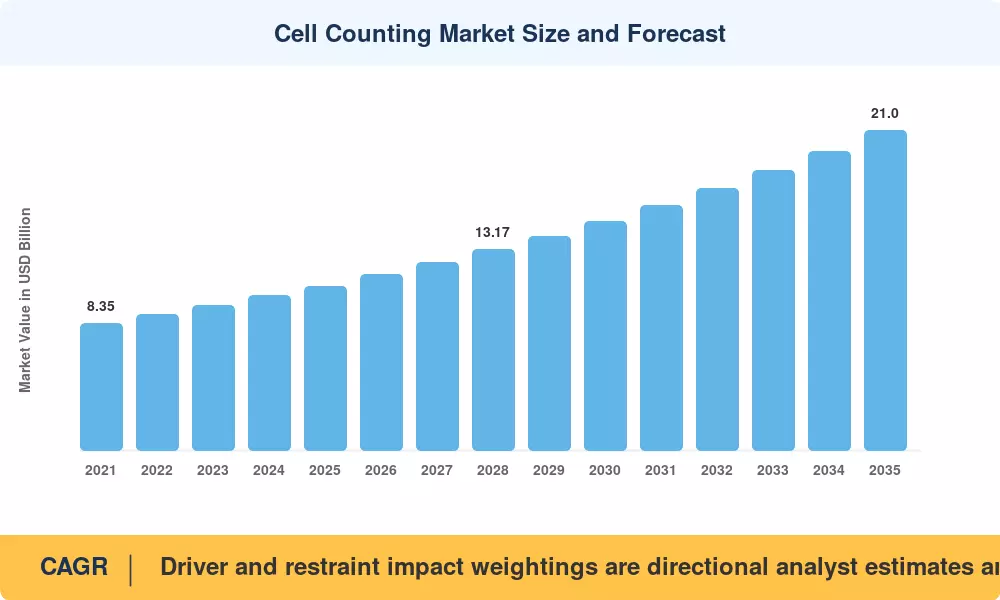
The Cell Counting Market reached USD 10.78 billion in 2025 and opens the forecast window at USD 11.52 billion in 2026, climbing to USD 21.00 billion by 2035 at a 6.9% CAGR. Two catalysts explain most of that trajectory. The first is the sustained expansion of the U.S. National Institutes of Health extramural research budget, which crossed USD 47 billion in FY2024 and funds the academic labs that buy counting instruments in volume [1]. The second is the cell and gene therapy pipeline — more than 2,000 active clinical programs worldwide — where every batch release requires documented viable-cell enumeration [2].

Labs are ditching a workflow that hasn't altered for a century. Counting in a manual glass chamber under a microscope is slow and analyst-dependent, but is being replaced by image cytometers, impedance analyzers and tabletop platforms that log results directly into laboratory information systems. Method-comparison studies frequently report 40-60% coefficient-of-variation improvements over manual approaches [3]. Capital follows: venture and strategic investment into life-science instrumentation exceeded USD 8.4 billion in 2024 [4].


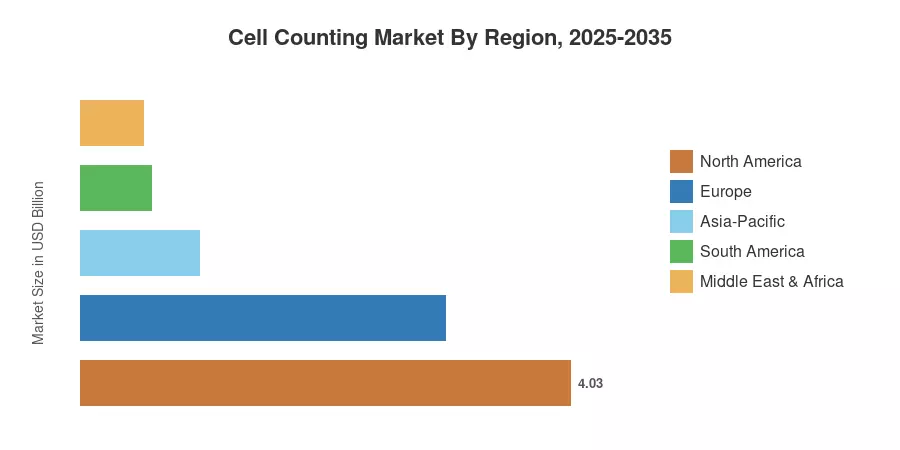
Reimbursement-backed dense biopharma clusters and hospital diagnostics drive North America to secure 37.4% of the Cell Counting Market revenue in 2025. Asia-Pacific increases fastest at 9.1% CAGR through 2035 as China and India expand domestic biologics manufacturing. Europe is second to North America, driven by Horizon Europe research funding and IVDR-led replacement of instruments. After 2030, the margin between the top two regions is likely to close considerably.


Key Report Takeaways

• By Technology

  • Flow cytometry commands 38.9% of the Cell Counting Market by technology revenue, the single largest block.
  • Image-based and microscopy analysis platforms post the fastest technology CAGR at 8.6% through 2035
  • Impedance and Coulter-principle systems generated USD 2.02 billion in 2025

• By Sector

  • Research applications — cancer, stem cell and drug discovery work — account for 44.8% of demand
  • Clinical and diagnostic use contributed USD 3.61 billion in 2025
  • Bioprocessing and quality control is the fastest-expanding application at 9.4% CAGR

• By Geography

  • North America leads the Cell Counting Market with 37.4% revenue share
  • Asia-Pacific compounds at 9.1% CAGR, the highest of any region
  • Europe generated USD 3.00 billion in 2025


Market Size and Forecast (2021–2035)

Figures below include instrument shipment data from customs and trade databases, consumables income stated in vendor segment reporting and bottom-up modeling of installed base by laboratory type. Historical numbers were reconciled to audited annual reports; projection years use the calibrated 6.9% growth rate to the 2026 base of the Cell Counting Market.
Cell Counting Market Size and Forecast
Our Impact
Enabled $4.3B Revenue Impact for Fortune 500 and Leading Multinationals
Partnering with 2000+ Global Organizations Each Year
30K+ Citations by Top-Tier Firms in the Industry

Driver Impact Analysis

Driver ~% Impact on CAGR Geographic Relevance Impact Timeline
Cell and gene therapy batch release testing 1.6 Global Medium-term (2–4 yr)
Public research funding expansion 1.3 North America, Europe Short-term (≤2 yr)
Automation replacing manual chamber counts. 1.2 Global Medium-term (2–4 yr)
Biosimilar and biologics manufacturing scale-up 1.0 Asia-Pacific Long-term (≥4 yr)
Hospital laboratory consolidation and throughput pressure 0.8 North America, Europe Short-term (≤2 yr)
AI-enabled image analysis and software licensing 0.7 Global Long-term (≥4 yr)
Consumables attach rates on installed instruments. 0.6 Global Medium-term (2–4 yr)


Cell and Gene Therapy Release Testing

Every autologous CAR-T batch requires viable-cell quantification at multiple process checkpoints, and the FDA's 2024 guidance on potency assurance for cell and gene therapy products makes that documentation explicit [2]. With more than 2,000 programs in clinical development and roughly 40 commercial approvals globally, testing volume scales with pipeline breadth rather than approval count. Manufacturers running closed, single-use workflows now specify counting instruments at the process-design stage — a procurement shift that converts a laboratory purchase into an embedded platform decision worth USD 250,000 to USD 900,000 per suite.

Research Funding and Instrument Refresh

Grant money buys instruments. NIH extramural awards exceeded USD 47 billion in FY2024, and Horizon Europe committed EUR 95.5 billion across its 2021–2027 term, with health cluster allocations funding core facility upgrades [1][7]. Academic core labs typically refresh counting hardware on seven-to-nine-year cycles, meaning equipment purchased during the 2016–2018 funding surge is now due. Sustained appropriations therefore translate into a visible replacement wave through 2028.

Automation Displacing Manual Methods

Throughput economics settle this argument. A technologist performing manual counts processes roughly 12 samples per hour with inter-operator variability that method-comparison studies place between 15% and 25%; benchtop automated cell counter devices handle the same load in under 20 minutes with coefficients of variation below 5% [3]. Labor cost inflation in clinical laboratories — U.S. medical technologist wages rose 4.8% in 2024 — shortens payback periods to under 18 months for high-volume sites [11].

Asia-Pacific Manufacturing Build-Out

Policy is doing the heavy lifting. China's 14th Five-Year Plan for biopharmaceutical development and India's Production Linked Incentive scheme for pharmaceuticals, worth INR 15,000 crore, have both funded new biologics capacity that requires in-process analytics [8]. Domestic instrument manufacturers are capturing tender share at 20–35% price discounts to Western incumbents, expanding unit volumes even where average selling prices compress.


Restraints Impact Analysis

Restraint weightings reflect estimated drag on growth momentum under current conditions. They are directional indicators, not subtractive inputs to the headline CAGR.

Restraint ~% Impact on CAGR Geographic Relevance Impact Timeline
High capital cost of advanced cytometry platforms −0.9 Emerging economies Short-term (≤2 yr)
Method validation and regulatory qualification burden −0.7 Europe, North America Medium-term (2–4 yr)
Persistence of low-cost manual counting in small labs −0.6 Asia-Pacific, Africa Long-term (≥4 yr)
Skilled cytometry operator shortage −0.5 Global Medium-term (2–4 yr)
Reagent supply chain and cold-chain fragility −0.4 Global Short-term (≤2 yr)


Capital Intensity Blocks Mid-Tier Adoption

Spectral flow cytometers list between USD 300,000 and USD 650,000 before service contracts, and annual maintenance typically adds 8–12% of list price [13]. Hospital laboratories in middle-income markets operate on capital budgets that rarely clear USD 100,000 per department per year. The result is a two-tier market: well-capitalized reference labs buy platforms while district hospitals defer, keeping penetration in South Asia and Sub-Saharan Africa below 20% of addressable sites.

Validation Overhead Slows Switching

Regulation adds friction even when the technology is better. Under the EU In Vitro Diagnostic Regulation, laboratories replacing an established method must document analytical performance across precision, linearity and comparability, following CLSI EP05 and EP09 protocols [14]. Conformity assessment backlogs have pushed notified body review times past 13 months for some device classes [7]. Laboratories facing that timeline often postpone upgrades to the next accreditation cycle.

Manual Methods Remain Economically Rational

Cost per test is unforgiving at low volumes. A reusable counting chamber costs under USD 200 and lasts years, while an automated platform's disposable slides run USD 2.50 to USD 6.00 per sample [15]. Below roughly 25 samples per day, manual workflows still win on unit economics — which is precisely the profile of the small clinics that make up the majority of laboratory sites across emerging economies.


Cell Counting Market Opportunities

Closed-System Counting for Cell Therapy Manufacturing

Sterility requirements are rewriting instrument design. Manufacturers that integrate aseptic sampling ports and single-use fluidics into counting platforms can command 25–40% price premiums over open-system equivalents [2]. The addressable base is narrow but growing fast, with more than 200 GMP cell therapy facilities commissioned or expanded since 2022.

AI-Assisted Morphology and Software Licensing

Counting is becoming classification. Deep-learning models trained on labelled cell images now discriminate apoptotic, necrotic and viable populations with reported concordance above 92% against expert review [12]. Vendors that unbundle this capability as an annual software licence convert a one-time hardware sale into recurring revenue — a margin structure closer to software than instrumentation.

Emerging-Market Tender Penetration

Public procurement is the door into Asia, Latin America and Africa. India's Ayushman Bharat Health and Wellness Centre programme and Brazil's SUS laboratory network both run centralized tenders that favour ruggedized, low-consumable-cost designs [8][15]. Suppliers offering local service coverage and instrument financing are winning contracts that pure-play exporters lose on total cost.

Data Monetization Through Connected Fleets

Every networked instrument generates a usage stream. Reagent auto-replenishment, predictive maintenance and benchmarking dashboards let vendors monetize the installed base beyond the initial sale, with connected-fleet service attach rates running 18–24 percentage points higher than for offline units [9]. Laboratory customers accept the data exchange when it reduces unplanned downtime.

Point-of-Care Hematology Screening

Decentralization opens a new channel. Compact analyzers performing hematology blood cell counting at pharmacies, oncology infusion suites and rural clinics address a volume pool that central labs never captured and WHO essential diagnostics guidance now lists complete blood count among priority tests for primary care [11][17].


Cell Counting Market Future Outlook

Autonomous Laboratory Workflows

Robotics will absorb the counting step entirely. Integrated liquid handlers that aspirate, stain, load and count without human intervention are already deployed in high-throughput screening, and analysts expect autonomous sample-handling to touch 30% of pharmaceutical discovery workflows by 2032 [12]. Instruments that lack open API and scheduler compatibility will be designed out of these systems.

Consumables-Led Platform Economics

Razor-and-blade economics are tightening their grip on the Cell Counting Market. Consumables already contribute 41.4% of revenue, and vendors are engineering proprietary slide and cartridge formats that lock recurring spend to the installed base [9]. Expect procurement teams to push back with open-consumable clauses in multi-year agreements.

Single-Cell Analysis Convergence

Boundaries between counting and characterization are dissolving. Single-cell sequencing sample preparation requires accurate input quantification, and the single-cell analysis field has drawn more than USD 3.2 billion in cumulative venture funding since 2020 [4]. Counting instruments are increasingly sold as front-end modules within multi-omics workflows rather than as standalone devices.

Sustainability and Reagent Circularity

Environmental reporting has reached the laboratory bench. My Green Lab certification and EU Corporate Sustainability Reporting Directive disclosures are pushing institutions to quantify single-use plastic consumption, and disposable counting slides are a visible line item [20]. Vendors offering recyclable cartridges or reusable-chamber hybrids will gain an edge in European tenders across the Cell Counting Market.

 

Cell Counting Market Segmentation

By Product Type

Instruments and consumables split the Cell Counting Market on roughly a 59:41 basis, though the ratio shifts as installed bases mature.

Segment Metric Primary Demand Driver
Instruments – Flow Cytometers 22.6% share Multiparameter immunophenotyping demand
Instruments – Spectrophotometers USD 1.28 billion Routine concentration and viability checks
Instruments – Cell Counters & Analyzers 7.4% CAGR Benchtop automation in mid-tier labs
Instruments – Hemocytometers & Slides 4.9% share Low-volume and teaching laboratory use
Instruments – Microscopes & Imaging Systems USD 0.60 billion Morphology-linked counting applications
Consumables (Reagents, Kits, Accessories) 41.4% share Recurring per-test spend on installed base


Flow cytometers hold the largest instrument block because no competing technology matches their ability to resolve a dozen or more markers simultaneously. Spectral detection has extended that lead, with panel sizes above 40 colours now commercially routine [10]. Consumables, meanwhile, deliver the steadier revenue line — reagent and slide sales grow with utilization rather than with capital cycles, which is why vendors increasingly report them as a separate segment.

By Application

Segment Metric Primary Demand Driver
Research (Cancer, Stem Cell, Drug Discovery) 44.8% share Public and philanthropic grant funding
Clinical & Diagnostic USD 3.61 billion Complete blood count and oncology monitoring
Bioprocessing & Quality Control 9.4% CAGR Biologics and cell therapy batch release
Other Applications 7.5% share Food safety, environmental and veterinary testing


Research remains the volume anchor of the Cell Counting Market, but bioprocessing is where growth concentrates. Batch release testing is non-discretionary, GMP-qualified and priced accordingly — instruments sold into manufacturing suites carry service contracts averaging 12–15% of capital value annually versus 8% in academic settings [9].

By End User

Segment Metric Primary Demand Driver
Hospitals & Clinical Laboratories 34.7% share Reimbursed diagnostic test volume
Pharmaceutical & Biotechnology Companies USD 3.16 billion Pipeline breadth and GMP requirements
Academic & Research Institutes 8.1% CAGR Core facility instrument refresh cycles
Other End Users 9.9% share CROs, blood banks, forensic laboratories


By Technology

Segment Metric Primary Demand Driver
Flow Cytometry 38.9% share Multiparameter clinical and research assays
Spectrophotometry USD 2.41 billion Rapid, low-cost concentration measurement
Impedance / Coulter Principle 18.7% share High-throughput hematology enumeration
Image-Based / Microscopy Analysis 8.6% CAGR Viability, morphology and AI classification
Other Technologies 5.4% share Acoustic, dielectrophoretic and hybrid methods


Regional Market Share Analysis

Region Metric (2025 unless noted) Primary Investment Themes
North America 37.4% share Cell therapy release testing, hospital lab automation
Europe USD 3.00 billion IVDR-driven replacement, academic core facilities
Asia-Pacific 9.1% CAGR (2026–2035) Biologics capacity, domestic instrument manufacturing
South America 5.4% share Public health laboratory modernization
Middle East & Africa USD 0.52 billion Sovereign healthcare programmes, oncology centres
Total USD 10.78 billion


North America

Country Metric Key Driver
US 82.4% of region NIH funding density and CAR-T manufacturing base
Canada USD 0.46 billion Provincial lab consolidation and stem cell research
Mexico 7.2% CAGR Contract manufacturing expansion near-shoring


Regulatory clarity gives the United States its lead in the Cell Counting Market. FDA clearance pathways for hematology analyzers are well-trodden, and the agency cleared over 40 hematology-related devices between 2022 and 2024 [17]. Canadian demand is narrower but concentrated in Toronto and Vancouver research corridors funded through the Canada Foundation for Innovation. Mexico's growth comes from contract manufacturers building analytical capability alongside fill-finish capacity.

Europe

Country Metric Key Driver
Germany 23.1% of region Biopharma cluster density and Fraunhofer institutes
UK USD 0.55 billion Cell and gene therapy Catapult network
France 14.6% of region INSERM research infrastructure investment
Italy 6.8% CAGR Hospital diagnostics modernization funds
Spain 7.8% of region Regional oncology centre expansion
Nordic Countries USD 0.24 billion Precision medicine biobanking programmes
Russia 5.3% of region Domestic diagnostics substitution policy
Rest of Europe 12.5% of region EU cohesion-funded laboratory upgrades


Compliance deadlines shape European purchasing more than innovation does. IVDR transition provisions extended Class C device deadlines to December 2028, and laboratories are timing instrument refreshes to that calendar [7]. Germany's position rests on a manufacturing base that pairs instrument vendors with the biopharma customers next door.

Asia-Pacific

Country Metric Key Driver
China 31.6% of region Domestic biologics capacity and tender volume
India 10.4% CAGR PLI scheme and diagnostic chain expansion
Japan 21.4% of region Regenerative medicine regulatory framework
South Korea USD 0.27 billion Biosimilar manufacturing concentration
ASEAN 9.8% of region Public hospital laboratory upgrades
Rest of Asia-Pacific 8.4% CAGR Contract research organization growth


Speed of approval is Japan's structural advantage — its conditional approval pathway for regenerative medicine products, in force since 2014, pulled cell therapy developers into the country early and built analytical demand alongside them [18]. China's volume-based procurement has compressed instrument pricing 15–30% while multiplying unit shipments, a trade that favours domestic manufacturers within the Cell Counting Market.

South America

Country Metric Key Driver
Brazil 54.7% of region SUS network and Fiocruz research capacity
Argentina USD 0.12 billion Biotechnology sector and university labs
Rest of South America 24.0% of region Chilean and Colombian oncology investment


Currency volatility governs the purchasing rhythm here. Brazilian public laboratories procure through multi-year federal tenders that bundle instruments with consumables, insulating buyers from exchange-rate swings but lengthening sales cycles to 14–20 months [15]. Argentine demand skews toward research institutions with international grant funding.

Middle East & Africa

Country Metric Key Driver
Saudi Arabia 26.4% of region Vision 2030 healthcare sector transformation
UAE USD 0.10 billion Medical tourism and private hospital investment
South Africa 22.1% of region National Health Laboratory Service network
Egypt 9.8% CAGR Hepatitis and oncology screening programmes
Rest of MEA 19.5% of region Donor-funded diagnostic capacity building


Sovereign programmes carry this region. Saudi Arabia's Health Sector Transformation Programme committed SAR 15 billion to laboratory and diagnostic infrastructure through 2030, and new oncology centres in Riyadh and Jeddah specify cytometry capability at build [19]. South Africa's centralized NHLS procurement gives suppliers scale but demands aggressive service-level commitments.


Cell Counting Market By Region, 2025-2035

Competitive Benchmarking

Concentration in the intermediate band. Estimated HHI is between 750 and 900, with the top five suppliers accounting for between 48–56% of global revenue, enough scale to influence pricing, but not enough to preclude entry. Specialist entrants continue to win share in image-based counting and closed-system cell therapy applications where incumbents are sluggish to move.

Company Est. Revenue Share Range Key Offerings for Cell Counting Market Strategic Positioning
Thermo Fisher Scientific ~12–15% Attune cytometers, Countess counters, reagents Breadth leader with deep consumables attach
Danaher (Beckman Coulter Life Sciences) ~11–14% CytoFLEX platforms, Vi-CELL analyzers, Coulter counters Bioprocessing and clinical dual franchise
Becton, Dickinson and Company ~9–12% FACS analyzers and sorters, clinical reagents Clinical cytometry installed-base strength
Sysmex Corporation ~7–10% XN and XR hematology analyzer series Hematology automation and lab middleware
Merck KGaA ~6–8% Scepter counters, Muse analyzers, media Reagent-led pull-through model
Bio-Rad Laboratories ~5–7% TC automated counters, ZE5 cytometers Value-tier academic and QC positioning
Agilent Technologies ~4–6% NovoCyte cytometers, cell analysis assays Cell-analysis workflow integration
Revvity ~3–5% Cellaca and Cellometer image cytometers Image-based counting specialist
Sartorius AG ~3–5% Incucyte live-cell systems, bioprocess analytics Upstream bioprocessing alignment
Corning Incorporated ~2–4% Counting chambers, slides, culture consumables Consumables and labware breadth
Olympus / Evident Corporation ~1–3% Microscopy-based counting and imaging systems Optics heritage in morphology workflows
Logos Biosystems ~1–3% LUNA automated counters and slides Price-competitive benchtop challenger


Recent News & Developments

  • Revvity (May 2023): PerkinElmer's life sciences and diagnostics business relaunched as Revvity, sharpening focus on cell analysis and consolidating the Nexcelom image-cytometry portfolio under one brand [21].
  • Sartorius (July 2023): Completed its acquisition of Polyplus for approximately EUR 2.4 billion, extending upstream reach into cell and gene therapy workflows that pair with live-cell analytics [22].
  • Danaher (December 2023): Closed the USD 5.7 billion Abcam acquisition, adding validated antibody and reagent depth that supports cytometry panel design [23].
  • Becton Dickinson (2023–2024): Rolled out its FACSDiscover imaging-enabled cell sorting and analysis line, bringing spatial and morphological data into conventional cytometry runs [24].
  • Thermo Fisher Scientific (July 2024): Completed the USD 3.1 billion Olink acquisition, strengthening the proteomics adjacency that increasingly bundles with cell quantification workflows [25].
  • Sysmex (2023–2024): Expanded FDA-cleared XR-Series hematology analyzer availability in the U.S., targeting mid-to-high volume hospital laboratories seeking consolidated automation [17].
  • European Commission (July 2024): Confirmed extended IVDR transition timelines for legacy devices, giving laboratories a defined replacement runway to December 2028 [7].
  • Indian Government (2024): Advanced Production Linked Incentive disbursements for pharmaceutical and medical device manufacturing, supporting domestic analytical instrument capacity [8].


Cell Counting Market Report Scope

Parameter Detail
Market Scope Instruments and consumables for cell quantification across research, clinical, diagnostic and bioprocessing applications, worldwide
Study Period 2021–2035 (Historical 2021–2024; Base Year 2025; Forecast 2026–2035)
CAGR 6.9% (2026–2035)
Market Size Checkpoints USD 10.78 billion (2025); USD 11.52 billion (2026); USD 21.00 billion (2035)
Fastest Growing Segments Bioprocessing & Quality Control (application); Image-Based / Microscopy Analysis (technology); Asia-Pacific (region)
Companies Profiled Thermo Fisher Scientific, Danaher, Becton Dickinson, Sysmex, Merck KGaA, Bio-Rad, Agilent, Revvity, Sartorius, Corning, Evident, Logos Biosystems
Valuation Currency USD, at 2025 constant exchange rates
CAGR Driver Disclaimer Driver and restraint impact weightings are directional analyst estimates and are not additive to the headline growth rate.

FAQs

How should laboratory buyers evaluate total cost of ownership in the Cell Counting Market?
Consumables and service contracts usually outweigh instrument capital across a five-year horizon. Request per-test reagent pricing and guaranteed uptime terms before comparing list prices [9].
What validation burden applies when replacing manual counts with automated platforms?
Regulated laboratories must demonstrate precision, linearity and method comparability against the incumbent procedure under CLSI EP05 and EP09. Budget six to twelve weeks for parallel testing and analyst retraining [14].
Which integration challenges most often delay deployment in the Cell Counting Market?
LIS and LIMS middleware mismatches cause most delays, followed by audit-trail gaps under 21 CFR Part 11. Confirm bidirectional connectivity and electronic-signature support during vendor qualification, not after purchase [17].
Is image-based counting better than impedance for viability work?
Image-based systems resolve dye-exclusion viability and morphology that impedance cannot capture. Impedance stays faster and cheaper for high-throughput enumeration where viability is not the endpoint [12].
How do reagent lock-ins shape competitive dynamics in the Cell Counting Market?
Proprietary slides and cartridges create switching costs that protect installed bases and lift vendor margins. Buyers signing multi-year contracts should demand open-consumable clauses or capped annual price escalation [9].
Which emerging use cases are attracting the most investor attention?
Cell therapy release testing, organoid and 3D culture quantification, and decentralized point-of-care screening lead the list. Each requires closed-system workflows and regulatory-grade data traceability [4].
Do procurement teams in emerging economies face different service risks?
Yes — field-service coverage and spare-part lead times drive downtime more than instrument reliability does. Require documented in-country engineer availability and loaner-unit provisions in tender specifications [15].    
Author
Author
Author Profile
Vikita Thakur LinkedIn
Senior Research Analyst
She holds an experience of about 5+ years in market research and business consulting projects for sectors such as life sciences, medical devices, and healthcare IT. She possesses a robust background in data analysis, market estimation, competitive intelligence, pipeline analysis market trend identification, and consumer behavior insights. Her expertise lies in technical Sales support, client interaction and project management, designing and implementing market research studies, conducting competitive analysis, and synthesizing complex data into actionable recommendations that drive business growth.
Co-Author
Co-Author Profile
Kinjoll Dey LinkedIn
Senior Research Analyst
He is an extremely curious individual currently working in Healthcare and Medical Devices Domain. Kinjoll is comfortably versed in data centric research backed by healthcare educational background. He leverages extensive data mining and analytics tools such as Primary and Secondary Research, Statistical Analysis, Machine Learning, Data Modelling. His key role also involves Technical Sales Support, Client Interaction and Project management within the Healthcare team. Lastly, he showcases extensive affinity towards learning new skills and remain fascinated in implementing them.
Share::
Request Free Sample

Research Approach


Secondary Research

The secondary research process involved comprehensive analysis of regulatory databases, peer-reviewed biomedical journals, clinical publications, and authoritative life sciences organizations. Key sources included the US Food & Drug Administration (FDA) 510(k) clearances and PMA database for hematology analyzers and flow cytometry devices, European Medicines Agency (EMA) regulatory filings for cell counting consumables, International Society for Cellular Therapy (ISCT), International Society for Stem Cell Research (ISSCR), American Association for Cancer Research (AACR), American Society of Hematology (ASH), National Institutes of Health (NIH) Stem Cell Research funding database, National Center for Biotechnology Information (NCBI/PubMed) for clinical validation studies, Centers for Disease Control and Prevention (CDC) National Center for Health Statistics for blood disorder prevalence and cancer incidence rates, World Health Organization (WHO) Global Cancer Observatory and Global Health Observatory for infectious disease diagnostics data, Organisation for Economic Co-operation and Development (OECD) Health Statistics, European Commission Horizon Europe funding database for biotechnology research, Biotechnology Innovation Organization (BIO) industry reports, and national health ministry reports from key markets (US Department of Health and Human Services, China National Health Commission, Japan Ministry of Health, Labour and Welfare). These sources were used to collect instrument installation statistics, regulatory approval data, clinical validation studies, funding allocation trends, and market landscape analysis for automated hematology analyzers, flow cytometers, spectrophotometers, and associated consumables (reagents, assay kits, microplates).


Primary Research

To gather both qualitative and quantitative insights, supply-side and demand-side stakeholders were interviewed during the primary research phase. CEOs, VPs of research and development, heads of regulatory affairs, and commercial directors from companies that make cell counting devices, reagents, and life sciences technologies were examples of supply-side sources. Demand-side sources included principal investigators in stem cell research, chief hemopathologists, laboratory directors, bioprocessing managers from biotechnology and pharmaceutical companies, procurement leads from reference labs and hospitals, and research scientists from academic medical centers and CROs. In addition to verifying regulatory pipeline timelines and gathering information on clinical adoption patterns, pricing strategies for high-throughput systems, and reimbursement dynamics for diagnostic applications, primary research validated product segmentation across consumables (reagents, assay kits, microplates) and instruments (hematology analyzers, flow cytometers, automated cell counters, and spectrophotometers).

Primary Respondent Breakdown:

By Designation: C-level Primaries (32%), Director Level (30%), Others (38%)

By Region: North America (32%), Europe (30%), Asia-Pacific (28%), Rest of World (10%)


Market Size Estimation

Global market valuation was derived through revenue mapping and instrument installation base analysis. The methodology included:

Identification of 50+ key manufacturers across North America, Europe, Asia-Pacific, and Latin America specializing in hematology analyzers, flow cytometry systems, automated cell counters, and associated reagents/consumables

Product mapping across automated cell counters, spectrophotometers, flow cytometers, hematology analyzers, and consumable categories (reagents, assay kits, microplates)

Analysis of reported and modeled annual revenues specific to cell counting instrument portfolios and recurring consumable sales

Coverage of manufacturers representing 75-80% of global market share in 2024

Extrapolation using bottom-up (installed base × service contract value + consumable throughput by country) and top-down (manufacturer revenue validation) approaches to derive segment-specific valuations for research applications (stem cell research, drug discovery), clinical & diagnostic applications (oncology, hematology, infectious disease), and industrial applications (bioprocessing, quality control)

Share::
Request Free Sample
Download Free Sample

Kindly complete the form below to receive a free sample of this Report

* Please use a valid business email

Share::
Request Free Sample
Download PDF ×

We do not share your information with anyone. However, we may send you emails based on your report interest from time to time. You may contact us at any time to opt-out.














