Clinical Trial Support Services Market (2026 - 2035)

Global Clinical Trial Support Services Market Research Report: Size, Share, Trend Analysis By Service (Clinical Trial Site Management, Patient Recruitment Management [Patient recruitment & registry services, Patient retention, Others], Data Management, Administrative staff, IRB, Others), By Phase (Phase I, Phase II, Phase III, Phase IV), By Sponsor (Pharmaceutical & Biopharmaceutical, Medical Devices, Others), And By Region (North America, Europe, Asia-Pacific, And Rest Of The World) - Growth Outlook & Industry Forecast 2025 To 2035

Forecast Period
2026-2035
CAGR
7.4%
2025 Market Size
USD 29.91 Billion
2035 Market Size
USD 61.07 Billion
Healthcare Services ● Updated August 24, 2026 Report ID: MRFR/HS/20402-HCR | Pages: 128 | Author: Nidhi Mandole, Rahul Gotadki

Clinical Trial Support Services Market Summary

The Clinical Trial Support Services Market reached USD 29.91 Billion in 2025 and opens the forecast window at USD 32.12 Billion in 2026, climbing to USD 61.07 Billion by 2035 at a 7.4% CAGR. Two catalysts anchor that trajectory. The U.S. FDA's 2023 guidance on decentralized trial conduct pushed sponsors to re-engineer site models rather than patch them [1], while the EU Clinical Trials Regulation 536/2014 completed its transition in January 2025, forcing every active European protocol onto the Clinical Trials Information System [2]. Both changes convert compliance work into billable external scope, and the Clinical Trial Support Services Market absorbs most of it.

Paper source documents, siloed EDC instances, and manual query resolution are giving way to unified eClinical stacks with risk-based monitoring layered on top. Sponsors spent an estimated USD 4.6 Billion on clinical technology platforms in 2024, roughly a fifth of it on data and safety modules [4]. That shift is why clinical operations outsourcing now spans design through submission rather than monitoring alone.

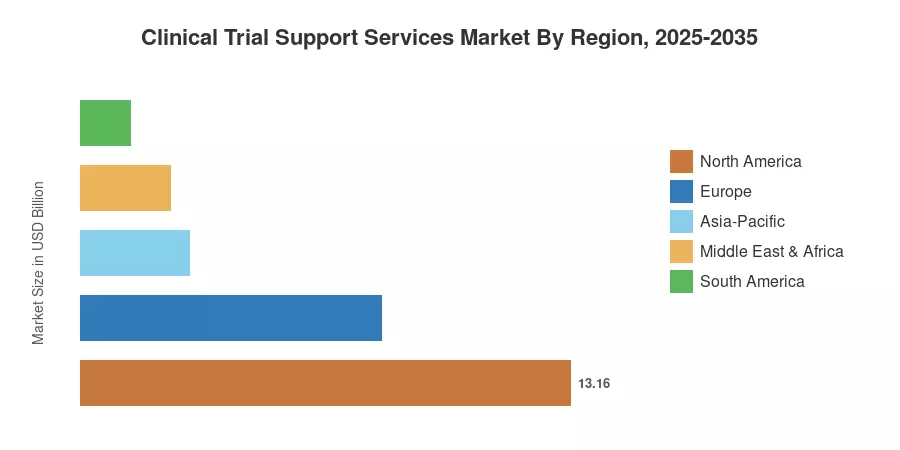
North America holds 44% of global revenue, supported by NIH obligations exceeding USD 47 Billion annually [6]. Asia-Pacific grows fastest at a 9.8% CAGR, and Europe follows at USD 8.08 Billion in 2025. Expect the gap between the top two regions to narrow materially after 2030.


Key Report Takeaways

• By Service Type

  • Clinical Trial Site Management leads the Clinical Trial Support Services Market with a 21% revenue share in 2025
  • Patient Recruitment & Retention posts the sharpest service-line growth at an 8.9% CAGR through 2035
  • Data Management & Biostatistics generated roughly USD 5.08 Billion in 2025

• By End User

  • Pharmaceutical Companies command 52% of demand
  • Biotechnology Companies expand at an 8.6% CAGR, the fastest-growing sponsor cohort in the Clinical Trial Support Services Market
  • Medical Device Companies contributed about USD 3.29 Billion in 2025

• By Region

  • North America holds a 44% share
  • Asia-Pacific advances at a 9.8% CAGR
  • Europe accounted for USD 8.08 Billion in 2025


Market Size and Forecast (2021–2035)

Figures below blend sponsor-side procurement disclosures, service-provider segment reporting, registry activity from ClinicalTrials.gov and EU CTIS, and primary interviews with sponsor procurement leads. Historical years are reconciled against audited filings from the ten largest providers; forecast years apply protocol-volume elasticity to sponsor R&D budgets. The Clinical Trial Support Services Market is measured in service revenue, excluding investigator grant pass-throughs.
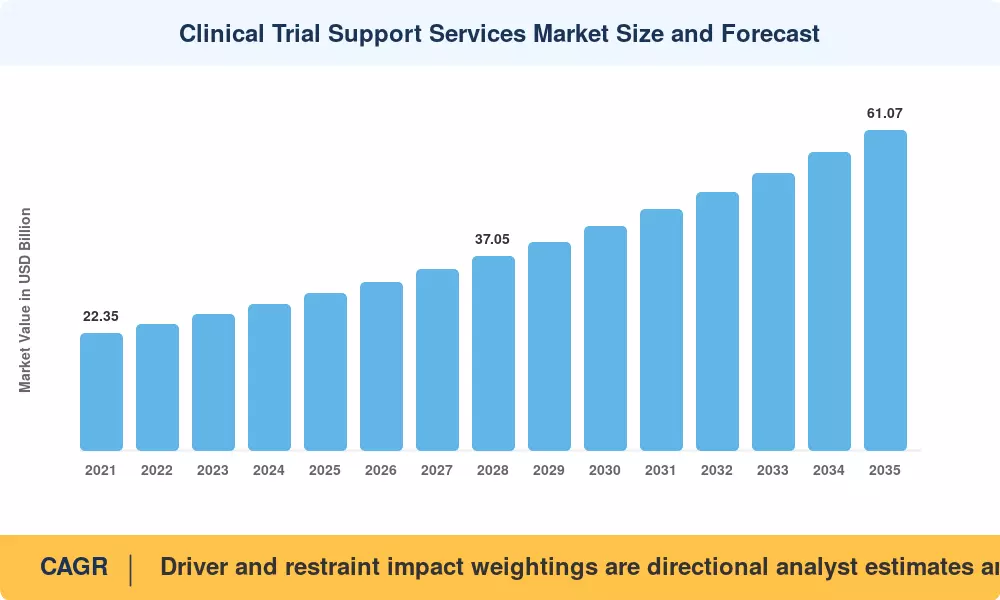
Clinical Trial Support Services Market Size and Forecast
Our Impact
Enabled $4.3B Revenue Impact for Fortune 500 and Leading Multinationals
Partnering with 2000+ Global Organizations Each Year
30K+ Citations by Top-Tier Firms in the Industry

Driver Impact Analysis

Driver ~% Impact on CAGR Geographic Relevance Impact Timeline
Rising protocol complexity and amendment rates +1.4 Global Medium-term (2–4 yr)
Sponsor migration to full-service delivery models +1.2 North America, Europe Short-term (≤2 yr)
Decentralized and hybrid trial adoption +1.1 Global Medium-term (2–4 yr)
Emerging biotech pipeline expansion +0.9 North America, Asia-Pacific Short-term (≤2 yr)
Asia-Pacific site network buildout +0.8 Asia-Pacific Long-term (≥4 yr)
Regulatory harmonization under ICH E6(R3) +0.7 Europe, Asia-Pacific Long-term (≥4 yr)
AI-enabled monitoring and query automation +0.6 Global Long-term (≥4 yr)


Protocol Complexity Is Repricing Every Study

Median Phase III protocols now carry 263 distinct endpoints and procedures, up 31% over a decade, according to Tufts CSDD benchmarking [3]. Each added endpoint multiplies monitoring visits, data points, and statistical programming hours. Sponsors rarely staff for that variability internally, so the incremental burden lands on external providers — which is precisely why the Clinical Trial Support Services Market grows faster than aggregate pharmaceutical R&D spend, itself expanding near 4.1% annually [10].

Full-Service Contracting Displaces Functional Sourcing

Strategic partnerships now cover an estimated 61% of large-pharma trial spend, compared with 44% in 2018 [5]. Bundled awards move regulatory trial consulting, biostatistics, and site oversight into single multi-year contracts worth USD 300 Million to USD 1.2 Billion each. Vendors that can absorb whole therapeutic portfolios win disproportionately; niche specialists get squeezed into subcontractor tiers.

Decentralized Designs Create New Billable Scope

Roughly 28% of trials initiated in 2024 embedded at least one decentralized element — remote consent, home nursing, or connected devices [1]. Each element requires vendor-managed logistics, telehealth licensing, and jurisdiction-specific reimbursement handling. Providers price these as add-on modules, lifting revenue per patient by 12–18% versus conventional site-only designs [7].


Restraints Impact Analysis

Restraint weightings reflect directional drag on growth momentum. They are analyst estimates, not subtractive components of the reported CAGR.

Restraint ~% Impact on CAGR Geographic Relevance Impact Timeline
Sponsor cost-containment and rate-card pressure −0.9 Global Short-term (≤2 yr)
Site staffing shortages and coordinator turnover −0.7 North America, Europe Medium-term (2–4 yr)
Fragmented data-privacy regimes −0.6 Global Medium-term (2–4 yr)
Enrollment shortfalls and screen-failure rates −0.5 Global Short-term (≤2 yr)
Large-sponsor insourcing of core functions −0.4 North America Long-term (≥4 yr)


Rate Cards Are Under Sustained Attack

In 2024, procurement teams at the top 20 sponsors renegotiated unit rates lower by 3–6% [5]. Margin compression comes on fast because labor accounts for about 68% of provider costs. Vendors react by moving deliveries to cheaper hubs, but the arbitrage window shrinks when Indian and Chinese wage inflation exceeds 8% annually [12].


Site Capacity Is the Binding Constraint

In 2024, the turnover rate for the investigator site coordinator was 29%, and a WCG assessment found that about 55% of sites were working above sustainable study load [11]. Sites fail to go live, contracted milestones get pushed out, and revenue recognition gets pulled back. Expansion of Clinical Trial Support Services: So the market is more dependent on physical site throughput than on demand generation.


Clinical Trial Support Services Market Opportunities

Registry-Linked Recruitment in Underpenetrated Geographies

India’s CDSCO registered >1,900 new trial applications in 2024, yet the country hosts <4% of global patient enrollment [12]. Providers creating pre-qualified site networks in tier-2 Indian and ASEAN cities can capture enrollment volume at 40-55% of Western per-patient cost.


Real-World Data Monetization

Longitudinal data assets built during trials are increasingly supporting label expansion and payer dossiers. Vendors that license de-identified datasets back to sponsors create recurring revenue beyond the per-study payments. This strategy already generates over USD 900 Million yearly between the top three providers [16].


Regulatory Convergence as a Product

Adoption of ICH E6(R3) creates demand for harmonized quality frameworks spanning multiple agencies. Firms packaging cross-jurisdiction submission readiness into fixed-fee offerings shorten sponsor approval timelines by an estimated 11 weeks [2].

Device and Diagnostics Sponsors

Medical device trials under EU MDR require post-market clinical follow-up that most manufacturers cannot staff internally. This cohort represents the fastest-growing underserved buyer segment in the Clinical Trial Support Services Market.

Oncology Master Protocols

Platform and basket designs now account for 19% of new oncology starts [17]. Their adaptive nature demands continuous statistical support, favoring providers with dedicated biostatistics benches.


Clinical Trial Support Services Market Future Outlook

Machine Learning Moves From Pilot to Production

Automated query generation and anomaly detection already cut data cleaning cycles by 22% in early deployments [15]. By 2030, expect algorithmic review to handle the majority of routine source data verification, shifting monitor headcount toward exception management.

Platform Economics Reshape Vendor Selection

Sponsors increasingly buy an integrated environment rather than discrete services. Providers owning the underlying data layer capture switching-cost advantages worth an estimated 4–7 points of retention [16], which will concentrate share within the Clinical Trial Support Services Market.

Trial Diversity Becomes a Contractual Obligation

FDA's Diversity Action Plan requirements, effective for pivotal studies from 2025, make representative enrollment a filing condition [1]. Meeting those thresholds requires community site networks that most sponsors will rent rather than build.

Sustainability Enters Procurement Scoring

Carbon accounting for trial logistics and patient travel now appears in roughly 15% of European tenders [20]. Decentralized designs reduce study-level emissions by an estimated 38%, giving providers a measurable ESG argument alongside the cost case for the Clinical Trial Support Services Market.


Clinical Trial Support Services Market Segmentation

By Phase

Phase distribution within the Clinical Trial Support Services Market tracks where sponsor spend concentrates rather than where study counts cluster.

Segment Metric Primary Demand Driver
Phase I 13% share First-in-human unit expansion
Phase II USD 7.18 Billion Proof-of-concept volume
Phase III 47% share Multi-country registrational scale
Phase IV 8.4% CAGR Post-marketing safety commitments


Phase III dominates because registrational studies enroll thousands of patients across dozens of countries, generating the deepest monitoring and data workload. Phase IV grows fastest as conditional approvals attach mandatory confirmatory evidence requirements.

By Service Type

Service mix inside the Clinical Trial Support Services Market has tilted toward front-end enrollment work over the past three years.

Segment Metric Primary Demand Driver
Clinical Trial Site Management 21% share Site activation bottlenecks
Patient Recruitment & Retention 8.9% CAGR Enrollment failure economics
Data Management & Biostatistics USD 5.08 Billion Endpoint proliferation
Regulatory & Medical Writing 13% share Multi-agency submissions
Safety Monitoring & Pharmacovigilance 12% share Signal detection obligations
Logistics & Supply Chain Management 8.1% CAGR Cold-chain biologics
Other Services 8% share Imaging, central labs


Site management retains the largest slice because it is the least automatable. Recruitment services grow fastest for a blunt reason: roughly 80% of trials miss enrollment timelines, and each month of delay costs sponsors USD 600,000 to USD 8 Million in lost exclusivity [14].

By End User

Sponsor composition shapes contract structure across the Clinical Trial Support Services Market.

Segment Metric Primary Demand Driver
Pharmaceutical Companies 52% share Portfolio-level partnerships
Biotechnology Companies 8.6% CAGR Virtual operating models
Medical Device Companies USD 3.29 Billion EU MDR evidence requirements
Academic & Research Institutes 8% share Federally funded networks


Pharmaceutical companies, who are mostly reliant on mega-scale, portfolio-wide strategic alliances to handle their broad late-stage pipelines, are the key anchors of the clinical trial support services market. Conversely, emergent biotechnology companies are the key vector of velocity, using flexible, asset-light virtual operating models to outsource clinical execution. At the same time, revenues from medical device manufacturers are growing, due to increasingly severe post-market clinical follow-up (PMCF) and evidence requirements under the European Union Medical Device Regulation (EU MDR).


By Therapeutic Area

Segment Metric Primary Demand Driver
Oncology 34% share Master protocol complexity
Neurology USD 4.19 Billion Alzheimer's pipeline revival
Cardiology 13% share Large outcome trials
Infectious Diseases 6.9% CAGR Vaccine platform readiness
Metabolic & Endocrinology 9.6% CAGR GLP-1 outcome studies
Other Therapeutic Areas 16% share Rare disease programs


Oncology holds the major part of the clinical trial support services market due to the rising prevalence of adaptive master protocols, basket studies and complex biomarker tracking. Metabolic and endocrinology pipelines are some of the fastest expanding therapeutic vectors, with large cardiovascular and renal outcome studies in the pipeline looking at next-gen GLP-1 receptor agonists and chronic weight control medicines.


Regional Market Share Analysis

Region Metric (2025) Primary Investment Themes
North America 44% share Site networks, decentralized infrastructure
Europe USD 8.08 Billion CTIS compliance, medical writing capacity
Asia-Pacific 9.8% CAGR Patient access, cost arbitrage
South America 4.5% share Oncology enrollment, regulatory reform
Middle East & Africa 8.1% CAGR National genomics programs
Total USD 29.91 Billion

Regional performance across the Clinical Trial Support Services Market reflects where sponsors place protocols, not where they are headquartered.


North America

Country Metric Key Driver
US 84% of region NIH and biotech pipeline density
Canada USD 1.18 Billion Provincial ethics harmonization
Mexico 7.9% CAGR Cost-competitive Phase III sites


American demand rests on concentration: roughly 46% of global industry-sponsored protocols list at least one U.S. site [6]. FDA's Rare Disease Endpoint Advancement pilot and the Accelerating Rare Disease Cures program pulled 140 additional sponsor engagements into the ecosystem during 2024 [1].

Europe

Country Metric Key Driver
Germany 22% of region Oncology center density
UK USD 1.62 Billion MHRA international recognition route
France 7.1% CAGR PRME early-access pathway
Italy 9% of region AIFA fee reform
Spain 8% of region Fast ethics turnaround
Nordic Countries 6.8% CAGR Registry-linked recruitment
Russia 4% of region Domestic sponsor activity
Rest of Europe USD 1.29 Billion CEE cost advantage


European volumes recovered once CTIS submission backlogs cleared in mid-2025. Spain now approves multicentre protocols in a median 47 days, the fastest in the bloc [2], and that speed increasingly determines site allocation.

Asia-Pacific

Country Metric Key Driver
China 31% of region NMPA reform, domestic biotech
India 11.4% CAGR New Drugs and Clinical Trials Rules
Japan 20% of region PMDA Sakigake designation
South Korea USD 0.75 Billion Hospital-based site quality
ASEAN 10.2% CAGR Singapore and Malaysia hubs
Rest of Asia-Pacific 8% of region Australia R&D tax offset


China's NMPA cleared 1,240 investigational new drug applications in 2024, more than double its 2019 count [12]. Australia's 43.5% refundable R&D tax offset continues to draw early-phase work from North American biotechs.

South America

Country Metric Key Driver
Brazil 55% of region Law 14.874 trial framework
Argentina USD 0.30 Billion Cardiology site experience
Rest of South America 8.7% CAGR Chile and Colombia expansion


Brazil's 2024 clinical research law capped ethics review at 30 working days, removing the region's single largest deterrent [18]. Enrollment rates in Brazilian oncology sites already run 1.8 times the global median.

Middle East & Africa

Country Metric Key Driver
Saudi Arabia 26% of region Vision 2030 health investment
UAE USD 0.20 Billion DoH research licensing
South Africa 24% of region Infectious disease trial base
Egypt 8.9% CAGR Population scale, low cost
Rest of MEA 18% of region Israel and Gulf expansion


Saudi Arabia committed USD 2.4 Billion to health-sector research infrastructure under Vision 2030, including the Saudi Genome Program's second phase [19]. South Africa remains the continent's anchor for HIV and tuberculosis programs.


Clinical Trial Support Services Market By Region, 2025-2035

Competitive Benchmarking

Concentration sits in the medium band. Top-five providers hold an estimated 36–43% of global revenue, and the calculated HHI falls near 620 — fragmented enough that mid-tier specialists retain viable niches, concentrated enough that large-pharma awards flow to a short list. Scale in data infrastructure, not headcount, increasingly separates tiers within the Clinical Trial Support Services Market.

Company Est. Revenue Share Range Key Offerings Strategic Positioning
IQVIA Holdings ~11–14% Full-service delivery, RWD, analytics Data-asset leader
ICON plc ~8–11% Site networks, labs, functional service Scale consolidator
Thermo Fisher (PPD) ~7–9% Labs, biologics, integrated delivery Vertically integrated
Fortrea ~4–6% Phase I–IV, patient access Post-spin focused pure play
Parexel ~4–6% Regulatory strategy, biotech delivery Consulting-led
Syneos Health ~3–5% Trial and commercial integration Biopharma end-to-end
Medpace ~2–4% Therapeutic-specialist delivery Mid-size sponsor focus
WuXi Clinical ~2–4% Asia-Pacific site and lab network Regional cost leader
Charles River Laboratories ~2–3% Preclinical to early phase Discovery-adjacent
Labcorp Biopharma Services ~2–3% Central labs, companion diagnostics Diagnostics-anchored
Novotech ~1–2% Asia-Pacific early phase Biotech-dedicated


Recent News & Developments

  • IQVIA (March 2024): Launched an AI-assisted protocol design suite intended to cut amendment frequency, addressing a cost line worth USD 535,000 per substantial amendment [3]
  • EMA (January 2025): Completed the mandatory CTIS transition for all ongoing European trials, closing the legacy directive pathway [2]
  • ICON plc (June 2024): Expanded its Accellacare site network to 200 locations across 12 countries, targeting community enrollment [21]
  • FDA (August 2024): Issued final Diversity Action Plan guidance requiring enrollment targets for pivotal studies [1]
  • Fortrea (February 2025): Divested its Endpoint Clinical and Patient Access units to concentrate on core trial delivery [22]
  • Medpace (October 2024): Reported backlog growth above 12% year over year, led by small and mid-cap biotech awards [23]
  • NMPA China (May 2024): Implemented a 30-working-day default clearance for qualifying IND applications [12]
  • Novotech (November 2024): Acquired a European early-phase unit to extend its Asia-Pacific base into EU submissions [24]


Clinical Trial Support Services Market Report Scope

Parameter Detail
Market Scope Outsourced services supporting Phase I–IV interventional and observational studies, excluding investigator grant pass-throughs
Study Period 2021–2035 (Historical 2021–2024; Base Year 2025; Forecast 2026–2035)
CAGR 7.4% (2026–2035)
Market Size Checkpoints USD 29.91 Billion (2025); USD 32.12 Billion (2026); USD 61.07 Billion (2035)
Fastest Growing Segments Patient Recruitment & Retention; Biotechnology Companies; Asia-Pacific
Companies Profiled 11 leading providers with revenue-share benchmarking
Valuation Currency USD, constant 2025 basis
CAGR Driver Disclaimer Driver and restraint impact weightings are directional analyst estimates and are not additive to the headline CAGR

FAQs

How should a sponsor structure penalty clauses when contracting in the Clinical Trial Support Services Market?
Tie liquidated damages to site activation and first-patient-in milestones rather than aggregate enrollment, which vendors cannot fully control. Cap exposure at 8–12% of contract value to keep bids competitive [5].
What due diligence separates a credible mid-tier provider from a weak one?
Request inspection history by agency, not just a summary count. A provider with zero FDA Form 483 observations across ten audits demonstrates more than headcount or revenue growth does [1].
Does functional service provision cost less than full-service outsourcing in the Clinical Trial Support Services Market?
Unit rates run 15–25% lower, but sponsors absorb integration and oversight costs internally. Total delivered cost converges once portfolio volume exceeds roughly eight concurrent studies [5].
How do data-privacy rules complicate multi-country trials?
China's PIPL and India's DPDP Act require local storage or approved transfer mechanisms, forcing regional database instances. Budget eight to fourteen weeks for transfer impact assessments before database lock planning [13].
Which contract terms matter most for biotech sponsors in the Clinical Trial Support Services Market?
Negotiate change-order pricing upfront, since amendments drive most budget overruns. Also secure named-team retention clauses; personnel churn is the leading source of biotech dissatisfaction [9].
Are AI-based monitoring tools accepted by regulators?
Agencies accept risk-based approaches under ICH E6(R3) provided the sponsor documents model validation and human oversight. Algorithmic output alone cannot justify reduced source verification [15].
What integration problems arise when switching providers mid-programme?
Data migration between incompatible EDC schemas typically consumes six to ten weeks and risks audit-trail gaps. Insist on CDISC-conformant exports written into the original contract [15].    
Author
Author
Author Profile
Nidhi Mandole LinkedIn
Senior Research Analyst
She is an extremely curious individual currently working in Healthcare and Medical Devices Domain. Nidhi is comfortably versed in data centric research backed by healthcare educational background. She leverages extensive data mining and analytics tools such as Primary and Secondary Research, Statistical Analysis, Machine Learning, Data Modelling. Her key role also involves Technical Sales Support, Client Interaction and Project management within the Healthcare team. Lastly, she showcases extensive affinity towards learning new skills and remain fascinated in implementing them.
Co-Author
Co-Author Profile
Rahul Gotadki LinkedIn
Research Manager
He holds an experience of about 9+ years in Market Research and Business Consulting, working under the spectrum of Life Sciences and Healthcare domains. Rahul conceptualizes and implements a scalable business strategy and provides strategic leadership to the clients. His expertise lies in market estimation, competitive intelligence, pipeline analysis, customer assessment, etc.
Share::
Request Free Sample
Download Free Sample

Kindly complete the form below to receive a free sample of this Report

* Please use a valid business email

Share::
Request Free Sample
Download PDF ×

We do not share your information with anyone. However, we may send you emails based on your report interest from time to time. You may contact us at any time to opt-out.
















