Clinical Trial Management System Market (2026 - 2035)

Clinical Trial Management System Market Research Report: Size, Share, Trend Analysis By Types (Enterprise CTMS and On-Site CTMS), Delivery Model (Web-Based [Hosted CTMS], Licensed Enterprise, Cloud-Based CTMS [SaaS]), Component (Software, Service, and Hardware), End-User (Pharmaceutical and Biopharmaceutical Companies, Medical Device Manufacturers, Contract Research Organizations, and others), and Region (North America, Europe, Asia-Pacific, and Rest of the World) - Growth Outlook & Industry Forecast 2025 To 2035

Forecast Period
2026-2035
CAGR
12.7%
2025 Market Size
USD 2.52 Billion
2035 Market Size
USD 8.34 Billion
Healthcare Services ● Updated August 24, 2026 Report ID: MRFR/HS/1522-HCR | Pages: 90 | Author: Vikita Thakur, Kinjoll Dey

Clinical Trial Management System Market Summary

The Clinical Trial Management System Market was valued at USD 2.52 Billion in 2025 and opens the forecast window at USD 2.84 Billion in 2026, climbing to USD 8.34 Billion by 2035 at a 12.7% CAGR. Two catalysts anchor that trajectory. The European Union's Clinical Trials Regulation 536/2014 forced every sponsor running studies in the bloc onto the Clinical Trials Information System by 31 January 2025, retiring national portals and making auditable, single-source trial records a compliance requirement rather than a preference [1]. Alongside that, global biopharma R&D spending crossed USD 300 billion in 2024, and sponsors are pushing an unprecedented share of it through digital trial infrastructure [2].

Technology substitution explains most of the growth. Spreadsheet trackers, homegrown Access databases, and on-premise installations validated a decade ago are giving way to cloud-native platforms that unify site payments, monitoring visits, enrollment forecasting, and regulatory document management in one environment. Tufts CSDD found the average Phase III protocol now carries 263 procedures and 3.6 million data points, a workload that manual oversight simply cannot absorb [3]. Sponsors deploying unified eClinical trial systems report cycle-time reductions of 15–20% on study startup [4].

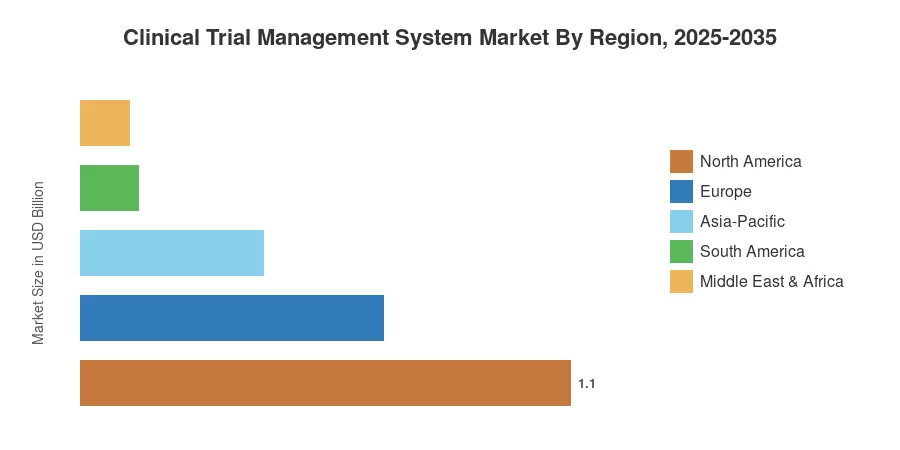
Geography splits along familiar lines but is shifting faster than most buyers expect. North America holds 43.5% of the Clinical Trial Management System Market, Asia-Pacific compounds at 16.4% through 2035 as China, India, and South Korea absorb a rising share of global patient recruitment, and Europe follows North America on the strength of mandatory CTIS adoption. The decade ahead belongs to whoever can make trial oversight continuous rather than periodic.


Key Report Takeaways

• By System Type

  • Enterprise-based CTMS commands 68.4% of the Clinical Trial Management System Market, reflecting sponsor and large-CRO preference for portfolio-level oversight
  • Site-based CTMS is the faster mover, advancing at a 14.1% CAGR as research sites professionalize their own operations

• By Delivery Mode

  • Cloud-based SaaS CTMS accounts for USD 1.16 billion of 2025 revenue, now the default choice for new deployments
  • On-premise CTMS is contracting in share terms, holding 21.3% and concentrated in large pharma with legacy validation estates


• By Component


  • Services contribute 38.5% of Clinical Trial Management System Market revenue, driven by validation, migration, and managed-hosting work

• By Region

  • North America leads with 43.5% share, underpinned by FDA submission volume and CRO density
  • Asia-Pacific grows fastest at a 16.4% CAGR through 2035
  • Europe generated USD 0.68 Billion in 2025, lifted by the CTIS transition deadline


Market Size and Forecast (2021–2035)

Figures below blend vendor revenue disclosures from public filings, licence-seat modelling across roughly 4,200 active sponsor and CRO organizations, registry-derived trial-volume data from ClinicalTrials.gov and the WHO ICTRP, and primary interviews with clinical operations leaders. Historical years are reconciled against reported segment revenue where issuers break out clinical technology lines; forecast years apply adoption-curve modelling by delivery mode and region.
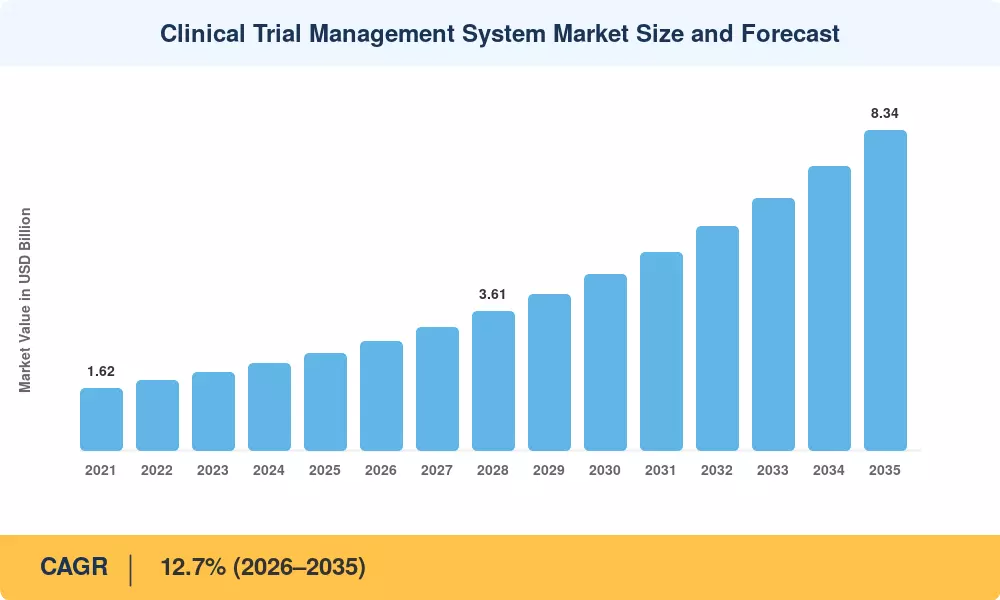
Clinical Trial Management System Market Size and Forecast
Our Impact
Enabled $4.3B Revenue Impact for Fortune 500 and Leading Multinationals
Partnering with 2000+ Global Organizations Each Year
30K+ Citations by Top-Tier Firms in the Industry

Driver Impact Analysis

Driver ~% Impact on CAGR Geographic Relevance Impact Timeline
Rising trial volume and protocol complexity ~2.4 Global Medium-term (2–4 yr)
EU CTR 536/2014 and CTIS mandate ~1.9 Europe Short-term (≤2 yr)
Decentralized and hybrid trial designs ~2.1 North America, Europe Medium-term (2–4 yr)
Cloud and SaaS migration economics ~1.7 Global Short-term (≤2 yr)
CRO outsourcing penetration ~1.5 Global Long-term (≥4 yr)
AI-assisted site selection and risk-based monitoring ~1.6 North America, Asia-Pacific Long-term (≥4 yr)
Asia-Pacific site expansion and regulatory harmonization ~1.3 Asia-Pacific Medium-term (2–4 yr)


Protocol Complexity Is Outrunning Manual Oversight

Trials have grown structurally heavier. Tufts CSDD data shows the mean number of endpoints per Phase III protocol rose 27% between 2013 and 2023, while eligibility criteria climbed to 26 per study [3]. That complexity multiplies deviations, and deviations consume monitoring budget: sponsors report that source data verification alone once consumed 25–30% of monitoring spend before risk-based approaches took hold. The Clinical Trial Management System Market benefits directly because complexity is what justifies the licence — a six-site Phase I study can be run on spreadsheets, but a 140-site global Phase III cannot.

The CTIS Transition Created a Hard Deadline

Regulation 536/2014 gave sponsors a three-year runway that expired on 31 January 2025, after which any ongoing trial not transitioned to CTIS lost its legal basis to continue in the EU [1]. The EMA reported over 5,000 trial transitions processed in the final eighteen months of that window. Deadlines convert intent into procurement, and vendors with pre-built CTIS submission connectors captured a disproportionate share of that replacement wave.

Decentralized Trials Broke the Site-Centric Data Model

Data collection was shifted away from the investigator site through wearable-derived endpoints, home nursing visits, and remote consent. Sponsor control of the dispersed operations was established in the FDA's September 2024 final guidance on decentralized clinical trials [6]. Five years ago, site payment features would have determined the outcome of competitive evaluations; today, platforms that can reconcile a home visit, a shipping device, and a telehealth session against a single subject record win.


Cloud Economics Changed the Buying Committee

On-premise deployments carried validation costs of USD 400,000 to USD 1.2 million and eighteen-month implementation timelines. Validated multi-tenant cloud offerings compressed that to a fraction, shifting authority from IT to clinical operations and opening mid-cap biotech accounts that were previously unreachable [8].


Restraints Impact Analysis

Restraint weightings are directional drag estimates, expressed as relative suppression of the growth rate rather than subtractable percentage points. They reflect adoption friction observed in buyer interviews and should be read alongside the drivers.

Restraint ~% Impact on CAGR Geographic Relevance Impact Timeline
Implementation and GxP validation cost burden −1.4 Global Medium-term (2–4 yr)
Legacy system fragmentation and integration debt −1.1 North America, Europe Long-term (≥4 yr)
Cross-border data privacy constraints −0.9 Europe, Asia-Pacific Short-term (≤2 yr)
Shortage of validated clinical data personnel −0.7 Global Medium-term (2–4 yr)
Budget compression among emerging biotechs −0.8 North America, Europe Short-term (≤2 yr)


Validation Remains the Hidden Line Item

Every system touching regulated trial data must satisfy 21 CFR Part 11 and EU Annex 11 expectations for audit trails, electronic signatures, and change control [12]. Buyers routinely underestimate this: validation, requalification after vendor releases, and periodic review can add 30–45% on top of licence cost over a five-year horizon. Smaller sponsors respond by delaying replacement, extending the life of systems that no longer fit their portfolio.

Integration Debt Slows Realized Value

Most large sponsors run a CTMS beside an EDC, an eTMF, a safety database, a randomization system, and a payments engine — frequently from four different vendors. A 2024 industry survey found fewer than a third of sponsors described their clinical systems as well integrated [13]. Where integration is weak, staff rekey data, reconciliation reports diverge, and the promised cycle-time gains never materialize, which suppresses expansion revenue on renewal.

Privacy Rules Complicate Global Deployments

GDPR restrictions on transfers, China's PIPL localization requirements, and India's Digital Personal Data Protection Act each impose different constraints on where subject-linked operational data may reside [14]. Vendors have answered with regional hosting, but multi-region architectures raise costs and lengthen procurement — a meaningful brake on Asia-Pacific rollouts.


Clinical Trial Management System Market Opportunities

Site-Side Platform Adoption

In the Clinical Trial Management System Market, research sites have traditionally been the overlooked buyer, seeing more as data-entry endpoints than as clients. These days, academic medical centers and independent site networks manage dozens of concurrent studies across several sponsors and require their own financial, staffing, and enrollment view. Site-side deployments lock in workflow patterns that affect sponsor selection and have a much larger volume but a lower average contract value.


AI-Driven Enrollment Forecasting

Predictive enrollment modelling trained on historical site performance is moving from pilot to production. Vendors embedding these models can reprice from seat-based licensing toward outcome-linked contracts, where fees flex with recruitment milestones achieved. That shift monetizes the operational data already flowing through the platform — a genuine new business model rather than a feature.

Emerging Market Trial Infrastructure

India's CDSCO reforms and Brazil's Law 14.874/2024 shortened ethics and regulatory review timelines materially, making both jurisdictions more attractive for patient recruitment [11][15]. Local CROs and hospital networks in these markets are largely greenfield for commercial trial management software, and lower-cost regional editions can capture that base before global vendors reach it.

Benchmarking Data as a Product

De-identified benchmarking can be provided as a subscription layer by platforms that possess cross-sponsor operational telemetry, such as screen-failure rates by indication, activation timeframes by nation, and query resolution velocity. The comparison, not the software, is funded by sponsors. In the market for clinical trial management systems, this is the approach with the largest defensive moat and the clearest data monetization.


Medical Device and Diagnostics Trials

EU MDR post-market clinical follow-up obligations pushed device manufacturers into sustained evidence generation for the first time [16]. Their study designs differ from pharma, and purpose-built configurations for device and IVD sponsors address an underserved segment growing faster than the pharma core.


Clinical Trial Management System Market Future Outlook

Autonomous Trial Operations

By the early 2030s, routine monitoring decisions will be made by models rather than reviewed by people. Central statistical monitoring already flags anomalous sites without human triage, and the logical extension is automated visit scheduling and query generation. Regulators are preparing: FDA's January 2025 draft guidance on AI in regulatory decision-making sets out a risk-based credibility framework that will shape what sponsors can defend in an inspection [10]. The Clinical Trial Management System Market will bifurcate between platforms that own this decision layer and those reduced to systems of record.

Platform Consolidation and Suite Economics

Buyers are tiring of four-vendor stacks. Suite vendors price integration as included value, which puts sustained margin pressure on point solutions and makes acquisition the realistic exit for mid-tier providers. Expect the top five share to rise through 2030 even as the total vendor count stays flat, because new entrants continue to appear at the site-facing edge.

Real-World Evidence Convergence

The distinction between trial and registry is becoming more hazy due to post-approval evidence requirements. With a goal of a significant yearly study volume, EMA's DARWIN EU network attained maximum operational capacity, and sponsors are increasingly requesting a single operational backbone that encompasses both interventional and observational activity [20]. That expenditure will be captured by platforms that view real-world research as an essential component rather than an add-on.


Sustainability and Trial Footprint Reporting

Environmental disclosure is reaching R&D operations. Under CSRD, in-scope sponsors must report value-chain emissions, and clinical trials — with their patient travel, cold-chain shipments, and monitoring flights — are a visible contributor [21]. Some sponsors already model the carbon impact of decentralized designs against conventional ones. Expect footprint reporting to become a standard module in the Clinical Trial Management System Market before 2030.


Clinical Trial Management System Market Segmentation

Segmentation of the Clinical Trial Management System Market follows four dimensions: system type, delivery mode, component, and end user. Metrics vary by row to reflect where each segment's story is clearest.

By System Type

The Clinical Trial Management System Market divides between platforms built for portfolio oversight and those built for site operations.

Segment Metric Primary Demand Driver
Enterprise-Based CTMS 68.4% share (2025) Multi-study portfolio governance and sponsor reporting
Site-Based CTMS 14.1% CAGR (2026–2035) Site professionalization and multi-sponsor workload


Enterprise deployments dominate revenue because they price per study and per user across large organizations. A top-twenty pharma running 200 concurrent trials generates contract value an order of magnitude above any site. Site-based systems grow faster from a smaller base: independent site networks have consolidated aggressively, and a network operating forty locations needs enrollment visibility and invoice tracking that sponsor-provided portals never deliver.

By Delivery Mode

Deployment architecture is the most consequential buying decision in the Clinical Trial Management System Market.

Segment Metric Primary Demand Driver
Cloud-Based SaaS CTMS USD 1.16 Billion (2025) Lower validation burden, faster deployment
Web-Based Hosted CTMS 32.5% share (2025) Single-tenant control with remote access
On-Premise CTMS 11.4% CAGR (2026–2035) Legacy validation estates and data sovereignty


Cloud-based SaaS has become the default for anything other than the largest incumbents. Validated multi-tenant environments let vendors absorb qualification effort that each customer previously repeated, and continuous release cycles keep pace with regulatory change. On-premise persists — it still grows, just slower than the market — mainly where sponsors have sunk validation cost into heavily customized instances or operate under national data localization mandates.

By Component

Component mix in the Clinical Trial Management System Market reveals how much of the value sits outside the licence itself.

Segment Metric Primary Demand Driver
Software 61.5% share (2025) Core licensing and module expansion
Services USD 0.97 Billion (2025) Validation, migration, configuration, managed hosting


Services revenue is stickier than it looks. Initial implementation is one-off, but requalification after each major release, ongoing configuration as protocols evolve, and managed hosting produce recurring engagement that often exceeds licence value over a contract lifetime.

By End User

End-user distribution in the Clinical Trial Management System Market tracks who actually holds operational accountability for a study.

Segment Metric Primary Demand Driver
Pharmaceutical & Biotechnology Companies 47.8% share (2025) Portfolio oversight and regulatory accountability
Contract Research Organizations 15.7% CAGR (2026–2035) Rising outsourcing penetration and multi-sponsor delivery
Medical Device Manufacturers USD 0.30 Billion (2025) EU MDR post-market clinical follow-up obligations
Academic & Research Institutes 11.8% share (2025) Grant-funded study administration and compliance


Sponsors remain the largest buyers, but CROs are the faster-growing cohort because outsourcing penetration keeps climbing — most sponsors now outsource a majority of development activity, and a CRO managing studies for thirty clients needs configurable multi-tenancy that sponsor-designed systems handle poorly.


Regional Market Share Analysis

Region Metric Primary Investment Themes
North America 43.5% share (2025) FDA submission volume, CRO consolidation, risk-based monitoring
Europe USD 0.68 Billion (2025) CTIS compliance, multi-country coordination, GDPR-compliant hosting
Asia-Pacific 16.4% CAGR (2026–2035) Site expansion, regulatory harmonization, cost-advantaged recruitment
South America 5.1% share (2025) Regulatory reform, oncology recruitment depth
Middle East & Africa USD 0.11 Billion (2025) Sovereign health investment, clinical research capacity building
Total USD 2.52 Billion (2025)

Regional performance in the Clinical Trial Management System Market tracks two variables: regulatory submission volume and CRO concentration. Where both are high, penetration is near saturation, and growth comes from replacement and expansion; where trial activity is rising from a low technology base, growth comes from first-time adoption.


North America

Country Metric Key Driver
US 82.1% of regional revenue Highest global IND and NDA submission volume
Canada USD 0.13 Billion (2025) Health Canada trial modernization and academic networks
Mexico 13.8% CAGR (2026–2035) Nearshore recruitment for US-sponsored studies


American demand is a replacement market, not a greenfield one. FDA received a record volume of commercial IND submissions in 2024, and the agency's risk-based monitoring guidance continues to reshape what sponsors expect from oversight tooling [17]. The Clinical Trial Management System Market here is defined by consolidation: as CROs merge, the acquirer's platform choice cascades across the acquired book of business, which makes each enterprise win unusually durable.

Europe

Country Metric Key Driver
Germany 22.4% of regional revenue Largest EU trial host by site count
UK USD 0.14 Billion (2025) MHRA international recognition procedure
France 15.1% of regional revenue Institut national reforms and oncology networks
Italy 13.2% CAGR (2026–2035) AIFA ethics committee restructuring
Spain 8.3% of regional revenue Fast ethics approval timelines
Nordic Countries USD 0.06 Billion (2025) Registry-linked trial designs
Russia 4.7% of regional revenue Domestic sponsor activity
Rest of Europe 10.1% of regional revenue Central European site capacity


Europe's growth is regulation-shaped. CTIS made a single coordinated assessment mandatory across member states, which rewards platforms that can manage one dossier against many national requirements simultaneously [1]. The MHRA's 2024 international recognition procedure pulled the UK partly back into alignment after a period of divergence, easing dual-track burden for sponsors running studies on both sides of the Channel [18].

Asia-Pacific

Country Metric Key Driver
China 29.6% of regional revenue NMPA reforms and domestic biotech pipeline
India 18.4% CAGR (2026–2035) CDSCO timeline reductions, large patient pools
Japan USD 0.10 Billion (2025) PMDA global simultaneous development push
South Korea 11.3% of regional revenue High per-capita trial density in oncology
ASEAN 13.1% of regional revenue Singapore and Malaysia regional hub build-out
Rest of Asia-Pacific USD 0.04 Billion (2025) Australia's R&D tax incentive


Asia-Pacific expansion in the Clinical Trial Management System Market rests on trial relocation. China's accession to ICH and subsequent NMPA reforms cut review timelines sharply, and domestic biotechs now originate a meaningful share of global oncology assets [11]. India amended its rules to compress ethics committee review, and Australia's 43.5% refundable R&D tax offset continues to attract early-phase work. Data residency, covered in, remains the principal deployment obstacle.

South America

Country Metric Key Driver
Brazil 57.8% of regional revenue Law 14.874/2024 regulatory streamlining
Argentina USD 0.03 Billion (2025) Established investigator base in cardiology
Rest of South America 21.9% of regional revenue Chile and Colombia site network growth


Brazil's 2024 clinical research law replaced an approval process widely criticized for unpredictability with statutory review deadlines, a change sponsors had lobbied for over a decade [15]. Recruitment economics in the region are strong — screen-failure rates in several therapeutic areas run below North American benchmarks — but commercial platform penetration remains under a third of sites, leaving substantial headroom.

Middle East & Africa

Country Metric Key Driver
Saudi Arabia 27.4% of regional revenue Vision 2030 health sector transformation
UAE 21.8% of regional revenue M42 and Abu Dhabi research infrastructure
South Africa 16.2% CAGR (2026–2035) Infectious disease and vaccine trial depth
Egypt USD 0.015 Billion (2025) Large treatment-naive patient populations
Rest of MEA 15.9% of regional revenue Nascent site networks


Gulf state investment is deliberate policy rather than market drift. Saudi Arabia's Health Sector Transformation Program targets a substantial increase in domestic clinical research capacity, and the Saudi FDA has rebuilt its trial authorization pathway accordingly [19]. South Africa retains the region's deepest investigator experience, particularly in HIV and tuberculosis studies where SAHPRA-approved sites have decades of continuity.


Clinical Trial Management System Market By Region, 2025-2035

Competitive Benchmarking

Concentration is moderate. Market Research Future estimates an HHI near 750, with the top five vendors holding roughly 48–54% of global revenue — enough to establish reference architectures, not enough to foreclose entry. The structure is barbell-shaped: a handful of suite vendors compete for enterprise sponsor accounts on integration breadth, while a long tail of specialists serves sites, academic centres, and device sponsors on price and configurability. Switching costs are high once a validated instance is in production, so displacement typically happens at portfolio inflection points — a merger, a platform end-of-life, or a failed audit.

Company Est. Revenue Share Range Key Offerings for Clinical Trial Management System Market Strategic Positioning
Oracle Corporation ~11–14% Oracle Clinical One trial management, Siebel CTMS estate Deep installed base in large pharma; migrating legacy to cloud
Dassault Systèmes (Medidata) ~10–13% Medidata Rave CTMS, unified Rave platform Strongest EDC-adjacent pull-through; AI-led site intelligence
Veeva Systems ~9–12% Veeva Vault CTMS, Vault Clinical Suite Single-vault architecture; fastest enterprise displacement record
IQVIA ~7–10% IQVIA CTMS, Orchestrated Clinical Trials Data and CRO scale bundled with technology
Advarra ~5–7% OnCore, Longboat, site-facing operations suite Category leader in academic and site-side deployments
Parexel International ~4–6% Parexel Insights, sponsor-facing trial oversight Service-led delivery with embedded technology
Clario ~3–5% Trial management and endpoint data oversight tools Strength in decentralized and sensor-derived endpoints
Calyx ~3–5% Calyx CTMS and regulatory information management Regulatory-adjacent integration depth
Anju Software ~2–4% TA Scan, TrialMaster-linked trial operations Mid-market and device sponsor focus
Signant Health ~2–4% Clinical operations and patient-facing modules Patient engagement and eCOA adjacency
RealTime Software Solutions ~1–3% RealTime-CTMS for research sites Purpose-built site network platform
Ennov ~1–3% Ennov Clinical, unified regulatory and clinical suite European mid-market and CTIS alignment


Recent News & Developments

  • European Medicines Agency (January 2025): The CTIS transition deadline passed, requiring all ongoing EU trials to operate under Regulation 536/2014, closing a three-year migration window and triggering a concentrated replacement cycle [1]
  • US FDA (January 2025): Issued draft guidance on the use of artificial intelligence to support regulatory decision-making for drugs and biologics, establishing a credibility assessment framework relevant to automated monitoring [10]
  • Veeva Systems (September 2024): Announced expanded Vault CTMS adoption among top-20 pharma sponsors, reinforcing suite consolidation dynamics discussed in [22]
  • US FDA (September 2024): Published final guidance on conducting decentralized clinical trials, formalizing sponsor oversight obligations for remote and distributed study activities [6]
  • Brazil (May 2024): Law 14.874/2024 established statutory review timelines for clinical research approvals, materially improving predictability for sponsors operating in South America [15]
  • Dassault Systèmes (June 2024): Extended Medidata AI capabilities into site selection and enrollment forecasting, positioning operational data as a monetizable asset [23]
  • MHRA (January 2024): Launched the international recognition procedure, reducing duplicate assessment burden for sponsors running parallel UK and EU programmes [18]
  • Advarra (November 2023): Broadened its site-facing operations portfolio following integration of acquired site technology assets, strengthening the academic and site network segment [24]


Clinical Trial Management System Market Report Scope

Parameter Detail
Market Scope Global Clinical Trial Management System Market covering system type, delivery mode, component, end user, and geography
Study Period 2021–2035 (Historical 2021–2024; Base Year 2025; Forecast 2026–2035)
CAGR 12.7% (2026–2035)
Market Size Checkpoints USD 2.52 Billion (2025); USD 2.84 Billion (2026); USD 8.34 Billion (2035)
Fastest Growing Segments Site-Based CTMS; Cloud-Based SaaS CTMS; Contract Research Organizations; Asia-Pacific
Companies Profiled Oracle, Dassault Systèmes (Medidata), Veeva Systems, IQVIA, Advarra, Parexel, Clario, Calyx, Anju Software, Signant Health, RealTime Software Solutions, Ennov
Valuation Currency USD, at prevailing annual average exchange rates

FAQs

What total cost of ownership should a mid-size sponsor budget beyond the Clinical Trial Management System Market licence price?
Budget 30–45% above licence cost over five years. Validation, requalification after vendor releases, integration work, and internal administration drive most of it [12].
How long does a typical enterprise CTMS implementation take?
Twelve to eighteen months for a validated enterprise rollout, and four to seven months for a cloud deployment using standard configuration. Heavy customization is the single largest schedule risk [8].
Should a sponsor buy a single-vendor suite or best-of-breed components?
Suites win on integration cost and audit simplicity; best-of-breed wins where a specialist capability is genuinely differentiating. Most sponsors below 50 concurrent studies find suite economics decisive [13].
What contractual protections matter most when buying into the Clinical Trial Management System Market?
Secure release-notification windows for revalidation, data-extraction rights in an open format at termination, and defined inspection-support obligations. Exit terms matter more than headline discount [12].
How do buyers evaluate vendor AI claims credibly?
Ask for model documentation, training-data provenance, and human-override design. FDA's credibility assessment framework gives a defensible checklist for inspection readiness [10].
Which Clinical Trial Management System Market vendors suit academic medical centres best?
Site-oriented platforms designed around multi-sponsor workload and grant accounting fit academic operations better than sponsor suites. Advarra's OnCore is the established reference in this segment [24].
What integration standard should sponsors require between systems?
Require CDISC-aligned data exchange and documented APIs rather than file-based transfers. Vendors unwilling to expose an API create reconciliation work that compounds every study [13].    
Author
Author
Author Profile
Vikita Thakur LinkedIn
Senior Research Analyst
She holds an experience of about 5+ years in market research and business consulting projects for sectors such as life sciences, medical devices, and healthcare IT. She possesses a robust background in data analysis, market estimation, competitive intelligence, pipeline analysis market trend identification, and consumer behavior insights. Her expertise lies in technical Sales support, client interaction and project management, designing and implementing market research studies, conducting competitive analysis, and synthesizing complex data into actionable recommendations that drive business growth.
Co-Author
Co-Author Profile
Kinjoll Dey LinkedIn
Senior Research Analyst
He is an extremely curious individual currently working in Healthcare and Medical Devices Domain. Kinjoll is comfortably versed in data centric research backed by healthcare educational background. He leverages extensive data mining and analytics tools such as Primary and Secondary Research, Statistical Analysis, Machine Learning, Data Modelling. His key role also involves Technical Sales Support, Client Interaction and Project management within the Healthcare team. Lastly, he showcases extensive affinity towards learning new skills and remain fascinated in implementing them.
Share::
Request Free Sample

Research Approach


Secondary Research

The secondary research process involved comprehensive analysis of regulatory databases, peer-reviewed healthcare IT journals, clinical research publications, and authoritative life sciences organizations. Key sources included the US Food & Drug Administration (FDA) – specifically 21 CFR Part 11 compliance databases and ClinicalTrials.gov registry statistics, European Medicines Agency (EMA) – EudraCT and CTIS (Clinical Trial Information System) databases, International Council for Harmonisation (ICH) – ICH E6(R2) Good Clinical Practice guidelines, National Institutes of Health (NIH) – National Library of Medicine and PubMed Central for clinical informatics research, CDISC (Clinical Data Interchange Standards Consortium) regulatory standards, TransCelerate BioPharma shared technology frameworks, Society for Clinical Data Management (SCDM) benchmarking studies, Health Level Seven International (HL7) interoperability standards, International Organization for Standardization (ISO) – ISO 14155 for medical device clinical investigations, World Health Organization (WHO) – International Clinical Trials Registry Platform (ICTRP), IQVIA Institute for Human Data Science annual trend reports, Tufts Center for the Study of Drug Development (CSDD) performance metrics, Deloitte Life Sciences Outlook reports, and national health IT agency databases from key markets including NICE (UK), BfArM (Germany), and PMDA (Japan). These sources were utilized to collect clinical trial volume statistics, regulatory compliance requirement data, healthcare IT adoption trends, pharmaceutical R&D expenditure patterns, and interoperability standardization developments for enterprise CTMS, cloud-based SaaS platforms, on-site deployment models, and associated software, hardware, and service components.


Primary Research

To gather both qualitative and quantitative insights, supply-side and demand-side stakeholders were interviewed during the primary research phase. Chief executive officers, chief technology officers, vice presidents of product development, chief medical officers, heads of clinical operations, heads of regulatory affairs, and commercial directors from companies that develop CTMS platforms, electronic data capture (EDC) systems, and healthcare IT conglomerates were among the supply-side sources. Chief clinical data officers, heads of clinical innovation, managers of global clinical trials, IT directors from pharmaceutical and biopharmaceutical companies, directors of CRO operations, managers of clinical affairs for medical devices, site coordinators from academic medical centers, and procurement leads from research institutions were among the demand-side sources. In addition to verifying cloud migration timelines and SaaS adoption rates, primary research validated market segmentation across enterprise versus on-site deployment models. It also collected information on patient-centric trial technologies, regulatory compliance automation, decentralized clinical trial (DCT) integration patterns, and pricing models for software licensing versus subscription services.

Primary Respondent Breakdown:

By Designation: C-level Primaries (40%), Director Level (35%), Others (25%)

By Region: North America (40%), Europe (30%), Asia-Pacific (25%), Rest of World (5%)


Market Size Estimation

Global market valuation was derived through revenue mapping, software license analysis, and subscription volume assessment. The methodology included:

Identification of 50+ key CTMS developers, EDC providers, and healthcare IT vendors across North America, Europe, Asia-Pacific, and Latin America

Product mapping across enterprise CTMS, on-site CTMS, web-based hosted solutions, cloud-based SaaS platforms, licensed enterprise models, and software/hardware/service components

Analysis of reported and modeled annual revenues specific to clinical trial management portfolios, including subscription renewal rates and professional services attach rates

Coverage of manufacturers and platform providers representing 75-80% of global market share in 2024

Extrapolation using bottom-up (active clinical trial count × CTMS penetration rate × average selling price by delivery model and end-user segment) and top-down (vendor revenue validation and pharmaceutical R&D IT spend allocation) approaches to derive segment-specific valuations for pharmaceutical companies, CROs, and medical device manufacturers

Share::
Request Free Sample
Download Free Sample

Kindly complete the form below to receive a free sample of this Report

* Please use a valid business email

Share::
Request Free Sample
Download PDF ×

We do not share your information with anyone. However, we may send you emails based on your report interest from time to time. You may contact us at any time to opt-out.
















