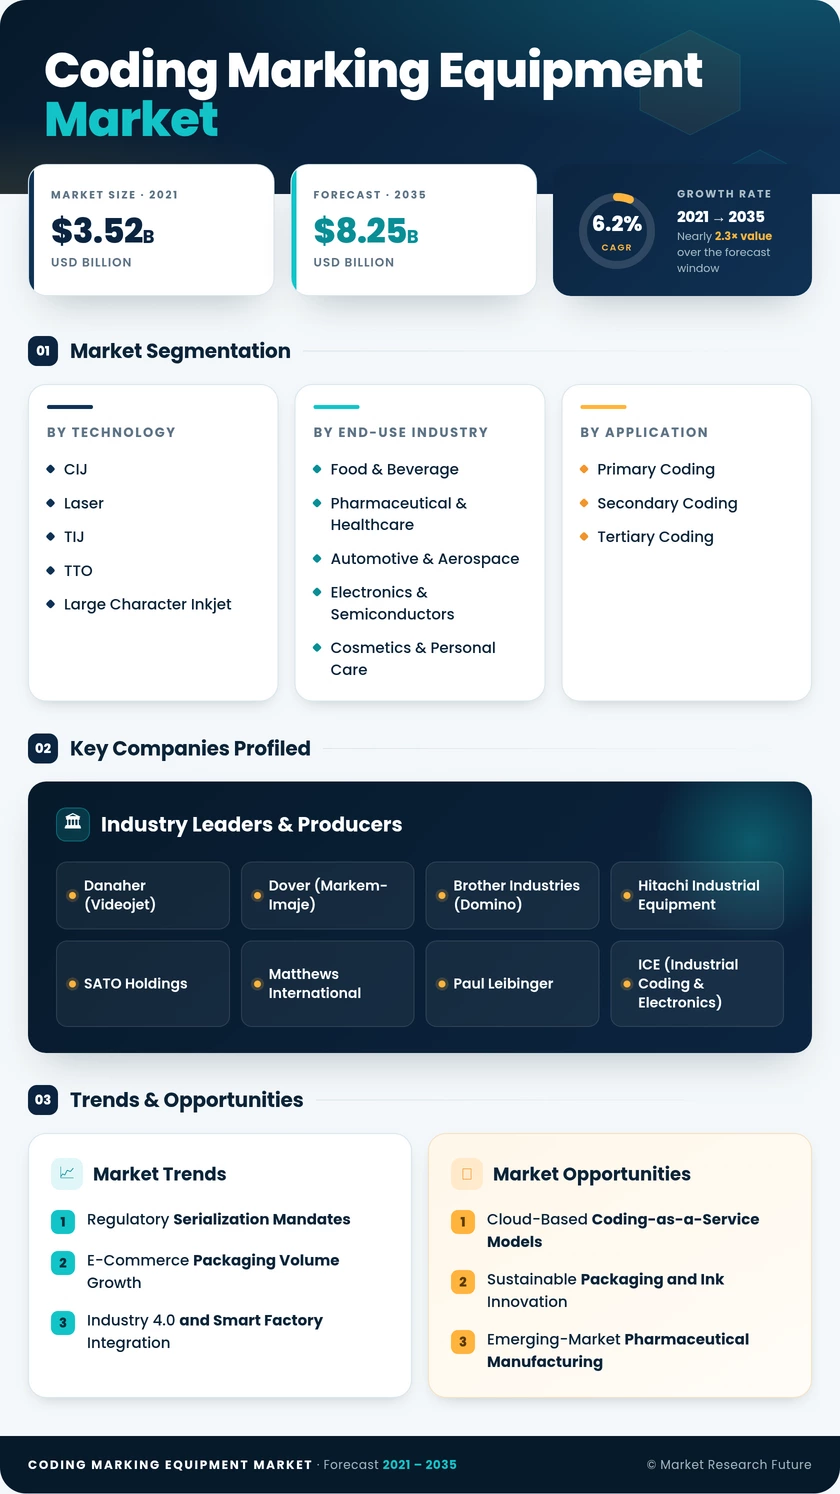
Coding and Marking Equipment Market (2026 - 2035)

ID: MRFR/Equip/28814-HCR
100 Pages
Varsha More
Last Updated: July 01, 2026
Coding and Marking Equipment Market Size, Share & Growth Analysis Report By Technology (Continuous Inkjet (CIJ), Laser Coding, Thermal Inkjet (TIJ), Thermal Transfer Overprinter (TTO), Large Character Inkjet, Label Applicators, Others (Hot Stamping, Pad Printing)), By End-Use Industry (Food & Beverage, Pharmaceutical & Healthcare, Automotive & Aerospace, Electronics & Semiconductors, Cosmetics & Personal Care, Industrial & Chemical), By Application (Primary Coding, Secondary Coding, Tertiary Coding) and By Regional (North America, Europe, South America, Asia Pacific, Middle East and Africa) – Industry Growth & Forecast to 2035
Coding and Marking Equipment Market
Market Size
Forecast Period2026-2035
CAGR (2026-2035)6.2%
2025 Market SizeUSD 4.52 Billion
2035 Market SizeUSD 8.25 Billion
Key Players
Danaher
Dover
Brother Industries
Hitachi Industrial Equipment
SATO Holdings
Matthews International
Opportunities
  • Cloud-Based Coding-as-a-Service Models
  • Sustainable Packaging and Ink Innovation
  • Emerging-Market Pharmaceutical Manufacturing
  1. 1 Market Overview |
    1. 1.1 Study Assumptions & Market Definition |
    2. 1.2 Scope of the Study |
    3. 1.3 Research Methodology
  2. 2 Market Summary & Key Takeaways
  3. 3 Market Dynamics |
    1. 3.1 Market Drivers Analysis | |
      1. 3.1.1 Regulatory Serialization Mandates | |
      2. 3.1.2 E-Commerce Packaging Volume Growth | |
      3. 3.1.3 Industry
    2. 4.0 and Smart Factory Integration | |
      1. 3.1.4 Pharmaceutical Track-and-Trace Expansion | |
      2. 3.1.5 Sustainability-Driven Packaging Redesign | |
      3. 3.1.6 Emerging-Market FMCG Manufacturing Growth | |
      4. 3.1.7 Food-Safety and Recall-Readiness Legislation |
    3. 3.2 Market Restraints Analysis | |
      1. 3.2.1 High Initial Capital Cost of Laser Systems | |
      2. 3.2.2 Ink and Consumable Supply-Chain Disruptions | |
      3. 3.2.3 Fragmented Regulatory Standards Across Regions | |
      4. 3.2.4 Skilled Operator Shortage for Advanced Platforms | |
      5. 3.2.5 Slow Adoption in Small and Medium Enterprises |
    4. 3.3 Market Opportunity Analysis | |
      1. 3.3.1 Cloud-Based Coding-as-a-Service Models | |
      2. 3.3.2 Sustainable Packaging and Ink Innovation | |
      3. 3.3.3 Emerging-Market Pharmaceutical Manufacturing | |
      4. 3.3.4 AI-Driven Print Quality Inspection | |
      5. 3.3.5 Data Monetization Through Code Analytics |
    5. 3.4 Industry Value Chain Analysis |
    6. 3.5 Porter's Five Forces Analysis
  4. 4 Global Coding and Marking Equipment Market Size & Forecast (2021–2035) |
    1. 4.1 Historical Market Size (2021–2025) |
    2. 4.2 Current & Forecast Market Size (2026–2035) |
    3. 4.3 Market Size by Revenue (USD Billion) |
    4. 4.4 Year-over-Year Growth Analysis
  5. 5 Segmentation Analysis |
    1. 5.1 By Technology | |
      1. 5.1.1 Continuous Inkjet (CIJ) | |
      2. 5.1.2 Laser Coding | |
      3. 5.1.3 Thermal Inkjet (TIJ) | |
      4. 5.1.4 Thermal Transfer Overprinter (TTO) | |
      5. 5.1.5 Large Character Inkjet | |
      6. 5.1.6 Label Applicators | |
      7. 5.1.7 Others (Hot Stamping, Pad Printing) |
    2. 5.2 By End-Use Industry | |
      1. 5.2.1 Food & Beverage | |
      2. 5.2.2 Pharmaceutical & Healthcare | |
      3. 5.2.3 Automotive & Aerospace | |
      4. 5.2.4 Electronics & Semiconductors | |
      5. 5.2.5 Cosmetics & Personal Care | |
      6. 5.2.6 Industrial & Chemical |
    3. 5.3 By Application | |
      1. 5.3.1 Primary Coding | |
      2. 5.3.2 Secondary Coding | |
      3. 5.3.3 Tertiary Coding
  6. 6 Regional Analysis |
    1. 6.1 North America | |
      1. 6.1.1 United States | |
      2. 6.1.2 Canada | |
      3. 6.1.3 Mexico |
    2. 6.2 Europe | |
      1. 6.2.1 Germany | |
      2. 6.2.2 United Kingdom | |
      3. 6.2.3 France | |
      4. 6.2.4 Rest of Europe |
    3. 6.3 Asia-Pacific | |
      1. 6.3.1 China | |
      2. 6.3.2 India | |
      3. 6.3.3 Japan | |
      4. 6.3.4 Rest of Asia-Pacific |
    4. 6.4 South America | |
      1. 6.4.1 Brazil | |
      2. 6.4.2 Argentina | |
      3. 6.4.3 Rest of South America |
    5. 6.5 Middle East & Africa | |
      1. 6.5.1 Saudi Arabia | |
      2. 6.5.2 UAE | |
      3. 6.5.3 Rest of Middle East & Africa
  7. 7 Competitive Landscape |
    1. 7.1 Market Share Analysis (2025) |
    2. 7.2 Competitive Benchmarking Matrix |
    3. 7.3 Company Profiles | |
      1. 7.3.1 Danaher Corporation (Videojet Technologies) | |
      2. 7.3.2 Dover Corporation (Markem-Imaje) | |
      3. 7.3.3 Brother Industries (Domino Printing Sciences) | |
      4. 7.3.4 Hitachi Industrial Equipment Systems | |
      5. 7.3.5 SATO Holdings Corporation | |
      6. 7.3.6 Matthews International Corporation | |
      7. 7.3.7 Paul Leibinger GmbH | |
      8. 7.3.8 ICE (Industrial Coding & Electronics) | |
      9. 7.3.9 Squid Ink Manufacturing | |
      10. 7.3.10 KGK Jet India
  8. 8 Future Outlook & Strategic Recommendations (2026–2035) |
    1. 8.1 AI-Autonomous Coding Operations |
    2. 8.2 Platform Consolidation and Software Ecosystems |
    3. 8.3 Sustainability as a Competitive Differentiator |
    4. 8.4 Digital Twin Integration for Line Optimization
  9. 9 Recent Developments & News
  10. 10 Frequently Asked Questions (FAQs)
  11. 11 Report Scope & Methodology |
    1. 11.1 Study Period & Base Year |
    2. 11.2 Data Sources & Citations |
    3. 11.3 Abbreviations
  12. 12 LIST OF TABLES |
  13. TABLE 1 Global Coding and Marking Equipment Market Size & Forecast, by Revenue (USD Billion), 2021–2035 |
  14. TABLE 2 Global Coding and Marking Equipment Market – Year-over-Year Growth Analysis, 2021–2035 |
  15. TABLE 3 Driver Impact Analysis – Coding and Marking Equipment Market, 2026–2035 |
  16. TABLE 4 Restraint Impact Analysis – Coding and Marking Equipment Market, 2026–2035 |
  17. TABLE 5 Global Coding and Marking Equipment Market Size, by Technology, 2021–2035 (USD Billion) |
  18. TABLE 6 Global Coding and Marking Equipment Market Size, by End-Use Industry, 2021–2035 (USD Billion) |
  19. TABLE 7 Global Coding and Marking Equipment Market Size, by Application, 2021–2035 (USD Billion) |
  20. TABLE 8 Global Coding and Marking Equipment Market Size, by Region, 2021–2035 (USD Billion) |
  21. TABLE 9 North America Coding and Marking Equipment Market Size, by Country, 2021–2035 (USD Billion) |
  22. TABLE 10 Europe Coding and Marking Equipment Market Size, by Country, 2021–2035 (USD Billion) |
  23. TABLE 11 Asia-Pacific Coding and Marking Equipment Market Size, by Country, 2021–2035 (USD Billion) |
  24. TABLE 12 South America Coding and Marking Equipment Market Size, by Country, 2021–2035 (USD Billion) |
  25. TABLE 13 Middle East & Africa Coding and Marking Equipment Market Size, by Country, 2021–2035 (USD Billion) |
  26. TABLE 14 Competitive Benchmarking Matrix – Global Coding and Marking Equipment Market, 2025 |
  27. TABLE 15 Company Profiles – Key Players, Global Coding and Marking Equipment Market |
  28. TABLE 16 Recent Developments & Strategic Announcements, 2023–2025 |
  29. TABLE 17 Report Scope & Methodology Summary |
  30. TABLE 18 Detailed Sources and Citations |
  31. TABLE 19 North America Coding and Marking Equipment Market Size, by Technology, 2021–2035 (USD Billion) |
  32. TABLE 20 North America Coding and Marking Equipment Market Size, by End-Use Industry, 2021–2035 (USD Billion) |
  33. TABLE 21 North America Coding and Marking Equipment Market Size, by Application, 2021–2035 (USD Billion) |
  34. TABLE 22 Europe Coding and Marking Equipment Market Size, by Technology, 2021–2035 (USD Billion) |
  35. TABLE 23 Europe Coding and Marking Equipment Market Size, by End-Use Industry, 2021–2035 (USD Billion) |
  36. TABLE 24 Europe Coding and Marking Equipment Market Size, by Application, 2021–2035 (USD Billion) |
  37. TABLE 25 Asia-Pacific Coding and Marking Equipment Market Size, by Technology, 2021–2035 (USD Billion) |
  38. TABLE 26 Asia-Pacific Coding and Marking Equipment Market Size, by End-Use Industry, 2021–2035 (USD Billion) |
  39. TABLE 27 Asia-Pacific Coding and Marking Equipment Market Size, by Application, 2021–2035 (USD Billion) |
  40. TABLE 28 South America Coding and Marking Equipment Market Size, by Technology, 2021–2035 (USD Billion) |
  41. TABLE 29 South America Coding and Marking Equipment Market Size, by End-Use Industry, 2021–2035 (USD Billion) |
  42. TABLE 30 South America Coding and Marking Equipment Market Size, by Application, 2021–2035 (USD Billion) |
  43. TABLE 31 Middle East & Africa Coding and Marking Equipment Market Size, by Technology, 2021–2035 (USD Billion) |
  44. TABLE 32 Middle East & Africa Coding and Marking Equipment Market Size, by End-Use Industry, 2021–2035 (USD Billion) |
  45. TABLE 33 Middle East & Africa Coding and Marking Equipment Market Size, by Application, 2021–2035 (USD Billion) |
  46. TABLE 34 United States Coding and Marking Equipment Market Size, by Technology, 2021–2035 (USD Billion) |
  47. TABLE 35 United States Coding and Marking Equipment Market Size, by End-Use Industry, 2021–2035 (USD Billion) |
  48. TABLE 36 United States Coding and Marking Equipment Market Size, by Application, 2021–2035 (USD Billion) |
  49. TABLE 37 China Coding and Marking Equipment Market Size, by Technology, 2021–2035 (USD Billion) |
  50. TABLE 38 China Coding and Marking Equipment Market Size, by End-Use Industry, 2021–2035 (USD Billion) |
  51. TABLE 39 China Coding and Marking Equipment Market Size, by Application, 2021–2035 (USD Billion) |
  52. TABLE 40 India Coding and Marking Equipment Market Size, by Technology, 2021–2035 (USD Billion) |
  53. TABLE 41 India Coding and Marking Equipment Market Size, by End-Use Industry, 2021–2035 (USD Billion) |
  54. TABLE 42 India Coding and Marking Equipment Market Size, by Application, 2021–2035 (USD Billion) |
  55. TABLE 43 Germany Coding and Marking Equipment Market Size, by Technology, 2021–2035 (USD Billion) |
  56. TABLE 44 Germany Coding and Marking Equipment Market Size, by End-Use Industry, 2021–2035 (USD Billion) |
  57. TABLE 45 Germany Coding and Marking Equipment Market Size, by Application, 2021–2035 (USD Billion)
  58. 13 LIST OF FIGURES |
  59. FIGURE 1 Global Coding and Marking Equipment Market Dynamics (Drivers, Restraints, Opportunities) |
  60. FIGURE 2 Industry Value Chain Analysis – Coding and Marking Equipment Market |
  61. FIGURE 3 Porter's Five Forces Analysis – Coding and Marking Equipment Market |
  62. FIGURE 4 Global Coding and Marking Equipment Market Size Trend (USD Billion), 2021–2035 |
  63. FIGURE 5 Coding and Marking Equipment Market Share, by Technology, 2025 (%) |
  64. FIGURE 6 Coding and Marking Equipment Market Share, by End-Use Industry, 2025 (%) |
  65. FIGURE 7 Coding and Marking Equipment Market Share, by Application, 2025 (%) |
  66. FIGURE 8 Coding and Marking Equipment Market Share, by Region, 2025 (%) |
  67. FIGURE 9 North America Coding and Marking Equipment Market Size Trend (USD Billion), 2021–2035 |
  68. FIGURE 10 Europe Coding and Marking Equipment Market Size Trend (USD Billion), 2021–2035 |
  69. FIGURE 11 Asia-Pacific Coding and Marking Equipment Market Size Trend (USD Billion), 2021–2035 |
  70. FIGURE 12 South America Coding and Marking Equipment Market Size Trend (USD Billion), 2021–2035 |
  71. FIGURE 13 Middle East & Africa Coding and Marking Equipment Market Size Trend (USD Billion), 2021–2035 |
  72. FIGURE 14 Competitive Landscape Map – Global Coding and Marking Equipment Market, 2025

Segmentation Quick Reference

DimensionSub-SegmentsDominant SegmentFastest Growing Segment
By TechnologyCIJ, Laser, TIJ, TTO, Large Character Inkjet, Label Applicators, OthersContinuous Inkjet (CIJ)Laser Coding
By End-Use IndustryFood & Beverage, Coding Marking Equipment Market & Healthcare, Automotive & Aerospace, Electronics & Semiconductors, Cosmetics & Personal Care, Industrial & ChemicalFood & BeverageCoding Marking Equipment Market & Healthcare
By ApplicationPrimary Coding, Secondary Coding, Tertiary CodingPrimary CodingSecondary Coding


Market Segmentation Overview

By Technology

Sub-SegmentKey Trend
Continuous Inkjet (CIJ)Fleet modernization with cloud-connected models replacing legacy standalone units
Laser CodingFiber laser adoption is accelerating in automotive and electronics for permanent marking.
Thermal Inkjet (TIJ)Cartridge-based simplicity is driving pharmaceutical GMP compliance installations.
Thermal Transfer Overprinter (TTO)Flexible packaging growth is sustaining demand for date and variable-data printing.
Large Character InkjetSecondary and tertiary case coding requirements are expanding in logistics.
Label ApplicatorsIntegration with RFID smart labels for dual identification
Others (Hot Stamping, Pad Printing)Legacy installed base declining as non-contact technologies gain share


Continuous inkjet technology continues to anchor the largest share due to its unmatched substrate flexibility and proven reliability in high-speed production environments. Laser coding is the primary growth vector as manufacturers seek permanent, consumable-free marking that aligns with sustainability objectives and total-cost-of-ownership optimization.

By End-Use Industry

Sub-SegmentKey Trend
Food & BeverageDate-code automation and recall-readiness driving fleet upgrades
Coding Marking Equipment Market & HealthcareSerialization mandates creating multi-year procurement cycles globally.
Automotive & AerospaceDirect part marking with fiber lasers for lifetime traceability
Electronics & SemiconductorsUltra-fine micro-marking for PCB and component identification
Cosmetics & Personal CareBrand-protection coding and promotional QR integration
Industrial & ChemicalGHS hazard-label compliance and drum/IBC marking


Food and beverage remains the volume leader, driven by the sheer number of consumer units requiring coded date, lot, and origin information. Coding Marking Equipment Market and healthcare are the fastest-growing verticals as serialization mandates cascade from mature regulatory markets into emerging economies.

By Application

Sub-SegmentKey Trend
Primary CodingUnit-level serialization and consumer-facing information driving technology upgrades
Secondary CodingAggregation requirements linking unit codes to case-level identifiers
Tertiary CodingPallet-level logistics codes enabling automated warehouse operations


Primary coding captures the largest share because every manufactured product requires at least one mark for identification, compliance, or consumer communication. Secondary coding is accelerating as track-and-trace regulations require hierarchical code aggregation from unit to case to pallet.


 

Download PDF ×

We do not share your information with anyone. However, we may send you emails based on your report interest from time to time. You may contact us at any time to opt-out.