Companion Diagnostic Market (2026 - 2035)

ID: MRFR/MED/2231-CR
168 Pages
Satyendra Maurya
Last Updated: July 28, 2026
Companion Diagnostics Market Research Report Information by Test Type (HER2 Testing, PD-1 Testing, EGFR Mutation Testing, ALK Rearrangement Testing, and Others), By Product & Services (assays, reagents & kits, instruments/systems, and software & services), By Technology (polymerase chain reaction (PCR), next-generation sequencing (NGS), immunohistochemistry (IHC), Fluorescence In-Situ Hybridization (FISH), and others),By Indication (cancer, neurological disorders, cardiovascular disorders, and infectious diseases), By End User (Biopharmaceutical and Biotechnology Companies, CROs and CDMOs, and Others) By Region (North America, Europe, Asia-Pacific) - Forecast to 2035
Companion Diagnostic Market
Market Size
Forecast Period2026-2035
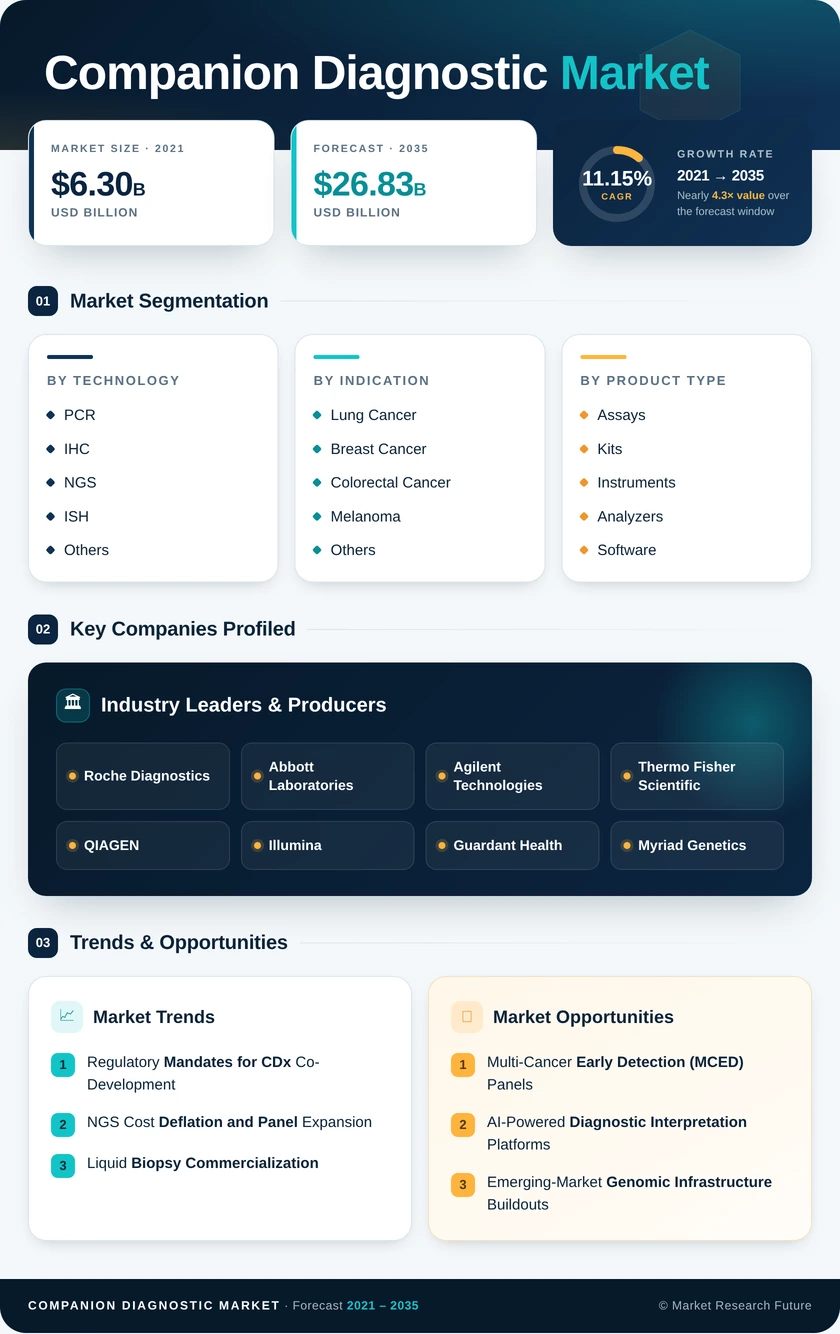
CAGR (2026-2035)11.15%
2025 Market SizeUSD 9.32 Billion
2035 Market SizeUSD 26.83 Billion
Key Players
Roche Diagnostics
Abbott Laboratories
Agilent Technologies
Thermo Fisher Scientific
QIAGEN
Illumina
Opportunities
  • Multi-Cancer Early Detection (MCED) Panels
  • AI-Powered Diagnostic Interpretation Platforms
  • Emerging-Market Genomic Infrastructure Buildouts
  1. 1 Market Overview |
    1. 1.1 Study Assumptions & Market Definition |
    2. 1.2 Scope of the Study |
    3. 1.3 Research Methodology
  2. 2 Market Summary & Key Takeaways
  3. 3 Market Dynamics |
    1. 3.1 Market Drivers Analysis | |
      1. 3.1.1 Regulatory Mandates for CDx Co-Development | |
      2. 3.1.2 NGS Cost Deflation and Panel Expansion | |
      3. 3.1.3 Liquid Biopsy Commercialization | |
      4. 3.1.4 Payer Reimbursement Reforms | |
      5. 3.1.5 AI / ML Integration in Test Interpretation | |
      6. 3.1.6 Precision Oncology Clinical Adoption | |
      7. 3.1.7 Emerging-Market Genomic Infrastructure |
    2. 3.2 Market Restraints Analysis | |
      1. 3.2.1 Regulatory Complexity and Divergent Approval Timelines | |
      2. 3.2.2 Reimbursement Gaps in Emerging Markets | |
      3. 3.2.3 Pre-Analytical Variability and Sample Quality | |
      4. 3.2.4 High Development Costs for CDx Partners | |
      5. 3.2.5 Data Privacy and Cross-Border Genomic Regulations |
    3. 3.3 Market Opportunity Analysis | |
      1. 3.3.1 Multi-Cancer Early Detection (MCED) Panels | |
      2. 3.3.2 AI-Powered Diagnostic Interpretation Platforms | |
      3. 3.3.3 Emerging-Market Genomic Infrastructure Buildouts | |
      4. 3.3.4 Pharmacogenomic Expansion Beyond Oncology | |
      5. 3.3.5 Data Monetization and Real-World Evidence Platforms |
    4. 3.4 Industry Value Chain Analysis |
    5. 3.5 Porter's Five Forces Analysis
  4. 4 Companion Diagnostics Market Size & Forecast (2021–2035) |
    1. 4.1 Historical Market Size (2021–2025) |
    2. 4.2 Current & Forecast Market Size (2026–2035) |
    3. 4.3 Market Size by Revenue (USD Billion) |
    4. 4.4 Year-over-Year Growth Analysis
  5. 5 Segmentation Analysis |
    1. 5.1 By Technology | |
      1. 5.1.1 Polymerase Chain Reaction (PCR) | |
      2. 5.1.2 Immunohistochemistry (IHC) | |
      3. 5.1.3 Next-Generation Sequencing (NGS) | |
      4. 5.1.4 In Situ Hybridization (ISH) | |
      5. 5.1.5 Others |
    2. 5.2 By Indication | |
      1. 5.2.1 Lung Cancer | |
      2. 5.2.2 Breast Cancer | |
      3. 5.2.3 Colorectal Cancer | |
      4. 5.2.4 Melanoma | |
      5. 5.2.5 Other Indications |
    3. 5.3 By Product Type | |
      1. 5.3.1 Assays and Kits | |
      2. 5.3.2 Instruments and Analyzers | |
      3. 5.3.3 Software and Services |
    4. 5.4 By Sample Type | |
      1. 5.4.1 Tissue Biopsy | |
      2. 5.4.2 Liquid Biopsy | |
      3. 5.4.3 Other Sample Types |
    5. 5.5 By End User | |
      1. 5.5.1 Pharmaceutical & Biotechnology Companies | |
      2. 5.5.2 Contract Research Organizations (CROs) | |
      3. 5.5.3 Hospitals & Reference Laboratories | |
      4. 5.5.4 Academic & Research Institutions
  6. 6 Regional Analysis |
    1. 6.1 North America | |
      1. 6.1.1 United States | |
      2. 6.1.2 Canada | |
      3. 6.1.3 Mexico |
    2. 6.2 Europe | |
      1. 6.2.1 Germany | |
      2. 6.2.2 United Kingdom | |
      3. 6.2.3 France | |
      4. 6.2.4 Italy | |
      5. 6.2.5 Spain | |
      6. 6.2.6 Nordic Countries | |
      7. 6.2.7 Russia | |
      8. 6.2.8 Rest of Europe |
    3. 6.3 Asia-Pacific | |
      1. 6.3.1 China | |
      2. 6.3.2 India | |
      3. 6.3.3 Japan | |
      4. 6.3.4 South Korea | |
      5. 6.3.5 ASEAN | |
      6. 6.3.6 Rest of Asia-Pacific |
    4. 6.4 South America | |
      1. 6.4.1 Brazil | |
      2. 6.4.2 Argentina | |
      3. 6.4.3 Rest of South America |
    5. 6.5 Middle East & Africa | |
      1. 6.5.1 Saudi Arabia | |
      2. 6.5.2 UAE | |
      3. 6.5.3 South Africa | |
      4. 6.5.4 Egypt | |
      5. 6.5.5 Rest of MEA
  7. 7 Competitive Landscape |
    1. 7.1 Market Share Analysis (2025) |
    2. 7.2 Competitive Benchmarking Matrix |
    3. 7.3 Company Profiles | |
      1. 7.3.1 Roche Diagnostics | |
      2. 7.3.2 Abbott Laboratories | |
      3. 7.3.3 Agilent Technologies | |
      4. 7.3.4 Thermo Fisher Scientific | |
      5. 7.3.5 QIAGEN | |
      6. 7.3.6 Illumina | |
      7. 7.3.7 Guardant Health | |
      8. 7.3.8 Myriad Genetics | |
      9. 7.3.9 bioMérieux | |
      10. 7.3.10 Exact Sciences
  8. 8 Future Outlook & Strategic Recommendations (2026–2035) |
    1. 8.1 AI-Integrated Diagnostic Decision Support |
    2. 8.2 Liquid Biopsy as First-Line Standard of Care |
    3. 8.3 Pan-Cancer and Multi-Omic Platforms |
    4. 8.4 Sustainability and Supply Chain Resilience
  9. 9 Recent Developments & News
  10. 10 Frequently Asked Questions (FAQs)
  11. 11 Report Scope & Methodology |
    1. 11.1 Study Period & Base Year |
    2. 11.2 Data Sources & Citations |
    3. 11.3 Abbreviations
  12. 12 LIST OF TABLES |
  13. TABLE 1 Global Companion Diagnostics Market Size & Forecast, by Revenue (USD Billion), 2021–2035 |
  14. TABLE 2 Global Companion Diagnostics Market – Year-over-Year Growth Analysis, 2021–2035 |
  15. TABLE 3 Global Companion Diagnostics Market – Driver Impact Analysis |
  16. TABLE 4 Global Companion Diagnostics Market – Restraint Impact Analysis |
  17. TABLE 5 Global Companion Diagnostics Market Size, by Technology, 2021–2035 (USD Billion) |
  18. TABLE 6 Global Companion Diagnostics Market Size, by Indication, 2021–2035 (USD Billion) |
  19. TABLE 7 Global Companion Diagnostics Market Size, by Product Type, 2021–2035 (USD Billion) |
  20. TABLE 8 Global Companion Diagnostics Market Size, by Sample Type, 2021–2035 (USD Billion) |
  21. TABLE 9 Global Companion Diagnostics Market Size, by End User, 2021–2035 (USD Billion) |
  22. TABLE 10 Global Companion Diagnostics Market Size, by Region, 2021–2035 (USD Billion) |
  23. TABLE 11 North America Companion Diagnostics Market Size, by Country, 2021–2035 (USD Billion) |
  24. TABLE 12 Europe Companion Diagnostics Market Size, by Country, 2021–2035 (USD Billion) |
  25. TABLE 13 Asia-Pacific Companion Diagnostics Market Size, by Country, 2021–2035 (USD Billion) |
  26. TABLE 14 South America Companion Diagnostics Market Size, by Country, 2021–2035 (USD Billion) |
  27. TABLE 15 Middle East & Africa Companion Diagnostics Market Size, by Country, 2021–2035 (USD Billion) |
  28. TABLE 16 Competitive Benchmarking Matrix – Global Companion Diagnostics Market, 2025 |
  29. TABLE 17 Company Profiles – Key Players, Global Companion Diagnostics Market |
  30. TABLE 18 Recent Developments & Strategic Announcements, 2023–2025 |
  31. TABLE 19 North America Companion Diagnostics Market Size, by Technology, 2021–2035 (USD Billion) |
  32. TABLE 20 North America Companion Diagnostics Market Size, by Indication, 2021–2035 (USD Billion) |
  33. TABLE 21 North America Companion Diagnostics Market Size, by Product Type, 2021–2035 (USD Billion) |
  34. TABLE 22 North America Companion Diagnostics Market Size, by Sample Type, 2021–2035 (USD Billion) |
  35. TABLE 23 North America Companion Diagnostics Market Size, by End User, 2021–2035 (USD Billion) |
  36. TABLE 24 Europe Companion Diagnostics Market Size, by Technology, 2021–2035 (USD Billion) |
  37. TABLE 25 Europe Companion Diagnostics Market Size, by Indication, 2021–2035 (USD Billion) |
  38. TABLE 26 Europe Companion Diagnostics Market Size, by Product Type, 2021–2035 (USD Billion) |
  39. TABLE 27 Europe Companion Diagnostics Market Size, by Sample Type, 2021–2035 (USD Billion) |
  40. TABLE 28 Europe Companion Diagnostics Market Size, by End User, 2021–2035 (USD Billion) |
  41. TABLE 29 Asia-Pacific Companion Diagnostics Market Size, by Technology, 2021–2035 (USD Billion) |
  42. TABLE 30 Asia-Pacific Companion Diagnostics Market Size, by Indication, 2021–2035 (USD Billion) |
  43. TABLE 31 Asia-Pacific Companion Diagnostics Market Size, by Product Type, 2021–2035 (USD Billion) |
  44. TABLE 32 Asia-Pacific Companion Diagnostics Market Size, by Sample Type, 2021–2035 (USD Billion) |
  45. TABLE 33 Asia-Pacific Companion Diagnostics Market Size, by End User, 2021–2035 (USD Billion) |
  46. TABLE 34 South America Companion Diagnostics Market Size, by Technology, 2021–2035 (USD Billion) |
  47. TABLE 35 South America Companion Diagnostics Market Size, by Indication, 2021–2035 (USD Billion) |
  48. TABLE 36 South America Companion Diagnostics Market Size, by Product Type, 2021–2035 (USD Billion) |
  49. TABLE 37 South America Companion Diagnostics Market Size, by Sample Type, 2021–2035 (USD Billion) |
  50. TABLE 38 South America Companion Diagnostics Market Size, by End User, 2021–2035 (USD Billion) |
  51. TABLE 39 Middle East & Africa Companion Diagnostics Market Size, by Technology, 2021–2035 (USD Billion) |
  52. TABLE 40 Middle East & Africa Companion Diagnostics Market Size, by Indication, 2021–2035 (USD Billion) |
  53. TABLE 41 Middle East & Africa Companion Diagnostics Market Size, by Product Type, 2021–2035 (USD Billion) |
  54. TABLE 42 Middle East & Africa Companion Diagnostics Market Size, by Sample Type, 2021–2035 (USD Billion) |
  55. TABLE 43 Middle East & Africa Companion Diagnostics Market Size, by End User, 2021–2035 (USD Billion) |
  56. TABLE 44 United States Companion Diagnostics Market Size, by Technology, 2021–2035 (USD Billion) |
  57. TABLE 45 United States Companion Diagnostics Market Size, by Indication, 2021–2035 (USD Billion) |
  58. TABLE 46 United States Companion Diagnostics Market Size, by Product Type, 2021–2035 (USD Billion) |
  59. TABLE 47 United States Companion Diagnostics Market Size, by Sample Type, 2021–2035 (USD Billion) |
  60. TABLE 48 United States Companion Diagnostics Market Size, by End User, 2021–2035 (USD Billion) |
  61. TABLE 49 Germany Companion Diagnostics Market Size, by Technology, 2021–2035 (USD Billion) |
  62. TABLE 50 Germany Companion Diagnostics Market Size, by Indication, 2021–2035 (USD Billion) |
  63. TABLE 51 China Companion Diagnostics Market Size, by Technology, 2021–2035 (USD Billion) |
  64. TABLE 52 China Companion Diagnostics Market Size, by Indication, 2021–2035 (USD Billion) |
  65. TABLE 53 Japan Companion Diagnostics Market Size, by Technology, 2021–2035 (USD Billion) |
  66. TABLE 54 Japan Companion Diagnostics Market Size, by Indication, 2021–2035 (USD Billion) |
  67. TABLE 55 India Companion Diagnostics Market Size, by Technology, 2021–2035 (USD Billion) |
  68. TABLE 56 India Companion Diagnostics Market Size, by Indication, 2021–2035 (USD Billion) |
  69. TABLE 57 Brazil Companion Diagnostics Market Size, by Technology, 2021–2035 (USD Billion) |
  70. TABLE 58 Brazil Companion Diagnostics Market Size, by Indication, 2021–2035 (USD Billion) |
  71. TABLE 59 Report Scope & Methodology Summary |
  72. TABLE 60 Detailed Sources and Citations
  73. 13 LIST OF FIGURES |
  74. FIGURE 1 Global Companion Diagnostics Market Dynamics — Drivers, Restraints, and Opportunities |
  75. FIGURE 2 Value Chain Analysis — Companion Diagnostics Market |
  76. FIGURE 3 Porter's Five Forces Analysis — Companion Diagnostics Market |
  77. FIGURE 4 Global Companion Diagnostics Market Size Trend (USD Billion), 2021–2035 |
  78. FIGURE 5 Companion Diagnostics Market Share, by Technology, 2025 (%) |
  79. FIGURE 6 Companion Diagnostics Market Share, by Indication, 2025 (%) |
  80. FIGURE 7 Companion Diagnostics Market Share, by Product Type, 2025 (%) |
  81. FIGURE 8 Companion Diagnostics Market Share, by Sample Type, 2025 (%) |
  82. FIGURE 9 Companion Diagnostics Market Share, by End User, 2025 (%) |
  83. FIGURE 10 Companion Diagnostics Market Share, by Region, 2025 (%) |
  84. FIGURE 11 North America Companion Diagnostics Market Size Trend (USD Billion), 2021–2035 |
  85. FIGURE 12 Europe Companion Diagnostics Market Size Trend (USD Billion), 2021–2035 |
  86. FIGURE 13 Asia-Pacific Companion Diagnostics Market Size Trend (USD Billion), 2021–2035 |
  87. FIGURE 14 South America Companion Diagnostics Market Size Trend (USD Billion), 2021–2035 |
  88. FIGURE 15 Middle East & Africa Companion Diagnostics Market Size Trend (USD Billion), 2021–2035 |
  89. FIGURE 16 Competitive Landscape — Market Share Analysis, Companion Diagnostics Market, 2025 |
  90. FIGURE 17 Competitive Positioning Matrix — Key Players, Companion Diagnostics Market

SEGMENTATION QUICK REFERENCE

DimensionSub-SegmentsDominant SegmentFastest Growing Segment
TechnologyPCR, IHC, NGS, ISH, OthersPolymerase Chain Reaction (PCR)Next-Generation Sequencing (NGS)
IndicationLung Cancer, Breast Cancer, Colorectal Cancer, Melanoma, OthersLung CancerMelanoma
Product TypeAssays and Kits, Instruments and Analyzers, Software and ServicesAssays and KitsSoftware and Services
Sample TypeTissue Biopsy, Liquid Biopsy, OthersTissue BiopsyLiquid Biopsy
End UserPharma & Biotech Companies, CROs, Hospitals & Reference Labs, Academic & Research InstitutionsPharmaceutical & Biotechnology CompaniesContract Research Organizations (CROs)


MARKET SEGMENTATION OVERVIEW

By Technology

Sub-SegmentKey Trend
Polymerase Chain Reaction (PCR)Entrenched in community labs for single-gene CDx; mature but stable demand
Immunohistochemistry (IHC)Core platform for HER2 and PD-L1 protein expression testing
Next-Generation Sequencing (NGS)Rapid adoption of multi-gene panels; declining per-sample costs driving expansion
In Situ Hybridization (ISH)Essential for gene rearrangement detection (ALK, ROS1); steady utilization
OthersEmerging modalities including ddPCR and mass spectrometry gaining niche traction


PCR and IHC remain the foundational technologies in companion diagnostics, but the transition toward NGS-based comprehensive genomic profiling is accelerating as reimbursement pathways mature and clinical guidelines increasingly mandate multi-gene testing upfront.

By Indication

Sub-SegmentKey Trend
Lung CancerLargest indication; nine or more actionable targets mandate molecular testing
Breast CancerHER2, BRCA1/2, and PIK3CA testing anchor treatment selection
Colorectal CancerRAS/BRAF panels guide anti-EGFR therapy decisions
MelanomaBRAF/MEK combination therapies expanding into adjuvant settings
Other IndicationsHematologic malignancies, urothelial cancer, and rare tumors driving incremental growth


Oncology dominates companion diagnostic indications, with lung and breast cancer accounting for the majority of testing volume. Melanoma and emerging tumor types represent the fastest-growing indication categories as new targeted therapies gain regulatory approval.

By Product Type

Sub-SegmentKey Trend
Assays and KitsCaptive demand driven by drug-label requirements; dominant revenue source
Instruments and AnalyzersPlatform refresh cycles and emerging multi-omic analyzers
Software and ServicesAI-driven interpretation and data management platforms growing fastest


Assays and kits will continue to generate the bulk of companion diagnostic revenues due to their direct linkage with drug approvals, while software platforms represent a high-growth overlay that adds recurring revenue to the traditional consumables model.

By Sample Type

Sub-SegmentKey Trend
Tissue BiopsyRemains the regulatory gold standard for histological confirmation
Liquid BiopsyNon-invasive blood-based testing gaining first-line clinical acceptance
Other Sample TypesBone marrow and cytology specimens for hematologic and rare-tumor applications


Tissue biopsy dominates current clinical workflows, but liquid biopsy is positioned for rapid share gains as prospective outcome studies validate blood-based testing for treatment selection and monitoring.

By End User

Sub-SegmentKey Trend
Pharmaceutical & Biotechnology CompaniesPrimary funders of CDx co-development programs
Contract Research Organizations (CROs)Fastest-growing end user as pharma outsources CDx validation
Hospitals & Reference LaboratoriesCore clinical testing sites with growing molecular capabilities
Academic & Research InstitutionsTranslational research and biomarker discovery pipelines


Pharmaceutical companies drive the largest share of end-user demand through co-development investments, while CROs are capturing an increasing proportion of the development and validation workflow as the complexity and regulatory burden of CDx programs grow.




Download PDF ×

We do not share your information with anyone. However, we may send you emails based on your report interest from time to time. You may contact us at any time to opt-out.