• Cat-intel
  • MedIntelliX
  • Resources
  • About Us
  • Hero Background
    English
    Chinese
    French
    Japanese
    Korean
    German
    Spanish

    Composites Market Trends

    ID: MRFR/CnM/3956-CR
    111 Pages
    Chitranshi Jaiswal
    February 2022

    Composites Market Research Report Information By Type (Glass Fiber, Carbon Fiber, and Others), By Resin Type (Thermoplastic Composites, and Thermosetting Composites), By Process (Layup Process, Injection Molding Process, Filament Winding Process, Pultrusion Process, Compression Molding Process, and Others), By End-use(Aerospace & Defense, Automotive & Transportation, Electrical & El...

    Share:
    Download PDF ×

    We do not share your information with anyone. However, we may send you emails based on your report interest from time to time. You may contact us at any time to opt-out.

    Composites Market Infographic
    Purchase Options

    Market Trends

    Key Emerging Trends in the Composites Market

    In recent years, there has been a shift across different industries, which can best be defined as dynamic trends observed in the composite sector worldwide. Composites refer to a combination of two or more different materials having different physical properties or chemical compositions, thereby becoming lighter, stronger, corrosion-resistant materials. Among notable developments in this line include the demand for greater quantities of these substances from the aviation industry, among others. Also significant within automotive manufacturing trends are changes that have seen this industry emerge as a key driver for composite use. Consequently, car manufacturers are progressively taking up compositional elements to increase fuel economy while reducing total vehicle mass. The move not only ensures enhanced sustainability but also falls perfectly into place with global calls for more electric cars. In addition, adoption by automakers has caused an increase in automotive applications such as interior parts and structural components using these materials. The construction industry, too,, has not been left behind when it comes to utilizing composites in its undertakings. The need for durable, corrosion-resistant, and lightweight materials in construction projects has fueled the adoption of composites for various applications. On the other hand, we see increased use of composites during construction, which involves even designing bridges, buildings, and other infrastructure elements. Another significant player affecting the composites market is the renewable energy sector. In particular, wind energy has increased the demand for large, lightweight components which can withstand harsh environmental conditions. These are made with high strength-to-weight ratio composites. This trend will continue as there is an intensifying global drive towards clean energy, thus further developments on composite materials that match the specific requirements of the renewable energy sector. However, recycling and sustainability pose a number of challenges in the composites marketplace. Despite their performance benefits, however, concerns have been raised over how these composites are disposed of at their end-of-life. The aim here is the development of more sustainable composite materials as well as improved recycling processes. In addition, there is a growing awareness of the environmental costs associated with composites, as evidenced by market trends that have shown an increase in research and development activities aimed at eco-friendly substitutes. Geographical trends for Asia-Pacific show its emergence as a powerhouse for composite products globally. The region's strong manufacturing base, especially in China, has led to increased demand for composites across many sectors. North America and Europe remain important players focusing on technological advancements coupled with sustainable practices.

    Author
    Chitranshi Jaiswal
    Research Analyst Level I

    In her 3 years of experience in the market research field, she has handled critical cross-domain projects. She has an in-depth knowledge of market estimation & analysis, problem-solving, primary as well as secondary research, and team management.She holds an engineering degree and is an MBA professional from a well-known university, capable of evaluating the market and competitive conditions. An exceptional strategist with excellent communication skills and a passion for delivering cutting-edge & practical insights for the market. Proficient in multi-tasking, and can successfully deal with competing demands, while maintaining complete confidentiality. Generated business through active client and project development, networking, and high-quality responses. Her knowledge and skills have helped in making solid business decisions, securing funding from investors, and avoiding business failures.

    Leave a Comment

    FAQs

    How much is the Composites market?

    Composites market is projected to reach USD 219.41 billion by 2035

    How Big is the U.S Composites market?

    US is expected to grow at a CAGR of 7.46% from 2025 to 2035

    What is the growth rate of the Composites market?

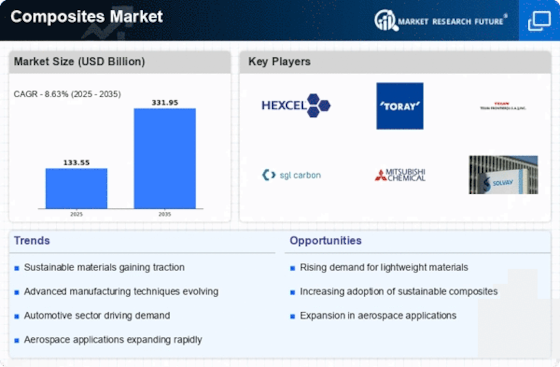
    The composites market growth rate (CAGR) of 8.63% during the forecast period (2025 - 2035)

    Which region held the largest market share in the Composites market?

    Asia Pacific is set to emerge as the fastest growing regional market

    Who are the key players in the Composites market?

    PPG Industries, Inc. (US), Hexion (US), Jushi Group Co., Ltd (China), Toray Industries Inc. (Japan), Owens Corning (US), Teijin Limited (Japan), Hexcel Corporation (US), SGL Carbon (Germany), Mitsubishi Chemicals Corporation (Japan), Solvay (Belgium), and Huntsman International LLC (US)

    Which segment had the largest market share in the Composites market?

    The Thermosetting Composites segment held the majority share in 2021 contributing to around ~73.24%

    Market Summary

    As per Market Research Future Analysis, the Global Composites Market was valued at USD 105.87 billion in 2021 and is projected to grow from USD 113.17 billion in 2022 to USD 219.41 billion by 2030, with a CAGR of 8.63% during the forecast period. Key drivers include rising demand from the automotive industry, growth in the construction sector, and the expanding wind energy market. The automotive sector utilizes composites for various components, while the construction industry benefits from their durability and corrosion resistance. The market is characterized by a significant presence of glass fiber composites, which held approximately 60.35% of the revenue share in 2021, and thermosetting composites, which accounted for around 73.24%. Asia-Pacific leads the market with USD 43.71 billion in 2021, followed by Europe and North America.

    Key Market Trends & Highlights

    The composites market is witnessing significant growth driven by various industry demands.

    • Automotive sector demand is increasing, with composites used in under-the-hood components and exteriors.
    • The construction industry is projected to grow by USD 6.4 trillion by 2030, enhancing the composites market.
    • Asia-Pacific accounted for USD 43.71 billion in 2021, showing an 8.47% CAGR.
    • Thermosetting composites dominate with a 73.24% revenue share in 2021.

    Market Size & Forecast

    2021 Market Size USD 105.87 Billion
    2022 Market Size USD 113.17 Billion
    2030 Market Size USD 219.41 Billion
    CAGR 8.63%
    Largest Regional Market Share in 2021 Asia-Pacific.

    Major Players

    Key players include PPG Industries, Inc., Hexion, Jushi Group Co., Ltd, Toray Industries Inc., Owens Corning, Teijin Limited, Hexcel Corporation, SGL Carbon, Mitsubishi Chemicals Corporation, Solvay, and Huntsman International LLC.

    Market Trends

    SURGE IN DEMAND FROM THE AUTOMOTIVE INDUSTRY

    Composites are widely used in automotive manufacturing in body panels and frames, structural underbody closures, floors, front and rear trunks, induction ducts, rear surround frame, bulkhead (mid-window frame), service doors in the rear trunk, and curved bumper beams. In terms of volume, the top applications for composites in automotive are under-the-hood components, exteriors, and interiors. Suspension components and drive shafts are other expanding markets.

    Some common examples of composites by key producers include Ford Motor Co.'s rear suspension knuckle, Marelli's Advanced SMC steering knuckle, Saint Jean Industries' Hybrid carbon fiber/aluminum suspension knuckle using Hexcel prepreg, IFA Composite's CFRP stabilizer bars, and Dynexa's CFRP output shaft. Composites are commonly used in motorsports and low-volume, high-end or luxury vehicles, which prefer continuous carbon fiber materials.

    For the more cost-sensitive market of mid- and high-volume production models, composites continue to grow steadily and incrementally through continuous glass fiber-reinforced polymers (GFRP) in applications such as leaf springs, as well as chopped fiber molding compounds such as SMC body panels and frames, BMC housings and support structures, and injection molded thermoplastics for bumper frames, lift gauges, and suspension components.

    Moreover, Another driving factor for composites in the automotive industry is the push to achieve zero emissions by 2050, resulting in increased development and production of electric vehicles (EVs). Thus, the high demand for composites in automobiles are likely to drive the growth of the Composites market revenue.

    GROWTH OF THE CONSTRUCTION INDUSTRY

    Bridges, waterfronts, and other structures require rehabilitation and replacement as a result of aging infrastructure. Composites provide corrosion resistance and durability, which contribute to low maintenance and long service life for structures, resulting in life cycle cost savings and a long-term economic advantage over traditional materials such as steel and concrete. Many promoters in the composites industry, from material suppliers to fabricators, are working to raise awareness about the advantages advanced materials offer for updating infrastructure around the world.

    The main applications of composites in architecture include cladding, domes, roofing, structures, bridge decks, full-bridge structures, bridge enclosures, masts and towers, pipes, modular structures, tanks, access covers, water control structures, housings, and refurbishment.

    The growing construction industry in developed nations, with increasing investments in residential construction and infrastructure development. This market growth can be attributed to the increase in residential construction with the growing need for single-family dwellings. Moreover, with the European construction companies focusing on vertical integration to gain a competitive edge and expand their presence in other regions, the construction industry is expected to grow significantly during the review period. The construction market is expected to grow by USD 6.4 trillion in 2020 and reach USD 14.4 trillion by 2030.

    Sub-Saharan Africa is expected to have the fastest growth in regional construction, followed by emerging Asia. China, India, the United States, and Indonesia account for 58.3% of construction growth. Thus, growth of construction industry is likely to drive the growth of the Composites market revenue.

    The Global Composites Market is poised for substantial growth, driven by increasing demand across various industries, including aerospace, automotive, and construction, as manufacturers seek lightweight and durable materials to enhance performance and sustainability.

    U.S. Department of Commerce

    Composites Market Market Drivers

    Increasing Demand for Lightweight Materials

    The Global Composites Market Industry experiences a notable surge in demand for lightweight materials, particularly in the aerospace and automotive sectors. As manufacturers strive to enhance fuel efficiency and reduce emissions, composites offer an attractive solution due to their high strength-to-weight ratio. For instance, the aerospace industry increasingly adopts composite materials to construct aircraft components, contributing to a projected market value of 139.6 USD Billion in 2024. This trend is expected to continue, with the market anticipated to reach 331.9 USD Billion by 2035, indicating a robust growth trajectory.

    Market Segment Insights

    Composites Type Insights

    The Composites market segmentation, based on type, includes Glass Fiber, Carbon Fiber, and Others. The Glass Fiber segment held the majority share in 2021 contributing to around ~60.35% with respect to the Composites market revenue. Glass-fiber composite is a type of fiber-reinforced polymer composites, which are commonly known as fiberglass. The glass fibers are lightweight and exhibit low density, high tensile strength, tenacity, compression strength, thermal expansion, and easy processing. They have wide application in aerospace &defense, automotive & transportation, and building & construction resulting in the growth of the glass fibers segment during the forecast period.

    July 2021: Toray Composite Materials America, Inc., is a leading innovator and supplier of carbon fiber materials and advanced composite prepreg, announces the launch of Epoxy-based Toray 2700. Epoxy-based Toray 2700 is a high-performance, patented resin technology geared toward emerging aerospace programs. It satisfies stringent aerospace structural design drivers and enables the manufacture of high-quality, high-volume, cost-effective composite parts.

    July 2021: Hexcel Corporation had announced the successful maiden flight of a lightweight camera drone, developed using Hexcel HexPly carbon fiber prepregs. The composite drone was developed by a team of students from the University of Applied Sciences Upper Austria in Wels with composite materials supplied by Hexcel Neumarkt in Austria.

    Composites Resin Type Insights

    The Composites market segmentation, based on resin type, Thermoplastic Composites, and Thermosetting Composites. The Thermosetting Composites segment held the majority share in 2021 contributing to around ~73.24% with respect to the Composites market revenue. The segment is expected to maintain its dominance over the forecast period. The properties of thermoset composites include excellent strength, lightweight, low specific gravity, excellent modulus of elasticity, and high corrosion resistance, among others. The superior properties of thermoset composites have contributed to their increasing applicability across various end-use industries, such as wind energy, automotive, and construction & infrastructure, among others.

    The growing demand for durable & lightweight substitute materials from the automotive and aerospace industries is one of the key factors propelling the growth of the thermoset composites market.

    Figure 2: Composites Market, by Resin Type, 2021 & 2030 (USD Billion)Source: Secondary Research, Primary Research, Market Research Future Database and Analyst Review

    Composites Process Insights

    The Composites market segmentation, based on Process, Layup Process, Injection Molding Process, Filament Winding Process, Pultrusion Process, Compression Molding Process, and Others. The Layup Process segment dominated the market in 2021 and Injection Molding Process segment is projected to be the faster-growing segment during the forecast period, 2022-2030. This is due to the Lay-up is an open molding process that can be used to create a wide range of composites products, from small to large. The manufacturing capacity per mold is small; though, it is possible to produce large production quantities by using multiple molds.

    Hand lay-up is the simplest composites molding technique, offering low-cost equipment, simple processing, and a wide range of part sizes. Furthermore, Good production rates and consistent quality can be achieved with trained operators.

    May 2021: Hexcel is expected to promote a wide range of composite innovations for customer applications in aerospace, automotive, wind energy, recreation, and marine markets at JEC Composites Connect, a two-day digital event for networking, discovery, and learning about the composites industry trends and markets.Figure 2: Composites Market, by Process, 2021 & 2030 (USD Billion)Source: Secondary Research, Primary Research, Market Research Future Database and Analyst Review

    Composites End-use Insights

    The Composites market segmentation, based on End-use, Aerospace & Defense, Automotive & Transportation, Electrical & Electronics, Building & Construction, Wind Energy, Marine, and Others. The Aerospace & Defense segment dominated the market in 2021 and the Automotive & Transportation segment is projected to be the faster-growing segment during the forecast period, 2022-2030. This is due to the automotive industry has to face numerous challenges such as reducing vehicle emissions, improving energy efficiency, and increasing safety and appeal at low cost. Composite material helps the automotive maker in reducing vehicle emissions and improving vehicle efficiency.

    It offers light in weight, cost-effective, and high-performance material solutions, which are used in automobiles to fulfil the need of the automotive OEMs for high-volume production. It has a wide range of applications in the automobile industry, such as car doors, car hoods, seats, transmission parts, chassis components, and others. Thus, the increasing sales of vehicles and high growth for customized automotive interiors are likely to propel the market growth during the upcoming year.

    Get more detailed insights about Composites Market Research Report—Global Forecast till 2028

    Regional Insights

    By Region, the study segments the market into North America, Europe, Asia-Pacific, Latin America and Middle East & Africa. Asia-Pacific Composites market accounted for USD 43.71 billion in 2021 and is expected to exhibit an 8.47% CAGR during the study period. This is attributed to growth in the aerospace & defence, and electrical & electronics industry in the region.

    Further, the major countries studied are: The U.S, Canada, Germany, France, UK, Italy, Spain, China, Japan, India, Australia, South Korea, and Brazil.

    Figure 3: COMPOSITES MARKET SHARE BY REGION 2021 (%)COMPOSITES MARKET SHARE BY REGIONSource: Secondary Research, Primary Research, Market Research Future Database and Analyst Review

    Europe Composites market accounts for the second-largest market share due to the EU proposal for tightening its 2030 target for new car CO2 emissions to 50% below 2021 levels, up from 37.5 per cent. Automobile manufacturers impose various requirements such as resistance to temperature changes, vibration resistance, operational reliability at different temperatures, and durability on the power electronics systems based on an electric vehicle's application scenario. Moreover, Germany Composites market held the largest market share and was the fastest-growing market in the European region

    The North America Composites Market is expected to grow at a CAGR of 7.46% from 2022 to 2030. This is due to growth in the automotive & transportation industry. Further, the USA Composites market held the largest market share and was the fastest-growing market in the region.

    Key Players and Competitive Insights

    The Composites market is characterized by the presence of , regional, and local players. The market is highly consolidated, with all the players competing to gain significant market share. The key market players of Composites compete based on cost, product quality, availability of raw materials, and durability of the product. There has been substantial revenue growth for selected composite companies, particularly those located in Asia or those with major operations in Asia. This is the result of an increased domestic demand within Asian countries, as well as an overall rise in composite demand across the globe.

    However, some major companies produce more than one of the composites. A clear example is Teijin, which produces carbon fiber as well as aramid fiber.

    PPG Industries, Inc. (US), Hexion (US), Jushi Group Co., Ltd (China), Toray Industries Inc. (Japan), Owens Corning (US), Teijin Limited (Japan), Hexcel Corporation (US), SGL Carbon (Germany), Mitsubishi Chemicals Corporation (Japan), Solvay (Belgium), and Huntsman International LLC (US) are the key players operating in the Composites market. The Composites market remains highly fragmented with the majority of tier-1 players, with leaders, including PPG INDUSTRIES INC, Teijin Limited, Mitsubishi Chemical Corporation, Solvay, and Toray Industries Inc., accounting for the largest market share. Players in this market adopted various strategies to expand their footprint and augment their market share.

    PPG Industries, Inc. (PPG), a leader in transportation and industrial coatings, is engaged in the production and distribution of a broad range of paints, coatings, and specialty materials. It caters to customers operating in a wide array of end-use industries, including automotive, aerospace, marine, and construction. PPG operates through two business segments, namely, performance and industrial coating. PPG manufactures an extensive portfolio of coatings systems through 156 manufacturing facilities and has a presence in over 39 countries across the globe and sales in more than 70 countries.

    The company offers flooring coating products under the protective coating solutions offered by its performance coatings business segment.

    Also, Hexion is engaged in the manufacturing of advanced specialty chemicals and performance materials. It is a leading manufacturer of adhesives and epoxy resins, and coatings. It operates through business segments, namely epoxy, phenolic and coating resins, and forest products resins. The epoxy, phenolic, and coating resins segment accounted for around USD 2,052 million by the end of 2017. The company serves diverse markets, such as architectural and industrial paints, packaging, consumer goods, automotive coatings, aviation, energy, oil & gas, and electrical composites.

    Hexion has a worldwide network with production facilities in more than 90 countries severing to over 3,000 customers. Its customers include Akzo Nobel N.V., 3M, BASF, Bayer, Dow, Monsanto, PPG Industries, Owens Corning, Valspar, and Weyerhaeuser.

    Key Companies in the Composites Market market include

    Industry Developments

    • Q2 2024: Hexcel to Open New Carbon Fiber Plant in France to Meet Aerospace Demand Hexcel Corporation announced the opening of a new carbon fiber manufacturing facility in Les Avenières, France, aimed at supporting growing demand from the aerospace and defense sectors.
    • Q2 2024: Toray Industries Launches Next-Generation Thermoplastic Composite for Automotive Sector Toray Industries unveiled a new thermoplastic composite material designed for lightweight automotive applications, targeting electric vehicle manufacturers seeking improved performance and sustainability.
    • Q2 2024: Solvay and Safran Announce Strategic Partnership for Advanced Aerospace Composites Solvay and Safran entered a multi-year partnership to co-develop advanced composite materials for next-generation aircraft engines, focusing on sustainability and performance.
    • Q3 2024: SGL Carbon Wins Major Contract to Supply Composite Battery Enclosures for European EV Maker SGL Carbon secured a multi-year contract to supply composite battery enclosures to a leading European electric vehicle manufacturer, expanding its footprint in the automotive composites market.
    • Q3 2024: Owens Corning Acquires Composite Solutions Business from Ahlstrom Owens Corning completed the acquisition of Ahlstrom’s composite solutions business, strengthening its position in the global glass fiber composites market.
    • Q3 2024: Teijin Appoints New CEO to Drive Global Composites Expansion Teijin Limited announced the appointment of a new Chief Executive Officer, with a mandate to accelerate the company’s global composites business and pursue new growth opportunities.
    • Q4 2024: Hexcel and Arkema Open Joint R&D Center for Thermoplastic Composites in France Hexcel and Arkema inaugurated a joint research and development center in France dedicated to advancing thermoplastic composite technologies for aerospace and automotive applications.
    • Q4 2024: Spirit AeroSystems Secures $250 Million Contract for Composite Fuselage Sections Spirit AeroSystems was awarded a $250 million contract to manufacture composite fuselage sections for a new commercial aircraft program, reinforcing its leadership in aerospace composites.
    • Q1 2025: Mitsubishi Chemical Group Launches Recyclable Carbon Fiber Composite for Wind Turbines Mitsubishi Chemical Group introduced a new recyclable carbon fiber composite material designed for wind turbine blades, supporting the renewable energy sector’s sustainability goals.
    • Q1 2025: BASF and BMW Group Announce Partnership on Lightweight Composite Materials BASF and BMW Group entered a partnership to develop and implement lightweight composite materials for next-generation electric vehicles, aiming to improve efficiency and reduce emissions.
    • Q2 2025: Gurit Opens New Composite Manufacturing Facility in India Gurit announced the opening of a new composite manufacturing plant in India to meet rising demand from the wind energy and transportation sectors in the Asia-Pacific region.
    • Q2 2025: Archer Materials Raises $100 Million to Scale Graphene Composite Production Archer Materials completed a $100 million funding round to expand its graphene composite manufacturing capabilities, targeting applications in electronics and advanced manufacturing.

    Future Outlook

    Composites Market Future Outlook

    The Global Composites Market is poised for growth at 8.19% CAGR from 2024 to 2035, driven by advancements in manufacturing technologies and increasing demand across various industries.

    New opportunities lie in:

    • Invest in sustainable composite materials to meet regulatory demands and consumer preferences.
    • Leverage automation in production processes to enhance efficiency and reduce costs.
    • Expand into emerging markets with tailored composite solutions for local industries.

    By 2035, the Global Composites Market is expected to achieve substantial growth, reflecting evolving industry needs and technological advancements.

    Market Segmentation

    Composites Type Outlook

    • Glass Fiber
    • Carbon Fiber
    • Others

    Composites End-Use Outlook

    • Aerospace & Defense
    • Automotive & Transportation
    • Electrical & Electronics
    • Building & Construction
    • Wind Energy
    • Marine
    • Others

    Composites Process Outlook

    • Layup Process
    • Injection Molding Process
    • Filament Winding Process
    • Pultrusion Process
    • Compression Molding Process
    • Others

    Composites Regional Outlook

    North America
    • US
    • Canada

    Composites Resin Type Outlook

    • Thermoplastic Composites
    • Thermosetting Composites

    Report Scope

    Attribute/Metric Details
    Market Size 2021 USD 105.87 billion
    Market Size 2022 USD 113.17 billion
    Market Size 2030 USD 219.41 billion
    Compound Annual Growth Rate (CAGR) 8.63% (2022-2030)
    Base Year 2021
    Forecast Period 2022-2030
    Historical Data 2018 & 2020
    Forecast Units Value (USD Billion)
    Report Coverage Revenue Forecast, Competitive Landscape, Growth Factors, and Trends
    Segments Covered Type, Resin Type, Process, End-use, and Region
    Geographies Covered North America, Europe, Asia Pacific, Latin America and Middle East & Africa
    Countries Covered The U.S, Canada, Germany, France, UK, Italy, Spain, China, Japan, India, Australia, South Korea, and Brazil
    Key Companies Profiled PPG Industries, Inc. (US), Hexion (US), Jushi Group Co., Ltd (China), Toray Industries Inc. (Japan), Owens Corning (US), Teijin Limited (Japan), Hexcel Corporation (US), SGL Carbon (Germany), Mitsubishi Chemicals Corporation (Japan), Solvay (Belgium), and Huntsman International LLC (US)
    Key Market Opportunities Rising demand for recyclable composites Rising demand from various emerging economies
    Key Market Dynamics Surge in demand from the automotive industry Growth of the construction Industry Growing Wind Energy Sector

    Market Highlights

    Author

    Chitranshi Jaiswal
    Research Analyst Level I

    She holds an experience of about 6+ years in market research and business consulting, working under the spectrum of information communication technology, telecommunications and semiconductor domains. aarti conceptualizes and implements a scalable business strategy and provides strategic leadership to the clients. her expertise lies in market estimation, competitive intelligence, pipeline analysis, customer assessment, etc.

    Leave a Comment

    Latest Comments

    John Doe
    john@example.com

    This is a great article! Really helped me understand the topic better.

    Posted on July 23, 2025, 10:15 AM
    Jane Smith
    jane@domain.com

    Thanks for sharing this. I’ve bookmarked it for later reference.

    Posted on July 22, 2025, 7:45 PM

    FAQs

    How much is the Composites market?

    Composites market is projected to reach USD 219.41 billion by 2035

    How Big is the U.S Composites market?

    US is expected to grow at a CAGR of 7.46% from 2025 to 2035

    What is the growth rate of the Composites market?

    The composites market growth rate (CAGR) of 8.63% during the forecast period (2025 - 2035)

    Which region held the largest market share in the Composites market?

    Asia Pacific is set to emerge as the fastest growing regional market

    Who are the key players in the Composites market?

    PPG Industries, Inc. (US), Hexion (US), Jushi Group Co., Ltd (China), Toray Industries Inc. (Japan), Owens Corning (US), Teijin Limited (Japan), Hexcel Corporation (US), SGL Carbon (Germany), Mitsubishi Chemicals Corporation (Japan), Solvay (Belgium), and Huntsman International LLC (US)

    Which segment had the largest market share in the Composites market?

    The Thermosetting Composites segment held the majority share in 2021 contributing to around ~73.24%

    1. EXECUTIVE SUMMARY 19
      1. GLOBAL COMPOSITES MARKET,
      2. BY TYPE 21
      3. GLOBAL COMPOSITES MARKET, BY RESIN TYPE 22
      4. GLOBAL COMPOSITES
    2. MARKET, BY PROCESS 23
      1. GLOBAL COMPOSITES MARKET, BY END-USE 24
      2. 1.5
    3. GLOBAL COMPOSITES MARKET, BY REGION 25
    4. MARKET INTRODUCTION 26
      1. DEFINITION
      2. 26
      3. SCOPE OF THE STUDY 26
      4. MARKET STRUCTURE 27
    5. RESEARCH METHODOLOGY
      1. 28
      2. RESEARCH PROCESS 28
      3. PRIMARY RESEARCH 29
      4. SECONDARY
      5. RESEARCH 30
      6. MARKET SIZE ESTIMATION 31
      7. FORECAST MODEL 32
      8. 3.6
      9. LIST OF ASSUMPTIONS 33
    6. MARKET DYNAMICS 34
      1. INTRODUCTION 34
        1. SURGE IN DEMAND FROM THE AUTOMOTIVE INDUSTRY 35
        2. GROWING WIND ENERGY SECTOR 38
        3. DRIVERS IMPACT ANALYSIS 39
      2. 4.2
      3. DRIVERS 35
      4. 4.2.2
      5. GROWTH OF THE CONSTRUCTION INDUSTRY 36
      6. RESTRAINTS 39
        1. FLUCTUATING
        2. RESTRAINTS IMPACT ANALYSIS 40
      7. RAW MATERIAL PRICES 39
      8. OPPORTUNITIES
        1. RISING DEMAND FOR RECYCLABLE COMPOSITES 40
        2. RISING DEMAND
      9. 40
      10. FROM VARIOUS EMERGING ECONOMIES 41
      11. CHALLENGES 42
        1. AVAILABILITY
      12. OF SUBSTITUTES 42
    7. MARKET FACTOR ANALYSIS 43
      1. VALUE CHAIN
        1. RAW MATERIALS SUPPLIERS 44
        2. COMPOSITES MANUFACTURERS
        3. DISTRIBUTION CHANNEL 44
        4. APPLICATION 45
      2. ANALYSIS 43
      3. 44
      4. PORTER'S
        1. THREAT OF NEW ENTRANTS 46
        2. BARGAINING
        3. THREAT OF SUBSTITUTES 46
        4. BARGAINING
        5. INTENSITY OF COMPETITIVE RIVALRY 47
      5. FIVE FORCES MODEL 45
      6. POWER OF SUPPLIERS 46
      7. POWER OF BUYERS 46
      8. PRICING
      9. ANALYSIS, BY REGION 47
      10. IMPACT OF COVID-19 ON THE GLOBAL COMPOSITES MARKET
        1. PRODUCTION SCENARIO 47
        2. IMPACT OF COVID 19 ON THE SUPPLY
      11. 47
      12. CHAIN OF COMPOSITES MARKET 48
      13. USE INDUSTRY 49
    8. GLOBAL COMPOSITES MARKET, BY TYPE 50
      1. OVERVIEW 50
        1. COMPOSITES: MARKET ESTIMATES & FORECAST BY TYPE, 2022-2030 51
      2. 6.1.2
      3. COMPOSITES: MARKET ESTIMATES & FORECAST BY TYPE, 2022-2030 52
      4. GLASS
        1. GLASS FIBER: MARKET ESTIMATES & FORECAST BY REGION,2022-2030
      5. FIBER 52
      6. 52
      7. CARBON FIBER 53
        1. CARBON FIBER: MARKET ESTIMATES & FORECAST
      8. BY REGION,2022-2030 53
      9. OTHERS 54
        1. OTHERS: MARKET ESTIMATES &
      10. FORECAST BY REGION,2022-2030 54
    9. GLOBAL COMPOSITES MARKET, BY RESIN TYPE 56
      1. OVERVIEW 56
        1. THERMOSETTING COMPOSITES: MARKET ESTIMATES & FORECAST
        2. COMPOSITES: MARKET ESTIMATES & FORECAST
      2. BY RESIN TYPE, 2022-2030 57
      3. BY RESIN TYPE, 2022-2030 58
      4. THERMOPLASTIC COMPOSITES 58
        1. THERMOPLASTIC
      5. COMPOSITES: MARKET ESTIMATES & FORECAST BY REGION,2022-2030 58
      6. THERMOSETTING
        1. THERMOSETTING COMPOSITES: MARKET ESTIMATES & FORECAST
      7. COMPOSITES 60
      8. BY REGION,2022-2030 60
    10. GLOBAL COMPOSITES MARKET, BY PROCESS 62
      1. OVERVIEW 62
        1. COMPOSITES: MARKET ESTIMATES & FORECAST BY PROCESS,
        2. COMPOSITES: MARKET ESTIMATES & FORECAST BY PROCESS,
      2. LAYUP PROCESS 65
        1. LAYUP PROCESS: MARKET ESTIMATES
      3. & FORECAST BY REGION,2022-2030 65
      4. INJECTION MOLDING PROCESS 66
      5. 8.3.1
      6. INJECTION MOLDING PROCESS: MARKET ESTIMATES & FORECAST BY REGION,2022-2030 66
      7. FILAMENT WINDING PROCESS 67
        1. FILAMENT WINDING PROCESS: MARKET ESTIMATES
      8. & FORECAST BY REGION,2022-2030 67
      9. PULTRUSION PROCESS 68
        1. COMPRESSION MOLDING PROCESS: MARKET ESTIMATES
      10. 8.5.1
      11. PULTRUSION PROCESS: MARKET ESTIMATES & FORECAST BY REGION,2022-2030 68
      12. 8.6
      13. COMPRESSION MOLDING PROCESS 69
      14. & FORECAST BY REGION, 2022-2030 69
      15. OTHERS 70
        1. OTHERS: MARKET
      16. ESTIMATES & FORECAST BY REGION,2022-2030 70
    11. GLOBAL COMPOSITES MARKET,
      1. BY END-USE 71
      2. OVERVIEW 71
        1. COMPOSITES: MARKET ESTIMATES &
        2. COMPOSITES: MARKET ESTIMATES &
      3. FORECAST BY END-USE, 2022-2030 72
      4. FORECAST BY END-USE, 2022-2030 73
      5. AEROSPACE & DEFENSE 74
      6. 9.2.1
      7. AEROSPACE & DEFENSE: MARKET ESTIMATES & FORECAST BY REGION,2022-2030 74
      8. AUTOMOTIVE & TRANSPORTATION 76
        1. AUTOMOTIVE & TRANSPORTATION:
      9. MARKET ESTIMATES & FORECAST BY REGION, 2022-2030 76
      10. ELECTRICAL &
        1. ELECTRICAL & ELECTRONICS: MARKET ESTIMATES & FORECAST
      11. ELECTRONICS 78
      12. BY REGION,2022-2030 78
      13. BUILDING & CONSTRUCTION 79
        1. BUILDING
        2. WIND ENERGY: MARKET ESTIMATES & FORECAST BY REGION,2022-2030
      14. & CONSTRUCTION: MARKET ESTIMATES & FORECAST BY REGION,2022-2030 79
      15. 9.6
      16. WIND ENERGY 80
      17. 80
      18. MARINE 81
        1. MARINE: MARKET ESTIMATES & FORECAST BY REGION,2022-2030
      19. 81
      20. OTHERS 82
        1. OTHERS: MARKET ESTIMATES & FORECAST BY REGION,2022-2030
      21. 82
    12. GLOBAL COMPOSITES MARKET, BY REGION 83
      1. OVERVIEW 83
        1. US 91
        2. CANADA 95
      2. 10.2
      3. NORTH AMERICA 86
      4. EUROPE 99
        1. GERMANY 104
        2. RUSSIA 108
        3. UK 112
        4. ITALY
        5. FRANCE 120
        6. SPAIN 124
        7. REST OF EUROPE 128
      5. 116
      6. ASIA-PACIFIC 132
        1. CHINA 137
        2. JAPAN 141
        3. SOUTH KOREA 149
        4. AUSTRALIA & NEW ZEALAND 153
        5. REST OF ASIA-PACIFIC 157
      7. 10.4.3
      8. INDIA 145
      9. LATIN AMERICA 161
        1. BRAZIL
        2. MEXICO 170
        3. ARGENTINA 174
        4. REST OF LATIN AMERICA
      10. 166
      11. 178
      12. THE MIDDLE EAST & AFRICA 182
        1. TURKEY 187
        2. GCC COUNTRIES 195
        3. REST OF THE MIDDLE EAST
      13. 10.6.2
      14. SOUTH AFRICA 191
      15. & AFRICA 199
    13. COMPETITIVE LANDSCAPE 203
      1. INTRODUCTION 203
      2. MARKET STRATEGY ANALYSIS 203
      3. KEY DEVELOPMENTS & GROWTH STRATEGIES
      4. 204
      5. COMPETITIVE BENCHMARKING 207
    14. COMPANY PROFILES 208
      1. 12.1
      2. PPG INDUSTRIES INC. 208
      3. 209
      4. 12.1.5
      5. SWOT ANALYSIS 211
      6. 12.2.1
      7. COMPANY OVERVIEW 212
      8. 214
      9. STRATEGIES 217
      10. DEVELOPMENTS 219
      11. OVERVIEW 220
      12. 223
      13. 12.5.3
      14. PRODUCTS OFFERED 224
      15. 225
      16. OVERVIEW 226
      17. 228
      18. 12.7.2
      19. FINANCIAL OVERVIEW 230
      20. 231
      21. 233
      22. 12.8.3
      23. PRODUCTS OFFERED 234
      24. 235
      25. OFFERED 237
      26. 12.9.6
      27. KEY STRATEGIES 238
      28. 12.10.2
      29. FINANCIAL OVERVIEW 240
      30. 241
      31. INTERNATIONAL LLC 243
      32. 243
      33. 12.11.5
      34. SWOT ANALYSIS 245
    15. COMPANY OVERVIEW 208
    16. FINANCIAL OVERVIEW
    17. PRODUCTS OFFERED 210
    18. KEY DEVELOPMENTS 210
    19. KEY STRATEGIES 211
      1. HEXION 212
        1. FINANCIAL OVERVIEW 213
        2. PRODUCTS OFFERED
        3. KEY DEVELOPMENTS 216
        4. SWOT ANALYSIS 217
        5. KEY
      2. JUSHI GROUP CO. LTD 218
        1. COMPANY OVERVIEW 218
        2. FINANCIAL OVERVIEW 218
        3. PRODUCTS OFFERED 218
        4. KEY
        5. SWOT ANALYSIS 219
        6. KEY STRATEGIES 219
      3. TORAY INDUSTRIES INC. 220
        1. COMPANY OVERVIEW 220
        2. FINANCIAL
        3. PRODUCTS OFFERED 221
        4. KEY DEVELOPMENT 221
        5. SWOT ANALYSIS 222
        6. KEY STRATEGIES 222
      4. OWENS CORNING
        1. COMPANY OVERVIEW 223
        2. FINANCIAL OVERVIEW 223
        3. KEY DEVELOPMENTS 224
        4. SWOT ANALYSIS
        5. KEY STRATEGIES 225
      5. TEIJIN LIMITED 226
        1. COMPANY
        2. FINANCIAL OVERVIEW 226
        3. PRODUCTS OFFERED 227
        4. KEY DEVELOPMENTS 227
        5. SWOT ANALYSIS 228
        6. KEY STRATEGIES
      6. HEXCEL CORPORATION 229
        1. COMPANY OVERVIEW 229
        2. PRODUCTS OFFERED 230
        3. KEY DEVELOPMENTS
        4. SWOT ANALYSIS 232
        5. KEY STRATEGIES 232
      7. SGL CARBON
        1. COMPANY OVERVIEW 233
        2. FINANCIAL OVERVIEW 233
        3. KEY DEVELOPMENTS 234
        4. SWOT ANALYSIS
        5. KEY STRATEGIES 235
      8. MITSUBISHI CHEMICAL CORPORATION 236
        1. COMPANY OVERVIEW 236
        2. FINANCIAL OVERVIEW 236
        3. PRODUCTS
        4. KEY DEVELOPMENTS 237
        5. SWOT ANALYSIS 238
      9. SOLVAY 239
        1. COMPANY OVERVIEW 239
        2. PRODUCTS OFFERED 241
        3. KEY DEVELOPMENTS
        4. SWOT ANALYSIS 242
        5. KEY STRATEGIES 242
      10. HUNTSMAN
        1. COMPANY OVERVIEW 243
        2. FINANCIAL OVERVIEW
        3. PRODUCTS OFFERED 244
        4. KEY DEVELOPMENTS 244
        5. KEY STRATEGIES 245
    20. LIST OF TABLES
    21. LIST OF ASSUMPTIONS 33
    22. GLOBAL COMPOSITES MARKET, PRICING
      1. ANALYSIS (USD/TONS) IMITATI 47
    23. COMPOSITES MARKET ESTIMATES & FORECAST,
      1. BY TYPE, 2022-2030 (USD MILLION) 51
    24. COMPOSITES MARKET ESTIMATES &
      1. FORECAST, BY TYPE, 2022-2030 (KILO TONS) 52
    25. GLASS FIBER MARKET ESTIMATES
      1. & FORECAST, BY REGION, 2022-2030 (USD MILLION) 52
    26. GLASS FIBER MARKET
      1. ESTIMATES & FORECAST, BY REGION, 2022-2030 (KILO TONS) 53
    27. CARBON
    28. FIBER MARKET ESTIMATES & FORECAST, BY REGION, 2022-2030 (USD MILLION) 53
    29. CARBON FIBER MARKET ESTIMATES & FORECAST, BY REGION, 2022-2030 (KILO
      1. TONS) 54
    30. OTHERSS MARKET ESTIMATES & FORECAST, BY REGION, 2022-2030
      1. (USD MILLION) 54
    31. OTHERS MARKET ESTIMATES & FORECAST, BY REGION,
    32. THERMOSETTING COMPOSITES MARKET ESTIMATES
      1. & FORECAST, BY RESIN TYPE, 2022-2030 (USD MILLION) 57
    33. COMPOSITES
    34. MARKET ESTIMATES & FORECAST, BY RESIN TYPE, 2022-2030 (KILO TONS) 58
      1. TABLE
    35. THERMOPLASTIC COMPOSITES MARKET ESTIMATES & FORECAST, BY REGION, 2022-2030
      1. (USD MILLION) 58
    36. THERMOPLASTIC COMPOSITES MARKET ESTIMATES & FORECAST,
      1. BY REGION, 2022-2030 (KILO TONS) 59
    37. THERMOSETTING COMPOSITES MARKET
      1. ESTIMATES & FORECAST, BY REGION, 2022-2030 (USD MILLION) 60
    38. THERMOSETTING
    39. COMPOSITES MARKET ESTIMATES & FORECAST, BY REGION, 2022-2030 (KILO TONS) 61
    40. COMPOSITES MARKET ESTIMATES & FORECAST, BY PROCESS, 2022-2030 (USD
      1. MILLION) 63
    41. COMPOSITES MARKET ESTIMATES & FORECAST, BY PROCESS,
    42. LAYUP PROCESS MARKET ESTIMATES & FORECAST,
      1. BY REGION, 2022-2030 (USD MILLION) 65
    43. LAYUP PROCESS MARKET ESTIMATES
      1. & FORECAST, BY REGION, 2022-2030 (KILO TONS) 65
    44. INJECTION MOLDING
    45. PROCESS MARKET ESTIMATES & FORECAST, BY REGION, 2022-2030 (USD MILLION) 66
    46. INJECTION MOLDING PROCESS MARKET ESTIMATES & FORECAST, BY REGION,
    47. FILAMENT WINDING PROCESS MARKET ESTIMATES
      1. & FORECAST, BY REGION, 2022-2030 (USD MILLION) 67
    48. FILAMENT WINDING
    49. PROCESS MARKET ESTIMATES & FORECAST, BY REGION, 2022-2030 (KILO TONS) 67
    50. PULTRUSION PROCESS MARKET ESTIMATES & FORECAST, BY REGION, 2022-2030
      1. (USD MILLION) 68
    51. PULTRUSION PROCESS MARKET ESTIMATES & FORECAST,
      1. BY REGION, 2022-2030 (KILO TONS) 68
    52. COMPRESSION MOLDING PROCESS MARKET
      1. ESTIMATES & FORECAST, BY REGION, 2022-2030 (USD MILLION) 69
    53. COMPRESSION
    54. MOLDING PROCESS MARKET ESTIMATES & FORECAST, BY REGION, 2022-2030 (KILO TONS)
      1. 69
    55. OTHERSS MARKET ESTIMATES & FORECAST, BY REGION, 2022-2030 (USD
      1. MILLION) 70
    56. OTHERS MARKET ESTIMATES & FORECAST, BY REGION, 2022-2030
      1. (KILO TONS) 70
    57. COMPOSITES MARKET ESTIMATES & FORECAST, BY END-USE,
    58. COMPOSITES MARKET ESTIMATES & FORECAST,
      1. BY END-USE, 2022-2030 (KILO TONS) 73
    59. AEROSPACE & DEFENSE MARKET
      1. ESTIMATES & FORECAST, BY REGION, 2022-2030 (USD MILLION) 74
    60. AEROSPACE
    61. & DEFENSE MARKET ESTIMATES & FORECAST, BY REGION, 2022-2030 (KILO TONS)
      1. 75
    62. AUTOMOTIVE & TRANSPORTATION MARKET ESTIMATES & FORECAST,
      1. BY REGION, 2022-2030 (USD MILLION) 76
    63. AUTOMOTIVE & TRANSPORTATION
    64. MARKET ESTIMATES & FORECAST, BY REGION, 2022-2030 (KILO TONS) 77
      1. TABLE
    65. ELECTRICAL & ELECTRONICS MARKET ESTIMATES & FORECAST, BY REGION, 2022-2030
      1. (USD MILLION) 78
    66. ELECTRICAL & ELECTRONICS MARKET ESTIMATES &
      1. FORECAST, BY REGION, 2022-2030 (KILO TONS) 78
    67. BUILDING & CONSTRUCTION
    68. MARKET ESTIMATES & FORECAST, BY REGION, 2022-2030 (USD MILLION) 79
      1. TABLE
    69. BUILDING & CONSTRUCTION MARKET ESTIMATES & FORECAST, BY REGION, 2022-2030
      1. (KILO TONS) 79
    70. WIND ENERGY MARKET ESTIMATES & FORECAST, BY REGION,
    71. WIND ENERGY MARKET ESTIMATES & FORECAST,
      1. BY REGION, 2022-2030 (KILO TONS) 80
    72. MARINE MARKET ESTIMATES &
      1. FORECAST, BY REGION, 2022-2030 (USD MILLION) 81
    73. MARINE MARKET ESTIMATES
      1. & FORECAST, BY REGION, 2022-2030 (KILO TONS) 81
    74. OTHERSS MARKET
      1. ESTIMATES & FORECAST, BY REGION, 2022-2030 (USD MILLION) 82
    75. OTHERS
    76. MARKET ESTIMATES & FORECAST, BY REGION, 2022-2030 (KILO TONS) 82
      1. TABLE
    77. GLOBAL COMPOSITES MARKET, BY REGION, 2022-2030 (USD MILLION) 85
      1. TABLE 47
    78. GLOBAL COMPOSITES MARKET, BY REGION, 2022-2030 (KILO TONS) 86
    79. NORTH
    80. AMERICA: COMPOSITES MARKET, BY COUNTRY, 2022-2030 (USD MILLION) 87
      1. TABLE 49
    81. NORTH AMERICA: COMPOSITES MARKET, BY COUNTRY, 2022-2030 (KILO TONS) 87
      1. TABLE
    82. NORTH AMERICA: COMPOSITES MARKET, BY TYPE, 2022-2030 (USD MILLION) 87
      1. TABLE
    83. NORTH AMERICA: COMPOSITES MARKET, BY TYPE, 2022-2030 (KILO TONS) 88
      1. TABLE
    84. NORTH AMERICA: COMPOSITES MARKET, BY RESIN TYPE, 2022-2030 (USD MILLION) 88
    85. NORTH AMERICA: COMPOSITES MARKET, BY RESIN TYPE, 2022-2030 (KILO TONS)
      1. 88
    86. NORTH AMERICA: COMPOSITES MARKET, BY PROCESS, 2022-2030 (USD MILLION)
      1. 89
    87. NORTH AMERICA: COMPOSITES MARKET, BY PROCESS, 2022-2030 (KILO TONS)
      1. 89
    88. NORTH AMERICA: COMPOSITES MARKET, BY END-USE, 2022-2030 (USD MILLION)
      1. 90
    89. NORTH AMERICA: COMPOSITES MARKET, BY END-USE, 2022-2030 (KILO TONS)
      1. 90
    90. US: COMPOSITES MARKET, BY TYPE, 2022-2030 (USD MILLION) 91
      1. TABLE
    91. US: COMPOSITES MARKET, BY TYPE, 2022-2030 (KILO TONS) 91
    92. US: COMPOSITES
    93. MARKET, BY RESIN TYPE, 2022-2030 (USD MILLION) 92
    94. US: COMPOSITES MARKET,
      1. BY RESIN TYPE, 2022-2030 (KILO TONS) 92
    95. US: COMPOSITES MARKET, BY
      1. PROCESS, 2022-2030 (USD MILLION) 93
    96. US: COMPOSITES MARKET, BY PROCESS,
    97. US: COMPOSITES MARKET, BY END-USE, 2022-2030
      1. (USD MILLION) 94
    98. US: COMPOSITES MARKET, BY END-USE, 2022-2030 (KILO
      1. TONS) 94
    99. CANADA: COMPOSITES MARKET, BY TYPE, 2022-2030 (USD MILLION)
      1. 95
    100. CANADA: COMPOSITES MARKET, BY TYPE, 2022-2030 (KILO TONS) 95
    101. CANADA: COMPOSITES MARKET, BY RESIN TYPE, 2022-2030 (USD MILLION) 96
    102. CANADA: COMPOSITES MARKET, BY RESIN TYPE, 2022-2030 (KILO TONS) 96
    103. CANADA: COMPOSITES MARKET, BY PROCESS, 2022-2030 (USD MILLION) 97
    104. CANADA: COMPOSITES MARKET, BY PROCESS, 2022-2030 (KILO TONS) 97
      1. TABLE
    105. CANADA: COMPOSITES MARKET, BY END-USE, 2022-2030 (USD MILLION) 98
      1. TABLE
    106. CANADA: COMPOSITES MARKET, BY END-USE, 2022-2030 (KILO TONS) 98
      1. TABLE 74
    107. EUROPE: COMPOSITES MARKET, BY COUNTRY, 2022-2030 (USD MILLION) 99
      1. TABLE 75
    108. EUROPE: COMPOSITES MARKET, BY COUNTRY, 2022-2030 (KILO TONS) 100
    109. EUROPE:
    110. COMPOSITES MARKET, BY TYPE, 2022-2030 (USD MILLION) 100
    111. EUROPE: COMPOSITES
    112. MARKET, BY TYPE, 2022-2030 (KILO TONS) 101
    113. EUROPE: COMPOSITES MARKET,
      1. BY RESIN TYPE, 2022-2030 (USD MILLION) 101
    114. EUROPE: COMPOSITES MARKET,
      1. BY RESIN TYPE, 2022-2030 (KILO TONS) 101
    115. EUROPE: COMPOSITES MARKET,
      1. BY PROCESS, 2022-2030 (USD MILLION) 102
    116. EUROPE: COMPOSITES MARKET,
      1. BY PROCESS, 2022-2030 (KILO TONS) 102
    117. EUROPE: COMPOSITES MARKET, BY
      1. END-USE, 2022-2030 (USD MILLION) 103
    118. EUROPE: COMPOSITES MARKET, BY
      1. END-USE, 2022-2030 (KILO TONS) 103
    119. GERMANY: COMPOSITES MARKET, BY
      1. TYPE, 2022-2030 (USD MILLION) 104
    120. GERMANY: COMPOSITES MARKET, BY TYPE,
    121. GERMANY: COMPOSITES MARKET, BY RESIN TYPE,
    122. GERMANY: COMPOSITES MARKET, BY RESIN TYPE,
    123. GERMANY: COMPOSITES MARKET, BY PROCESS,
    124. GERMANY: COMPOSITES MARKET, BY PROCESS,
    125. GERMANY: COMPOSITES MARKET, BY END-USE,
    126. GERMANY: COMPOSITES MARKET, BY END-USE,
    127. RUSSIA: COMPOSITES MARKET, BY TYPE, 2022-2030
      1. (USD MILLION) 108
    128. RUSSIA: COMPOSITES MARKET, BY TYPE, 2022-2030 (KILO
      1. TONS) 108
    129. RUSSIA: COMPOSITES MARKET, BY RESIN TYPE, 2022-2030 (USD
      1. MILLION) 109
    130. RUSSIA: COMPOSITES MARKET, BY RESIN TYPE, 2022-2030 (KILO
      1. TONS) 109
    131. RUSSIA: COMPOSITES MARKET, BY PROCESS, 2022-2030 (USD MILLION)
      1. 110
    132. RUSSIA: COMPOSITES MARKET, BY PROCESS, 2022-2030 (KILO TONS) 110
    133. RUSSIA: COMPOSITES MARKET, BY END-USE, 2022-2030 (USD MILLION) 111
    134. RUSSIA: COMPOSITES MARKET, BY END-USE, 2022-2030 (KILO TONS) 111
      1. TABLE
    135. UK: COMPOSITES MARKET, BY TYPE, 2022-2030 (USD MILLION) 112
    136. UK:
    137. COMPOSITES MARKET, BY TYPE, 2022-2030 (KILO TONS) 112
    138. UK: COMPOSITES
    139. MARKET, BY RESIN TYPE, 2022-2030 (USD MILLION) 113
    140. UK: COMPOSITES
    141. MARKET, BY RESIN TYPE, 2022-2030 (KILO TONS) 113
    142. UK: COMPOSITES MARKET,
      1. BY PROCESS, 2022-2030 (USD MILLION) 114
    143. UK: COMPOSITES MARKET, BY
      1. PROCESS, 2022-2030 (KILO TONS) 114
    144. UK: COMPOSITES MARKET, BY END-USE,
    145. UK: COMPOSITES MARKET, BY END-USE, 2022-2030
      1. (KILO TONS) 115
    146. ITALY: COMPOSITES MARKET, BY TYPE, 2022-2030 (USD
      1. MILLION) 116
    147. ITALY: COMPOSITES MARKET, BY TYPE, 2022-2030 (KILO TONS)
      1. 116
    148. ITALY: COMPOSITES MARKET, BY RESIN TYPE, 2022-2030 (USD MILLION)
      1. 117
    149. ITALY: COMPOSITES MARKET, BY RESIN TYPE, 2022-2030 (KILO TONS)
      1. 117
    150. ITALY: COMPOSITES MARKET, BY PROCESS, 2022-2030 (USD MILLION)
      1. 118
    151. ITALY: COMPOSITES MARKET, BY PROCESS, 2022-2030 (KILO TONS) 118
    152. ITALY: COMPOSITES MARKET, BY END-USE, 2022-2030 (USD MILLION) 119
    153. ITALY: COMPOSITES MARKET, BY END-USE, 2022-2030 (KILO TONS) 119
      1. TABLE
    154. FRANCE: COMPOSITES MARKET, BY TYPE, 2022-2030 (USD MILLION) 120
      1. TABLE 117
    155. FRANCE: COMPOSITES MARKET, BY TYPE, 2022-2030 (KILO TONS) 120
    156. FRANCE:
    157. COMPOSITES MARKET, BY RESIN TYPE, 2022-2030 (USD MILLION) 121
    158. FRANCE:
    159. COMPOSITES MARKET, BY RESIN TYPE, 2022-2030 (KILO TONS) 121
    160. FRANCE:
    161. COMPOSITES MARKET, BY PROCESS, 2022-2030 (USD MILLION) 122
    162. FRANCE:
    163. COMPOSITES MARKET, BY PROCESS, 2022-2030 (KILO TONS) 122
    164. FRANCE:
    165. COMPOSITES MARKET, BY END-USE, 2022-2030 (USD MILLION) 123
    166. FRANCE:
    167. COMPOSITES MARKET, BY END-USE, 2022-2030 (KILO TONS) 123
    168. SPAIN: COMPOSITES
    169. MARKET, BY TYPE, 2022-2030 (USD MILLION) 124
    170. SPAIN: COMPOSITES MARKET,
      1. BY TYPE, 2022-2030 (KILO TONS) 124
    171. SPAIN: COMPOSITES MARKET, BY RESIN
      1. TYPE, 2022-2030 (USD MILLION) 125
    172. SPAIN: COMPOSITES MARKET, BY RESIN
      1. TYPE, 2022-2030 (KILO TONS) 125
    173. SPAIN: COMPOSITES MARKET, BY PROCESS,
    174. SPAIN: COMPOSITES MARKET, BY PROCESS,
    175. SPAIN: COMPOSITES MARKET, BY END-USE, 2022-2030
      1. (USD MILLION) 127
    176. SPAIN: COMPOSITES MARKET, BY END-USE, 2022-2030
      1. (KILO TONS) 127
    177. REST OF EUROPE: COMPOSITES MARKET, BY TYPE, 2022-2030
      1. (USD MILLION) 128
    178. REST OF EUROPE: COMPOSITES MARKET, BY TYPE, 2022-2030
      1. (KILO TONS) 128
    179. REST OF EUROPE: COMPOSITES MARKET, BY RESIN TYPE,
    180. REST OF EUROPE: COMPOSITES MARKET, BY
      1. RESIN TYPE, 2022-2030 (KILO TONS) 129
    181. REST OF EUROPE: COMPOSITES
    182. MARKET, BY PROCESS, 2022-2030 (USD MILLION) 130
    183. REST OF EUROPE: COMPOSITES
    184. MARKET, BY PROCESS, 2022-2030 (KILO TONS) 130
    185. REST OF EUROPE: COMPOSITES
    186. MARKET, BY END-USE, 2022-2030 (USD MILLION) 131
    187. REST OF EUROPE: COMPOSITES
    188. MARKET, BY END-USE, 2022-2030 (KILO TONS) 131
    189. ASIA-PACIFIC: COMPOSITES
    190. MARKET, BY COUNTRY, 2022-2030 (USD MILLION) 132
    191. ASIA-PACIFIC: COMPOSITES
    192. MARKET, BY COUNTRY, 2022-2030 (KILO TONS) 133
    193. ASIA-PACIFIC: COMPOSITES
    194. MARKET, BY TYPE, 2022-2030 (USD MILLION) 133
    195. ASIA-PACIFIC: COMPOSITES
    196. MARKET, BY TYPE, 2022-2030 (KILO TONS) 134
    197. ASIA-PACIFIC: COMPOSITES
    198. MARKET, BY RESIN TYPE, 2022-2030 (USD MILLION) 134
    199. ASIA-PACIFIC:
    200. COMPOSITES MARKET, BY RESIN TYPE, 2022-2030 (KILO TONS) 134
    201. ASIA-PACIFIC:
    202. COMPOSITES MARKET, BY PROCESS, 2022-2030 (USD MILLION) 135
    203. ASIA-PACIFIC:
    204. COMPOSITES MARKET, BY PROCESS, 2022-2030 (KILO TONS) 135
    205. ASIA-PACIFIC:
    206. COMPOSITES MARKET, BY END-USE, 2022-2030 (USD MILLION) 136
    207. ASIA-PACIFIC:
    208. COMPOSITES MARKET, BY END-USE, 2022-2030 (KILO TONS) 136
    209. CHINA: COMPOSITES
    210. MARKET, BY TYPE, 2022-2030 (USD MILLION) 137
    211. CHINA: COMPOSITES MARKET,
      1. BY TYPE, 2022-2030 (KILO TONS) 137
    212. CHINA: COMPOSITES MARKET, BY RESIN
      1. TYPE, 2022-2030 (USD MILLION) 138
    213. CHINA: COMPOSITES MARKET, BY RESIN
      1. TYPE, 2022-2030 (KILO TONS) 138
    214. CHINA: COMPOSITES MARKET, BY PROCESS,
    215. CHINA: COMPOSITES MARKET, BY PROCESS,
    216. CHINA: COMPOSITES MARKET, BY END-USE, 2022-2030
      1. (USD MILLION) 140
    217. CHINA: COMPOSITES MARKET, BY END-USE, 2022-2030
      1. (KILO TONS) 140
    218. JAPAN: COMPOSITES MARKET, BY TYPE, 2022-2030 (USD
      1. MILLION) 141
    219. JAPAN: COMPOSITES MARKET, BY TYPE, 2022-2030 (KILO TONS)
      1. 141
    220. JAPAN: COMPOSITES MARKET, BY RESIN TYPE, 2022-2030 (USD MILLION)
      1. 142
    221. JAPAN: COMPOSITES MARKET, BY RESIN TYPE, 2022-2030 (KILO TONS)
      1. 142
    222. JAPAN: COMPOSITES MARKET, BY PROCESS, 2022-2030 (USD MILLION)
      1. 143
    223. JAPAN: COMPOSITES MARKET, BY PROCESS, 2022-2030 (KILO TONS) 143
    224. JAPAN: COMPOSITES MARKET, BY END-USE, 2022-2030 (USD MILLION) 144
    225. JAPAN: COMPOSITES MARKET, BY END-USE, 2022-2030 (KILO TONS) 144
      1. TABLE
    226. INDIA: COMPOSITES MARKET, BY TYPE, 2022-2030 (USD MILLION) 145
      1. TABLE 167
    227. INDIA: COMPOSITES MARKET, BY TYPE, 2022-2030 (KILO TONS) 145
    228. INDIA:
    229. COMPOSITES MARKET, BY RESIN TYPE, 2022-2030 (USD MILLION) 146
    230. INDIA:
    231. COMPOSITES MARKET, BY RESIN TYPE, 2022-2030 (KILO TONS) 146
    232. INDIA:
    233. COMPOSITES MARKET, BY PROCESS, 2022-2030 (USD MILLION) 147
    234. INDIA:
    235. COMPOSITES MARKET, BY PROCESS, 2022-2030 (KILO TONS) 147
    236. INDIA: COMPOSITES
    237. MARKET, BY END-USE, 2022-2030 (USD MILLION) 148
    238. INDIA: COMPOSITES
    239. MARKET, BY END-USE, 2022-2030 (KILO TONS) 148
    240. SOUTH KOREA: COMPOSITES
    241. MARKET, BY TYPE, 2022-2030 (USD MILLION) 149
    242. SOUTH KOREA: COMPOSITES
    243. MARKET, BY GARDE, 2022-2030 (KILO TONS) 149
    244. SOUTH KOREA: COMPOSITES
    245. MARKET, BY RESIN TYPE, 2022-2030 (USD MILLION) 150
    246. SOUTH KOREA: COMPOSITES
    247. MARKET, BY RESIN TYPE, 2022-2030 (KILO TONS) 150
    248. SOUTH KOREA: COMPOSITES
    249. MARKET, BY PROCESS, 2022-2030 (USD MILLION) 151
    250. SOUTH KOREA: COMPOSITES
    251. MARKET, BY PROCESS, 2022-2030 (KILO TONS) 151
    252. SOUTH KOREA: COMPOSITES
    253. MARKET, BY END-USE, 2022-2030 (USD MILLION) 152
    254. SOUTH KOREA: COMPOSITES
    255. MARKET, BY END-USE, 2022-2030 (KILO TONS) 152
    256. AUSTRALIA & NEW
    257. ZEALAND: COMPOSITES MARKET, BY TYPE, 2022-2030 (USD MILLION) 153
      1. TABLE 183
    258. AUSTRALIA & NEW ZEALAND: COMPOSITES MARKET, BY TYPE, 2022-2030 (KILO TONS) 153
    259. AUSTRALIA & NEW ZEALAND: COMPOSITES MARKET, BY RESIN TYPE, 2022-2030
      1. (USD MILLION) 154
    260. AUSTRALIA & NEW ZEALAND: COMPOSITES MARKET,
      1. BY RESIN TYPE, 2022-2030 (KILO TONS) 154
    261. AUSTRALIA & NEW ZEALAND:
    262. COMPOSITES MARKET, BY PROCESS, 2022-2030 (USD MILLION) 155
    263. AUSTRALIA
    264. & NEW ZEALAND: COMPOSITES MARKET, BY PROCESS, 2022-2030 (KILO TONS) 155
      1. TABLE
    265. AUSTRALIA & NEW ZEALAND: COMPOSITES MARKET, BY END-USE, 2022-2030 (USD MILLION)
      1. 156
    266. AUSTRALIA & NEW ZEALAND: COMPOSITES MARKET, BY END-USE, 2022-2030
      1. (KILO TONS) 156
    267. REST OF ASIA-PACIFIC: COMPOSITES MARKET, BY TYPE,
    268. REST OF ASIA-PACIFIC: COMPOSITES MARKET,
      1. BY TYPE, 2022-2030 (KILO TONS) 157
    269. REST OF ASIA-PACIFIC: COMPOSITES
    270. MARKET, BY RESIN TYPE, 2022-2030 (USD MILLION) 158
    271. REST OF ASIA-PACIFIC:
    272. COMPOSITES MARKET, BY RESIN TYPE, 2022-2030 (KILO TONS) 158
    273. REST
    274. OF ASIA-PACIFIC: COMPOSITES MARKET, BY PROCESS, 2022-2030 (USD MILLION) 159
      1. TABLE
    275. REST OF ASIA-PACIFIC: COMPOSITES MARKET, BY PROCESS, 2022-2030 (KILO TONS) 159
    276. REST OF ASIA-PACIFIC: COMPOSITES MARKET, BY END-USE, 2022-2030 (USD
      1. MILLION) 160
    277. REST OF ASIA-PACIFIC: COMPOSITES MARKET, BY END-USE,
    278. LATIN AMERICA: COMPOSITES MARKET, BY COUNTRY,
    279. LATIN AMERICA: COMPOSITES MARKET, BY
      1. COUNTRY, 2022-2030 (KILO TONS) 162
    280. LATIN AMERICA: COMPOSITES MARKET,
      1. BY TYPE, 2022-2030 (USD MILLION) 162
    281. LATIN AMERICA: COMPOSITES MARKET,
      1. BY TYPE, 2022-2030 (KILO TONS) 163
    282. LATIN AMERICA: COMPOSITES MARKET,
      1. BY RESIN TYPE, 2022-2030 (USD MILLION) 163
    283. LATIN AMERICA: COMPOSITES
    284. MARKET, BY RESIN TYPE, 2022-2030 (KILO TONS) 163
    285. LATIN AMERICA: COMPOSITES
    286. MARKET, BY PROCESS, 2022-2030 (USD MILLION) 164
    287. LATIN AMERICA: COMPOSITES
    288. MARKET, BY PROCESS, 2022-2030 (KILO TONS) 164
    289. LATIN AMERICA: COMPOSITES
    290. MARKET, BY END-USE, 2022-2030 (USD MILLION) 165
    291. LATIN AMERICA: COMPOSITES
    292. MARKET, BY END-USE, 2022-2030 (KILO TONS) 165
    293. BRAZIL: COMPOSITES
    294. MARKET, BY TYPE, 2022-2030 (USD MILLION) 166
    295. BRAZIL: COMPOSITES MARKET,
      1. BY TYPE, 2022-2030 (KILO TONS) 166
    296. BRAZIL: COMPOSITES MARKET, BY
      1. RESIN TYPE, 2022-2030 (USD MILLION) 167
    297. BRAZIL: COMPOSITES MARKET,
      1. BY RESIN TYPE, 2022-2030 (KILO TONS) 167
    298. BRAZIL: COMPOSITES MARKET,
      1. BY PROCESS, 2022-2030 (USD MILLION) 168
    299. BRAZIL: COMPOSITES MARKET,
      1. BY PROCESS, 2022-2030 (KILO TONS) 168
    300. BRAZIL: COMPOSITES MARKET,
      1. BY END-USE, 2022-2030 (USD MILLION) 169
    301. BRAZIL: COMPOSITES MARKET,
      1. BY END-USE, 2022-2030 (KILO TONS) 169
    302. MEXICO: COMPOSITES MARKET,
      1. BY TYPE, 2022-2030 (USD MILLION) 170
    303. MEXICO: COMPOSITES MARKET, BY
      1. TYPE, 2022-2030 (KILO TONS) 170
    304. MEXICO: COMPOSITES MARKET, BY RESIN
      1. TYPE, 2022-2030 (USD MILLION) 171
    305. MEXICO: COMPOSITES MARKET, BY RESIN
      1. TYPE, 2022-2030 (KILO TONS) 171
    306. MEXICO: COMPOSITES MARKET, BY PROCESS,
    307. MEXICO: COMPOSITES MARKET, BY PROCESS,
    308. MEXICO: COMPOSITES MARKET, BY END-USE,
    309. MEXICO: COMPOSITES MARKET, BY END-USE,
    310. ARGENTINA: COMPOSITES MARKET, BY TYPE,
    311. ARGENTINA: COMPOSITES MARKET, BY TYPE,
    312. ARGENTINA: COMPOSITES MARKET, BY RESIN
      1. TYPE, 2022-2030 (USD MILLION) 175
    313. ARGENTINA: COMPOSITES MARKET, BY
      1. RESIN TYPE, 2022-2030 (KILO TONS) 175
    314. ARGENTINA: COMPOSITES MARKET,
      1. BY PROCESS, 2022-2030 (USD MILLION) 176
    315. ARGENTINA: COMPOSITES MARKET,
      1. BY PROCESS, 2022-2030 (KILO TONS) 176
    316. ARGENTINA: COMPOSITES MARKET,
      1. BY END-USE, 2022-2030 (USD MILLION) 177
    317. ARGENTINA: COMPOSITES MARKET,
      1. BY END-USE, 2022-2030 (KILO TONS) 177
    318. REST OF LATIN AMERICA: COMPOSITES
    319. MARKET, BY TYPE, 2022-2030 (USD MILLION) 178
    320. REST OF LATIN AMERICA:
    321. COMPOSITES MARKET, BY TYPE, 2022-2030 (KILO TONS) 178
    322. REST OF LATIN
    323. AMERICA: COMPOSITES MARKET, BY RESIN TYPE, 2022-2030 (USD MILLION) 179
      1. TABLE
    324. REST OF LATIN AMERICA: COMPOSITES MARKET, BY RESIN TYPE, 2022-2030 (KILO TONS)
      1. 179
    325. REST OF LATIN AMERICA: COMPOSITES MARKET, BY PROCESS, 2022-2030
      1. (USD MILLION) 180
    326. REST OF LATIN AMERICA: COMPOSITES MARKET, BY PROCESS,
    327. REST OF LATIN AMERICA: COMPOSITES MARKET,
      1. BY END-USE, 2022-2030 (USD MILLION) 181
    328. REST OF LATIN AMERICA: COMPOSITES
    329. MARKET, BY END-USE, 2022-2030 (KILO TONS) 181
    330. MIDDLE EAST & AFRICA:
    331. COMPOSITES MARKET, BY COUNTRY, 2022-2030 (USD MILLION) 182
    332. MIDDLE
    333. EAST & AFRICA: COMPOSITES MARKET, BY COUNTRY, 2022-2030 (KILO TONS) 183
      1. TABLE
    334. MIDDLE EAST & AFRICA: COMPOSITES MARKET, BY TYPE, 2022-2030 (USD MILLION)
      1. 183
    335. MIDDLE EAST & AFRICA: COMPOSITES MARKET, BY TYPE, 2022-2030
      1. (KILO TONS) 184
    336. MIDDLE EAST & AFRICA: COMPOSITES MARKET, BY RESIN
      1. TYPE, 2022-2030 (USD MILLION) 184
    337. MIDDLE EAST & AFRICA: COMPOSITES
    338. MARKET, BY RESIN TYPE, 2022-2030 (KILO TONS) 184
    339. MIDDLE EAST &
    340. AFRICA: COMPOSITES MARKET, BY PROCESS, 2022-2030 (USD MILLION) 185
      1. TABLE 247
    341. MIDDLE EAST & AFRICA: COMPOSITES MARKET, BY PROCESS, 2022-2030 (KILO TONS) 185
    342. MIDDLE EAST & AFRICA: COMPOSITES MARKET, BY END-USE, 2022-2030 (USD
      1. MILLION) 186
    343. MIDDLE EAST & AFRICA: COMPOSITES MARKET, BY END-USE,
    344. TURKEY: COMPOSITES MARKET, BY TYPE, 2022-2030
      1. (USD MILLION) 187
    345. TURKEY: COMPOSITES MARKET, BY TYPE, 2022-2030 (KILO
      1. TONS) 187
    346. TURKEY: COMPOSITES MARKET, BY RESIN TYPE, 2022-2030 (USD
      1. MILLION) 188
    347. TURKEY: COMPOSITES MARKET, BY RESIN TYPE, 2022-2030
      1. (KILO TONS) 188
    348. TURKEY: COMPOSITES MARKET, BY PROCESS, 2022-2030
      1. (USD MILLION) 189
    349. TURKEY: COMPOSITES MARKET, BY PROCESS, 2022-2030
      1. (KILO TONS) 189
    350. TURKEY: COMPOSITES MARKET, BY END-USE, 2022-2030
      1. (USD MILLION) 190
    351. TURKEY: COMPOSITES MARKET, BY END-USE, 2022-2030
      1. (KILO TONS) 190
    352. SOUTH AFRICA: COMPOSITES MARKET, BY TYPE, 2022-2030
      1. (USD MILLION) 191
    353. SOUTH AFRICA: COMPOSITES MARKET, BY TYPE, 2022-2030
      1. (KILO TONS) 191
    354. SOUTH AFRICA: COMPOSITES MARKET, BY RESIN TYPE, 2022-2030
      1. (USD MILLION) 192
    355. SOUTH AFRICA: COMPOSITES MARKET, BY RESIN TYPE,
    356. SOUTH AFRICA: COMPOSITES MARKET, BY PROCESS,
    357. SOUTH AFRICA: COMPOSITES MARKET, BY PROCESS,
    358. SOUTH AFRICA: COMPOSITES MARKET, BY END-USE,
    359. SOUTH AFRICA: COMPOSITES MARKET, BY END-USE,
    360. GCC COUNTRIES: COMPOSITES MARKET, BY TYPE,
    361. GCC COUNTRIES: COMPOSITES MARKET, BY
      1. TYPE, 2022-2030 (KILO TONS) 195
    362. GCC COUNTRIES: COMPOSITES MARKET,
      1. BY RESIN TYPE, 2022-2030 (USD MILLION) 196
    363. GCC COUNTRIES: COMPOSITES
    364. MARKET, BY RESIN TYPE, 2022-2030 (KILO TONS) 196
    365. GCC COUNTRIES: COMPOSITES
    366. MARKET, BY PROCESS, 2022-2030 (USD MILLION) 197
    367. GCC COUNTRIES: COMPOSITES
    368. MARKET, BY PROCESS, 2022-2030 (KILO TONS) 197
    369. GCC COUNTRIES: COMPOSITES
    370. MARKET, BY END-USE, 2022-2030 (USD MILLION) 198
    371. GCC COUNTRIES: COMPOSITES
    372. MARKET, BY END-USE, 2022-2030 (KILO TONS) 198
    373. REST OF THE MIDDLE
    374. EAST & AFRICA: COMPOSITES MARKET, BY TYPE, 2022-2030 (USD MILLION) 199
      1. TABLE
    375. REST OF THE MIDDLE EAST & AFRICA: COMPOSITES MARKET, BY TYPE, 2022-2030
      1. (KILO TONS) 199
    376. REST OF THE MIDDLE EAST & AFRICA: COMPOSITES
    377. MARKET, BY RESIN TY

    Composites Type Outlook (USD Million, 2019-2030)

    • Glass Fiber
    • Carbon Fiber
    • Others

    Composites Resin Type Outlook (USD Million, 2019-2030)

    • Thermoplastic Composites
    • Thermosetting Composites

    Composites Process Outlook (USD Million, 2019-2030)

    • Layup Process
    • Injection Molding Process
    • Filament Winding Process
    • Pultrusion Process
    • Compression Molding Process
    • Others


    Composites End-use Outlook (USD Million, 2019-2030)

    • Aerospace & Defense
    • Automotive & Transportation
    • Electrical & Electronics
    • Building & Construction
    • Wind Energy
    • Marine
    • Others

    Composites Regional Outlook (USD Million, 2019-2030)

    • North America Outlook (USD Million, 2019-2030)

      • North America Composites by Type
        • Glass Fiber
        • Carbon Fiber
        • Others
      • North America Composites by Resin Type

        • Thermoplastic Composites
        • Thermosetting Composites
      • North America Composites by Process
        • Layup Process
        • Injection Molding Process
        • Filament Winding Process
        • Pultrusion Process
        • Compression Molding Process
        • Others
      • North America Composites by End-use
        • Aerospace & Defense
        • Automotive & Transportation
        • Electrical & Electronics
        • Building & Construction
        • Wind Energy
        • Marine
        • Others


      • US Outlook (USD Million, 2019-2030)

      • US Composites by Type
        • Glass Fiber
        • Carbon Fiber
        • Others
      • US Composites by Resin Type

        • Thermoplastic Composites
        • Thermosetting Composites
      • US Composites by Process
        • Layup Process
        • Injection Molding Process
        • Filament Winding Process
        • Pultrusion Process
        • Compression Molding Process
        • Others
      • US Composites by End-use
        • Aerospace & Defense
        • Automotive & Transportation
        • Electrical & Electronics
        • Building & Construction
        • Wind Energy
        • Marine
        • Others
      • CANADA Outlook (USD Million, 2019-2030)

      • CANADA Composites by Type
        • Glass Fiber
        • Carbon Fiber
        • Others
      • Canada Composites by Resin Type

        • Thermoplastic Composites
        • Thermosetting Composites
      • Canada Composites by Process
        • Layup Process
        • Injection Molding Process
        • Filament Winding Process
        • Pultrusion Process
        • Compression Molding Process
        • Others
      • CANADA Composites by End-use
        • Aerospace & Defense
        • Automotive & Transportation
        • Electrical & Electronics
        • Building & Construction
        • Wind Energy
        • Marine
        • Automotive
        • Catalyst
        • Others
    • Europe Outlook (USD Million, 2019-2030)

      • Europe Composites by Type
        • Glass Fiber
        • Carbon Fiber
        • Others
      • Europe Composites by Resin Type

        • Thermoplastic Composites
        • Thermosetting Composites
      • Europe Composites by Process
        • Layup Process
        • Injection Molding Process
        • Filament Winding Process
        • Pultrusion Process
        • Compression Molding Process
        • Others
      • Europe Composites by End-use
        • Aerospace & Defense
        • Automotive & Transportation
        • Electrical & Electronics
        • Building & Construction
        • Wind Energy
        • Marine
        • Others
      • Germany Outlook (USD Million, 2019-2030)

      • Germany Composites by Type
        • Glass Fiber
        • Carbon Fiber
        • Others
      • Germany Composites by Resin Type

        • Thermoplastic Composites
        • Thermosetting Composites
      • North America Composites by Process
        • Layup Process
        • Injection Molding Process
        • Filament Winding Process
        • Pultrusion Process
        • Compression Molding Process
        • Others
      • Germany Composites by End-use
        • Aerospace & Defense
        • Automotive & Transportation
        • Electrical & Electronics
        • Building & Construction
        • Wind Energy
        • Marine
        • Others
      • France Outlook (USD Million, 2019-2030)

      • France Composites by Type
        • Glass Fiber
        • Carbon Fiber
        • Others
      • France Composites by Resin Type

        • Thermoplastic Composites
        • Thermosetting Composites
      • France Composites by Process
        • Layup Process
        • Injection Molding Process
        • Filament Winding Process
        • Pultrusion Process
        • Compression Molding Process
        • Others
      • France Composites by End-use
        • Aerospace & Defense
        • Automotive & Transportation
        • Electrical & Electronics
        • Building & Construction
        • Wind Energy
        • Marine
        • Others
      • UK Outlook (USD Million, 2019-2030)

      • UK Composites by Type
        • Glass Fiber
        • Carbon Fiber
        • Others
      • UK Composites by Resin Type

        • Thermoplastic Composites
        • Thermosetting Composites
      • UK Composites by Process
        • Layup Process
        • Injection Molding Process
        • Filament Winding Process
        • Pultrusion Process
        • Compression Molding Process
        • Others
      • UK Composites by End-use
        • Aerospace & Defense
        • Automotive & Transportation
        • Electrical & Electronics
        • Building & Construction
        • Wind Energy
        • Marine
        • Others
      • ITALY Outlook (USD Million, 2019-2030)

      • ITALY Composites by Type
        • Glass Fiber
        • Carbon Fiber
        • Others
      • Italy Composites by Resin Type

        • Thermoplastic Composites
        • Thermosetting Composites
      • Italy Composites by Process
        • Layup Process
        • Injection Molding Process
        • Filament Winding Process
        • Pultrusion Process
        • Compression Molding Process
      • Others
      • ITALY Composites by End-use
        • Aerospace & Defense
        • Automotive & Transportation
        • Electrical & Electronics
        • Building & Construction
        • Wind Energy
        • Marine
        • Others


      • SPAIN Outlook (USD Million, 2019-2030)

      • Spain Composites by Type
        • Glass Fiber
        • Carbon Fiber
        • Others
      • Spain Composites by Resin Type

        • Thermoplastic Composites
        • Thermosetting Composites
      • Spain Composites by Process
        • Layup Process
        • Injection Molding Process
        • Filament Winding Process
        • Pultrusion Process
        • Compression Molding Process
        • Others
      • Spain Composites by End-use
        • Aerospace & Defense
        • Automotive & Transportation
        • Electrical & Electronics
        • Building & Construction
        • Wind Energy
        • Marine
        • Others
      • Rest Of Europe Outlook (USD Million, 2019-2030)

      • Rest Of Europe Composites by Type
        • Glass Fiber
        • Carbon Fiber
        • Others
      • Rest Of Europe Composites by Resin Type

        • Thermoplastic Composites
        • Thermosetting Composites
      • Rest Of Europe Composites by Process
        • Layup Process
        • Injection Molding Process
        • Filament Winding Process
        • Pultrusion Process
        • Compression Molding Process
        • Others
      • REST OF EUROPE Composites by End-use
        • Aerospace & Defense
        • Automotive & Transportation
        • Electrical & Electronics
        • Building & Construction
        • Wind Energy
        • Marine
        • Others
    • Asia-Pacific Outlook (USD Million, 2019-2030)

      • Asia-Pacific Composites by Type
        • Glass Fiber
        • Carbon Fiber
        • Others
      • Asia-Pacific Composites by Resin Type

        • Thermoplastic Composites
        • Thermosetting Composites
      • Asia-Pacific Composites by Process
        • Layup Process
        • Injection Molding Process
        • Filament Winding Process
        • Pultrusion Process
        • Compression Molding Process
        • Others
      • Asia-Pacific Composites by End-use
        • Aerospace & Defense
        • Automotive & Transportation
        • Electrical & Electronics
        • Building & Construction
        • Wind Energy
        • Marine
        • Others
      • China Outlook (USD Million, 2019-2030)

      • China Composites by Type
        • Glass Fiber
        • Carbon Fiber
        • Others
      • China Composites by Resin Type

        • Thermoplastic Composites
        • Thermosetting Composites
      • China Composites by Process
        • Layup Process
        • Injection Molding Process
        • Filament Winding Process
        • Pultrusion Process
        • Compression Molding Process
        • Others
      • China Composites by End-use
        • Aerospace & Defense
        • Automotive & Transportation
        • Electrical & Electronics
        • Building & Construction
        • Wind Energy
        • Marine
        • Others
      • Japan Outlook (USD Million, 2019-2030)

      • Japan Composites by Type
        • Glass Fiber
        • Carbon Fiber
        • Others
      • Japan Composites by Resin Type

        • Thermoplastic Composites
        • Thermosetting Composites
      • Japan Composites by Process
        • Layup Process
        • Injection Molding Process
        • Filament Winding Process
        • Pultrusion Process
        • Compression Molding Process
        • Others
      • Japan Composites by End-use
        • Aerospace & Defense
        • Automotive & Transportation
        • Electrical & Electronics
        • Building & Construction
        • Wind Energy
        • Marine
        • Others
      • India Outlook (USD Million, 2019-2030)

      • India Composites by Type
        • Glass Fiber
        • Carbon Fiber
        • Others
      • India Composites by Resin Type

        • Thermoplastic Composites
        • Thermosetting Composites
      • India Composites by Process
        • Layup Process
        • Injection Molding Process
        • Filament Winding Process
        • Pultrusion Process
        • Compression Molding Process
        • Others
      • India Composites by End-use
        • Aerospace & Defense
        • Automotive & Transportation
        • Electrical & Electronics
        • Building & Construction
        • Wind Energy
        • Marine
        • Others
      • Australia Outlook (USD Million, 2019-2030)

      • Australia Composites by Type
        • Glass Fiber
        • Carbon Fiber
        • Others
      • Australia Composites by Resin Type

        • Thermoplastic Composites
        • Thermosetting Composites
      • Australia Composites by Process
        • Layup Process
        • Injection Molding Process
        • Filament Winding Process
        • Pultrusion Process
        • Compression Molding Process
        • Others
      • Australia Composites by End-use
        • Aerospace & Defense
        • Automotive & Transportation
        • Electrical & Electronics
        • Building & Construction
        • Wind Energy
        • Marine
        • Others
      • Rest of Asia-Pacific Outlook (USD Million, 2019-2030)

      • Rest of Asia-Pacific Composites by Type
        • Glass Fiber
        • Carbon Fiber
        • Others
      • Rest Of Asia-Pacific Composites by Resin Type

        • Thermoplastic Composites
        • Thermosetting Composites
      • Rest Of Asia-Pacific Composites by Process
        • Layup Process
        • Injection Molding Process
        • Filament Winding Process
        • Pultrusion Process
        • Compression Molding Process
        • Others
      • Rest of Asia-Pacific Composites by End-use
        • Aerospace & Defense
        • Automotive & Transportation
        • Electrical & Electronics
        • Building & Construction
        • Wind Energy
        • Marine
        • Others
    • Latin America Outlook (USD Million, 2019-2030)

      • Latin America Composites by Type
        • Glass Fiber
        • Carbon Fiber
        • Others
      • Latin America Composites by Resin Type

        • Thermoplastic Composites
        • Thermosetting Composites
      • Latin America Composites by Process
        • Layup Process
        • Injection Molding Process
        • Filament Winding Process
        • Pultrusion Process
        • Compression Molding Process
        • Others
      • Latin America Composites by End-use
        • Aerospace & Defense
        • Automotive & Transportation
        • Electrical & Electronics
        • Building & Construction
        • Wind Energy
        • Marine
        • Others
      • Mexico Outlook (USD Million, 2019-2030)

      • Mexico Composites by Type
        • Glass Fiber
        • Carbon Fiber
        • Others
      • Mexico Composites by Resin Type

        • Thermoplastic Composites
        • Thermosetting Composites
      • Mexico Composites by Process
        • Layup Process
        • Injection Molding Process
        • Filament Winding Process
        • Pultrusion Process
        • Compression Molding Process
        • Others
      • Mexico Composites by End-use
        • Aerospace & Defense
        • Automotive & Transportation
        • Electrical & Electronics
        • Building & Construction
        • Wind Energy
        • Marine
        • Others
      • Brazil Outlook (USD Million, 2019-2030)

      • Brazil Composites by Type
        • Glass Fiber
        • Carbon Fiber
        • Others
      • Brazil Composites by Resin Type

        • Thermoplastic Composites
        • Thermosetting Composites
      • Brazil Composites by Process
        • Layup Process
        • Injection Molding Process
        • Filament Winding Process
        • Pultrusion Process
        • Compression Molding Process
        • Others
      • Brazil Composites by End-use

        • Aerospace & Defense
        • Automotive & Transportation
        • Electrical & Electronics
        • Building & Construction
        • Wind Energy
        • Marine
        • Others
      • Argentina Outlook (USD Million, 2019-2030)

      • Argentina Composites by Type
        • Glass Fiber
        • Carbon Fiber
        • Others
      • Argentina Composites by Resin Type

        • Thermoplastic Composites
        • Thermosetting Composites
      • Argentina Composites by Process
        • Layup Process
        • Injection Molding Process
        • Filament Winding Process
        • Pultrusion Process
        • Compression Molding Process
        • Others
      • Argentina Composites by End-use

        • Aerospace & Defense
        • Automotive & Transportation
        • Electrical & Electronics
        • Building & Construction
        • Wind Energy
        • Marine
        • Others
      • Rest of Latin America Outlook (USD Million, 2019-2030)

      • Rest of Latin America Composites by Type
        • Glass Fiber
        • Carbon Fiber
        • Others
      • Rest Of Latin America Composites by Resin Type

        • Thermoplastic Composites
        • Thermosetting Composites
      • Rest of Latin America Composites by Process
        • Layup Process
        • Injection Molding Process
        • Filament Winding Process
        • Pultrusion Process
        • Compression Molding Process
        • Others
      • Rest of Latin America Composites by End-use

        • Aerospace & Defense
        • Automotive & Transportation
        • Electrical & Electronics
        • Building & Construction
        • Wind Energy
        • Marine
        • Others
    • Middle East & Africa Outlook (USD Million, 2019-2030)

      • Middle East & Africa Composites by Type
        • Glass Fiber
        • Carbon Fiber
        • Others
      • Middle East & Africa Composites by Resin Type

        • Thermoplastic Composites
        • Thermosetting Composites
      • Middle East & Africa Composites by Process
        • Layup Process
        • Injection Molding Process
        • Filament Winding Process
        • Pultrusion Process
        • Compression Molding Process
        • Others
      • Middle East & Africa Composites by End-use

        • Aerospace & Defense
        • Automotive & Transportation
        • Electrical & Electronics
        • Building & Construction
        • Wind Energy
        • Marine
        • Others
      • GCC Countries Outlook (USD Million, 2019-2030)

      • GCC Countries Composites by Type

        • Glass Fiber
        • Carbon Fiber
        • Others
      • GCC Countries Composites by Resin Type

        • Thermoplastic Composites
        • Thermosetting Composites
      • GCC Countries Composites by Process
        • Layup Process
        • Injection Molding Process
        • Filament Winding Process
        • Pultrusion Process
        • Compression Molding Process
        • Others
      • GCC Countries Composites by End-use
        • Aerospace & Defense
        • Automotive & Transportation
        • Electrical & Electronics
        • Building & Construction
        • Wind Energy
        • Marine
        • Others
      • South Africa Outlook (USD Million, 2019-2030)

      • South Africa Composites by Type
        • Glass Fiber
        • Carbon Fiber
        • Others
      • South Africa Composites by Resin Type

        • Thermoplastic Composites
        • Thermosetting Composites
      • South Africa Composites by Process
        • Layup Process
        • Injection Molding Process
        • Filament Winding Process
        • Pultrusion Process
        • Compression Molding Process
        • Others
      • South Africa Composites by End-use

        • Aerospace & Defense
        • Automotive & Transportation
        • Electrical & Electronics
        • Building & Construction
        • Wind Energy
        • Marine
        • Other End-uses
      • Rest of Middle East & Africa Outlook (USD Million, 2019-2030)

      • Rest of Middle East & Africa Composites by Type
        • Glass Fiber
        • Carbon Fiber
        • Others
      • Rest Of Middle East & Africa Composites by Resin Type

        • Thermoplastic Composites
        • Thermosetting Composites
      • Rest Of Middle East & Africa Composites by Process
        • Layup Process
        • Injection Molding Process
        • Filament Winding Process
        • Pultrusion Process
        • Compression Molding Process
        • Others
      • Rest of Middle East & Africa Composites by End-use

        • Aerospace & Defense
        • Automotive & Transportation
        • Electrical & Electronics
        • Building & Construction
        • Wind Energy
        • Marine
        • Others


    Infographic

    Free Sample Request

    Kindly complete the form below to receive a free sample of this Report

    Get Free Sample

    Customer Strories

    “I am very pleased with how market segments have been defined in a relevant way for my purposes (such as "Portable Freezers & refrigerators" and "last-mile"). In general the report is well structured. Thanks very much for your efforts.”

    Victoria Milne

    Founder
    Case Study
    Chemicals and Materials

    Compare Licence

    ×
    Features License Type
    Single User Multiuser License Enterprise User
    Price $4,950 $5,950 $7,250
    Maximum User Access Limit 1 User Upto 10 Users Unrestricted Access Throughout the Organization
    Free Customization
    Direct Access to Analyst
    Deliverable Format
    Platform Access
    Discount on Next Purchase 10% 15% 15%
    Printable Versions