Request Free Sample ×

Kindly complete the form below to receive a free sample of this Report

* Please use a valid business email

Leading companies partner with us for data-driven Insights

clients tt-cursor
Hero Background

Connected Living Room Market

ID: MRFR/SEM/27113-HCR
128 Pages
Aarti Dhapte, Aarti Dhapte
Last Updated: June 01, 2026
Connected Living Room Market Size, Share and Research Report By Device Type (Smart TVs, Smart Speakers, Smart Lighting, Smart Home Hubs, Streaming Media Players), By Connectivity (Wi-Fi, Bluetooth, Zigbee, Z-Wave, NFC), By Control Interface (Voice Control, Remote Control, Smartphone/Tablet App, Touchscreen, Gesture Control), By Application (Entertainment, Lighting Control, Climate Control, Security and Surveillance, Home Automation), By Usage (Residential, Commercial, Industrial, Retail, Healthcare) and By Regional (North America, Europe, South America, Asia Pacific, Middle East and Africa) - Industry Forecast Till 2035
Download PDF ×

We do not share your information with anyone. However, we may send you emails based on your report interest from time to time. You may contact us at any time to opt-out.

Connected Living Room Market Summary

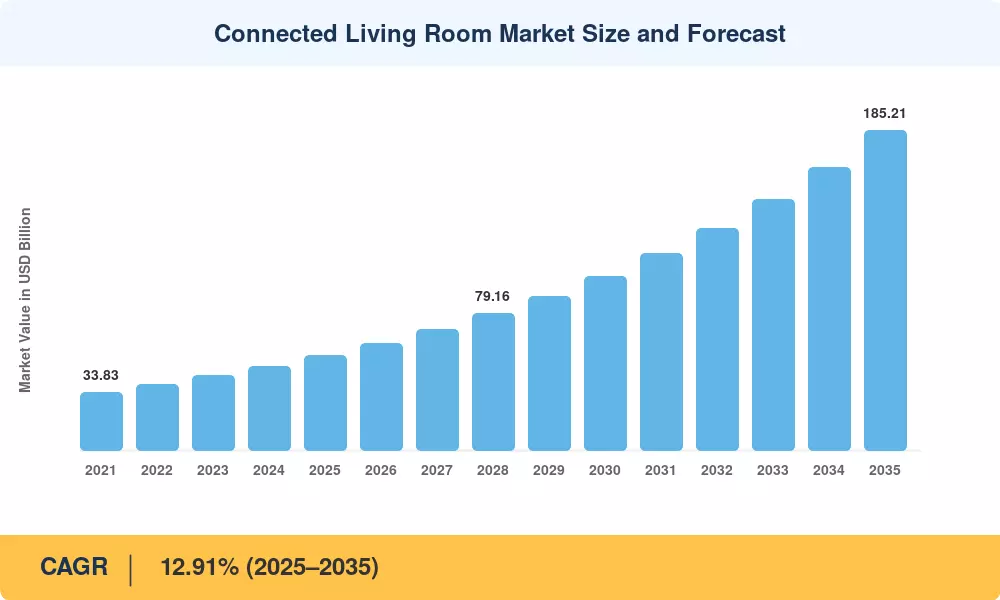
The connected living room market reached USD 64.92 billion in 2025 and is positioned to begin its forecast journey at roughly USD 70.51 billion in 2026, climbing to USD 154.18 billion by 2035 at an 8.61% CAGR. Two catalysts anchor this trajectory: the accelerating rollout of Wi-Fi 6E and Wi-Fi 7 infrastructure across residential broadband upgrades, and aggressive device-price compression driven by vertically integrated Asian manufacturers. Government broadband subsidy programs — including the US Broadband Equity, Access, and Deployment (BEAD) program with its USD 42.45 billion allocation — have widened the installed base of homes capable of supporting high-bandwidth connected home media devices.

Platform-centric ones are replacing hardware-centric business models. Integrated smart home display hubs and operating-system-driven smart TV home entertainment platforms that monetize via retail media and shoppable formats are replacing legacy standalone televisions and single-purpose set-top boxes. From 2023 to 2025, the industry invested more than USD 6 billion in cloud-delivered gaming infrastructure, growing the addressable base for the living room IoT ecosystem beyond traditional console users.


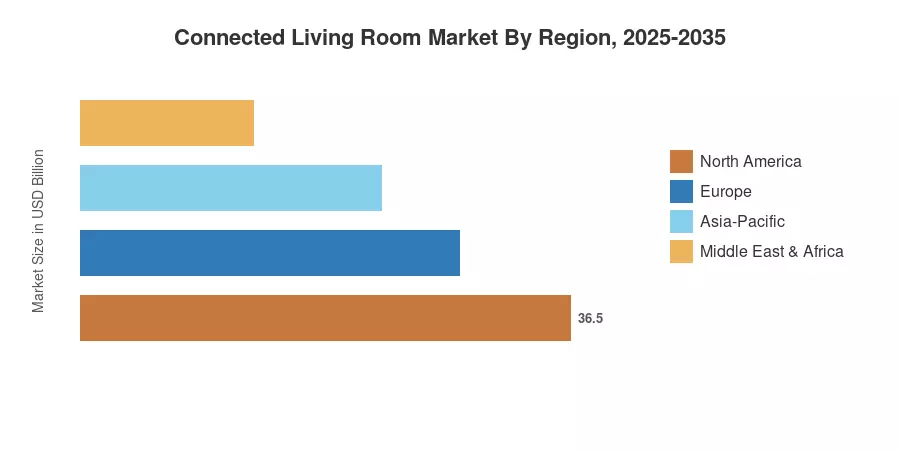
The Asia-Pacific region will account for 40.6% of revenues in the connected living room market in 2025, due to its high concentration of manufacturing and fast-growing urban broadband adoption. The Middle East & Africa is the fastest expanding segment, projected to increase at a CAGR of 12.78% through 2035, with the scaling up of smart home retrofit programs. North America is still the second largest contributor, driven by mature streaming entertainment platforms and high per-home device numbers. The next decade is the decade of adoption driven by interoperability.


Section 2 — Key Report Takeaways

By Technology

  • Smart TVs led the connected living room market with a 45.8% device-type revenue share in 2024, anchored by large-screen replacement cycles
  • Digital Media Streamers are projected to expand at a 13.42% CAGR through 2035 as low-cost streaming entertainment platforms broaden reach
  • Wi-Fi connectivity is heading toward an 11.05% CAGR, reflecting Wi-Fi 6E/7 upgrades across the living room IoT ecosystem

By Application

  • Video Streaming and OTT accounted for a 59.7% application-share of the connected living room market in 2024
  • Gaming and eSports are advancing at a 10.06% CAGR, driven by native cloud-gaming apps on smart home display hubs

By Region

Section 3 — Market Size and Forecast (2021–2035)

Market sizing combines bottom-up shipment modeling for connected home media devices with top-down revenue triangulation against publicly reported vendor financials, broadband-penetration datasets, and OTT subscription benchmarks. Historical years (2021–2024) are reconciled against shipment data; forecast years apply the calibrated 8.61% CAGR with demand-elasticity adjustments for device-price compression.

Connected Living Room Market Size and Forecast
Our Impact
Enabled $4.3B Revenue Impact for Fortune 500 and Leading Multinationals
Partnering with 2000+ Global Organizations Each Year
30K+ Citations by Top-Tier Firms in the Industry

Driver Impact Analysis

Driver ~% Impact on CAGR Geographic Relevance Impact Timeline
Wi-Fi 6E/7 broadband upgrades 21% Global Medium-term
Device-price compression 19% Asia-Pacific, MEA Short-term
Platform-centric monetization 17% North America, Europe Medium-term
Native cloud-gaming apps 13% Global Long-term
Matter interoperability standard 12% Global Long-term
Streaming content investment 11% North America, Europe Short-term
Smart-home retrofit programs 7% MEA, South America Long-term


Wi-Fi 6E/7 Broadband Upgrades

Residential broadband upgrade is the biggest growth lever. The US BEAD initiative, investing USD 42.45 billion for high-speed deployment, and the EU’s Gigabit Infrastructure Act, aiming for universal gigabit coverage by 2030, have increased the share of houses able to manage multi-device living room IoT ecosystem workloads. More backhaul bandwidth immediately increases attach rates for connected home media devices.


Device-Price Compression

Vertically integrated manufacturers have cut large-screen smart-TV entry prices by an estimated 28% over four years. This compression lowers the barrier for first-time buyers, particularly across price-sensitive Asia-Pacific and MEA households, and accelerates upgrade cycles for streaming entertainment platforms.

Platform-Centric Monetization

Retail-media and shoppable-TV formats now subsidize hardware economics. Analyst estimates place connected-TV ad spending above USD 30 billion annually, allowing manufacturers of smart home display hubs to price aggressively while recovering margin through software and advertising revenue.

Native Cloud-Gaming Apps

Cloud gaming delivered natively through smart TV home entertainment apps removes the traditional gaming console as a strict purchase prerequisite. Backed by a rapidly scaling global cloud gaming market that reached an estimated USD 15.7 billion in value, major ecosystem players are integrating gaming hubs directly into smart TV operating systems, solidifying gaming as a durable, long-term driver for the connected living room market.


Restraints Impact Analysis

Restraint ~% Impact on CAGR Geographic Relevance Impact Timeline
Operating-system fragmentation 28% Global Medium-term
Data-privacy scrutiny 24% Europe, North America Medium-term
Content-licensing cost inflation 19% Global Short-term
Slow Matter ecosystem maturity 17% Global Long-term
Hardware commoditization margin pressure 12% Asia-Pacific Short-term


Operating-System Fragmentation

Competing systems such as Tizen, webOS, Android TV, Fire OS and Roku OS are fragmenting the developer base and making life difficult for interoperability throughout the living room IoT ecosystem. Inconsistent availability of smart home applications and their update cadences decreases customer confidence in unified smart house control, slowing attach rates for auxiliary linked home media devices.


Data-Privacy Scrutiny

Automatic content recognition and viewing data collection face intensifying oversight. The EU GDPR enforcement actions and US state privacy statutes — including the California Consumer Privacy Act — constrain the data-driven monetization model that underwrites aggressive hardware pricing, creating a structural tension for streaming entertainment platforms.

Content-Licensing Cost Inflation

Rising sports and premium-content licensing fees compress OTT operator margins. As licensing costs climbed double digits annually, several platforms raised subscription pricing, modestly slowing household adoption of smart TV home entertainment services in price-sensitive segments.

Connected Living Room Market Opportunities

Emerging-Market Retrofit Demand

Sub-Saharan Africa, Southeast Asia, and Latin America host hundreds of millions of households transitioning from feature TVs to connected devices. Falling entry prices combined with mobile-first broadband expansion create a long runway for low-cost streaming entertainment platforms

Ambient-Computing and Voice-Native Hubs

Smart home display hubs that double as voice-native ambient interfaces represent a fast-emerging category. Integrating calendar, security, and energy controls into the living room IoT ecosystem extends device value beyond entertainment and supports premium pricing

Retail Media and Data Monetization

Shoppable TV and retail-media networks convert the living room screen into a commerce surface. This new business model — projected to scale meaningfully through 2035 — lets vendors monetize connected home media devices recurrently rather than through one-time hardware sales

Matter-Driven Interoperability Bundles

As Matter adoption matures, vendors can bundle interoperable smart-home accessories with smart TV home entertainment hardware, raising basket size and reducing fragmentation friction

Cloud-Gaming Subscription Tie-Ins

Bundling cloud-gaming subscriptions with connected devices opens a recurring-revenue channel and differentiates the connected living room market from commoditized hardware-only competitors

Connected Living Room Market Future Outlook

AI-Native Ambient Operations

By the early 2030s, on-device AI will transform the living room screen into a proactive ambient assistant — surfacing content, managing smart-home routines, and personalizing interfaces. This shifts the connected living room market from passive display toward autonomous orchestration.

Platform Economics and Recurring Revenue

Hardware margins will continue to compress while software, advertising, and subscription revenue expand. Analyst projections place connected-TV ad spend on a path beyond USD 50 billion by the early 2030s, cementing platform economics as the dominant value pool.

Energy-Efficiency and Sustainability Reporting

Tightening energy-labeling rules — including the EU's ecodesign framework — and corporate ESG disclosure obligations will push vendors toward low-power panels and recyclable designs, influencing procurement across smart TV home entertainment categories.

Interoperability Convergence

Matter maturation and Wi-Fi 7 ubiquity will reduce ecosystem fragmentation, enabling seamless multi-vendor living room IoT ecosystem experiences and unlocking bundled-accessory revenue through the forecast decade.

Connected Living Room Market Segmentation

By Device Type

The connected living room market segments across hardware categories with distinct growth profiles.

Segment Metric Primary Demand Driver
Smart TVs 45.8% share Large-screen replacement
Digital Media Streamers 13.42% CAGR Low-cost streaming access
Gaming Consoles USD 11.24 B Cloud-gaming hybridization
Soundbars & Audio USD 6.81 B Immersive audio demand
Others USD 4.93 B Niche accessories


Smart TVs dominate on installed base and replacement value, while Digital Media Streamers grow fastest by extending the connected living room market to budget households. Streamers also serve as upgrade bridges for older displays, sustaining momentum for streaming entertainment platforms.

By Connectivity Technology

Segment Metric Primary Demand Driver
Wi-Fi 11.05% CAGR Wi-Fi 6E/7 upgrades
Ethernet USD 5.12 B Latency-sensitive gaming
Others USD 3.94 B Emerging protocols


Wi-Fi commands the connected living room market by an overwhelming margin, and the transition to Wi-Fi 6E and Wi-Fi 7 sustains its growth lead. Ethernet retains a niche among latency-sensitive cloud-gaming households within the living room IoT ecosystem.

By Operating System Platform

Segment Metric Primary Demand Driver
Samsung Tizen 17.42% share Premium TV installed base
LG webOS USD 9.87 B OLED leadership
Android TV/Google TV 13.78% CAGR App-ecosystem breadth
Others USD 8.14 B Proprietary platforms


Samsung Tizen leads on installed base, while Android TV/Google TV grows fastest by powering low-cost connected home media devices. Platform competition shapes monetization strategy across the connected living room market.

By Application

Segment Metric Primary Demand Driver
Video Streaming and OTT 59.7% share Content abundance
Gaming and eSports 10.06% CAGR Native cloud apps
Smart Home Control & Automation USD 8.43 B Hub convergence
Others USD 5.27 B Emerging use cases


Video Streaming and OTT remain the anchor application, while Gaming and eSports grow fastest as smart home display hubs gain native cloud-gaming capability.

Regional Market Share Analysis

Region Metric (2025) Primary Investment Themes
North America USD 17.84 B Retail media, premium hubs
Europe USD 14.93 B Privacy-compliant platforms
Asia-Pacific 40.6% share Manufacturing, price compression
South America 6.81% CAGR Streaming entry devices
Middle East & Africa 12.78% CAGR Smart-home retrofit
Total USD 64.92 B

The connected living room market shows clear regional stratification, with Asia-Pacific manufacturing scale anchoring volume and Western markets leading monetization sophistication.


North America

Country Share of Region Key Driver
US 81.4% Retail-media monetization
Canada 13.2% Broadband upgrade subsidies
Mexico 5.4% Low-cost streamer adoption


North America pairs high per-household device counts with the most advanced shoppable-TV monetization. BEAD-funded broadband expansion and mature OTT competition keep replacement cycles short, sustaining premium smart home display hubs demand.

Europe

Country Metric Key Driver
Germany USD 3.41 B Premium TV replacement
UK USD 2.98 B OTT subscription density
France USD 2.44 B Public broadband investment
Italy USD 1.79 B Streaming migration
Spain USD 1.52 B Price-led adoption
Nordic Countries USD 1.31 B High broadband quality
Russia USD 0.84 B Localized platforms
Rest of Europe USD 0.64 B Mixed adoption


Europe's trajectory is shaped by privacy regulation. GDPR enforcement constrains data monetization, pushing vendors toward subscription and bundled models for the living room IoT ecosystem rather than ad-funded economics.

Asia-Pacific

Country Metric Key Driver
China 51.2% share Manufacturing scale
India 9.34% CAGR Broadband expansion
Japan USD 4.12 B Premium hardware base
South Korea USD 3.05 B OLED leadership
ASEAN USD 3.88 B Low-cost streamers
Rest of Asia-Pacific USD 2.21 B Emerging adoption


Asia-Pacific anchors the connected living room market through vertically integrated supply chains. Chinese manufacturers' disruptive large-screen pricing forces global recalibration of premium strategies.

South America

Country Share of Region Key Driver
Brazil 58.7% Streaming entry devices
Argentina 21.3% Price-sensitive demand
Rest of South America 20.0% Mobile-first broadband


South America's growth tracks broadband affordability. Mobile-led connectivity and falling streamer prices broaden access to streaming entertainment platforms across urban households.

Middle East & Africa

Country Metric Key Driver
Saudi Arabia USD 0.71 B Smart-home initiatives
UAE USD 0.58 B Premium retrofit demand
South Africa USD 0.39 B Broadband expansion
Egypt USD 0.27 B Low-cost device entry
Rest of MEA USD 0.41 B Mixed adoption


MEA is the fastest-growing region. National smart-city and digital-home programs across the Gulf accelerate retrofit demand for connected home media devices and smart home display hubs.

Connected Living Room Market By Region, 2025-2035

Competitive Benchmarking

The connected living room market exhibits medium concentration, with an estimated HHI in the 900–1,200 range and a top-five revenue share near 52%. The structure is moderately fragmented: scaled hardware incumbents compete alongside platform-first and streaming-first players, and no single vendor controls the full hardware-software-content stack.

Company Est. Revenue Share Range Key Offerings for the connected living room market Strategic Positioning
Samsung Electronics ~13–16% Smart TVs, Tizen platform Premium hardware + OS leader
LG Electronics ~10–13% OLED TVs, webOS Display an innovation leader
TCL ~8–11% Value smart TVs Price-disruption challenger
Hisense ~7–10% Large-screen TVs Scale-led value player
Sony ~6–9% Premium TVs, consoles Content-hardware integrator
Roku ~5–8% Streamers, Roku OS Platform-first monetizer
Amazon ~5–8% Fire TV devices Ecosystem-bundling player
Google ~4–7% Chromecast, Google TV Software-platform anchor
Apple ~3–6% Apple TV, tvOS Premium-ecosystem niche
Xiaomi ~3–6% Value streamers, TVs Emerging-market specialist
Vizio ~2–5% Value smart TVs Ad-funded value player


Recent News & Developments

  • Samsung Electronics (March 2024): Launched a Tizen-powered AI-upscaling TV lineup, reinforcing premium positioning amid value-tier price pressure.
  • Roku (June 2024): Expanded its retail-media network with new shoppable-ad formats, deepening platform monetization for streaming entertainment platforms.


  • Hisense (August 2025): Partnered with a cloud-gaming provider to embed native gaming apps in connected home media devices.

Section 12 — Report Scope and Methodology

Parameter Detail
Market Scope Global connected living room market — connected home media devices, platforms, and applications.
Study Period 2021–2035
CAGR 8.61% (2026–2035)
Market Size Checkpoints USD 64.92 B (2025); USD 70.51 B (2026); USD 154.18 B (2035)
Fastest Growing Segments Digital Media Streamers; Gaming and eSports; MEA region
Companies Profiled Samsung, LG, TCL, Hisense, Sony, Roku, Amazon, Google, Apple, Xiaomi, Vizio
Valuation Currency USD Billion


Section 13 — Detailed Sources and Citations

# Full Citation URL / Source
1 Market Research Future, Connected Living Room Market Report, 2025 marketresearchfuture.com
2 International Telecommunication Union, Measuring Digital Development, 2024 itu.int
3 International Data Corporation, Smart Home Device Tracker, 2024 idc.com
4 US NTIA, BEAD Program Allocation Report, 2024 ntia.gov
5 OECD, Broadband Portal Statistics, 2024 oecd.org
6 Omdia, TV Sets Market Tracker, 2024 omdia.com
7 World Bank, Digital Economy Indicators, 2024 worldbank.org
8 Wi-Fi Alliance, Wi-Fi 6E/7 Deployment Brief, 2024 wi-fi.org
9 Ampere Analysis, Online Video Forecasts, 2024 ampereanalysis.com
10 Counterpoint Research, Smart TV Market Share, 2024 counterpointresearch.com
11 Statista, Connected TV Devices Outlook, 2024 statista.com
12 European Data Protection Board, GDPR Enforcement Report, 2024 edpb.europa.eu
13 Samsung Electronics, Annual Report, 2024 samsung.com
14 Connectivity Standards Alliance, Matter Specification Update, 2024 csa-iot.org
15 European Commission, Gigabit Infrastructure Act, 2024 ec.europa.eu
16 Newzoo, Cloud Gaming Market Report, 2024 newzoo.com
17 eMarketer, Connected TV Ad Spending Forecast, 2024 emarketer.com
18 LG Electronics, Investor Presentation, 2025 lge.com
19 Strategy Analytics, Smart TV OS Share, 2024 strategyanalytics.com
20 Amazon, Devices & Services Press Release, 2025 amazon.com
21 GSMA, Mobile Economy Report, 2024 gsma.com
22 Roku, Annual Report, 2024 roku.com


Section 14 — Frequently Asked Questions

Q1. What procurement risks should buyers weigh when sourcing within the connected living room market?

Platform lock-in is the primary risk: choosing a vendor commits buyers to its app catalog and update cadence. Multi-year support guarantees and Matter compliance clauses help mitigate obsolescence exposure.

Q2. How does operating-system choice affect the total cost of ownership in the connected living room market?

Ad-funded platforms lower upfront price but monetize viewing data, while subscription-based systems cost more initially with fewer privacy trade-offs. Buyers should weigh data-governance policies against hardware savings.

Q3. Which integration challenges most often delay connected living room market deployments?

Inconsistent Matter implementation and mismatched Wi-Fi standards across devices cause the most friction. Pre-deployment interoperability testing reduces installation failures and post-sale support costs.

Q4. How should investors interpret competitive dynamics in this space?

Hardware margins are thinning while platform and advertising revenue expand, so investors should favor players with software monetization depth rather than pure shipment volume.

Q5. What regulatory nuances affect data-driven monetization here?

Privacy regimes vary sharply by region: GDPR and US state laws restrict automatic content recognition more tightly than many Asian jurisdictions. Compliance cost is now a material competitive variable.

Q6. Are emerging markets a viable near-term growth bet?

Yes, where mobile broadband is expanding, and device prices keep falling. Low-cost streamers, not premium TVs, are the realistic entry product for these households.

Q7. How does cloud gaming change the buyer value proposition?

It removes the console as a purchase requirement, so a connected TV plus subscription replaces dedicated hardware. This favors devices with strong app support and low input latency.


Author
Author
Author Profile
Aarti Dhapte LinkedIn
AVP - Research
A consulting professional focused on helping businesses navigate complex markets through structured research and strategic insights. I partner with clients to solve high-impact business problems across market entry strategy, competitive intelligence, and opportunity assessment. Over the course of my experience, I have led and contributed to 100+ market research and consulting engagements, delivering insights across multiple industries and geographies, and supporting strategic decisions linked to $500M+ market opportunities. My core expertise lies in building robust market sizing, forecasting, and commercial models (top-down and bottom-up), alongside deep-dive competitive and industry analysis. I have played a key role in shaping go-to-market strategies, investment cases, and growth roadmaps, enabling clients to make confident, data-backed decisions in dynamic markets.
Co-Author
Co-Author Profile
Aarti Dhapte LinkedIn
AVP - Research
A consulting professional focused on helping businesses navigate complex markets through structured research and strategic insights. I partner with clients to solve high-impact business problems across market entry strategy, competitive intelligence, and opportunity assessment. Over the course of my experience, I have led and contributed to 100+ market research and consulting engagements, delivering insights across multiple industries and geographies, and supporting strategic decisions linked to $500M+ market opportunities. My core expertise lies in building robust market sizing, forecasting, and commercial models (top-down and bottom-up), alongside deep-dive competitive and industry analysis. I have played a key role in shaping go-to-market strategies, investment cases, and growth roadmaps, enabling clients to make confident, data-backed decisions in dynamic markets.
Download Free Sample

Kindly complete the form below to receive a free sample of this Report