Contact Lenses Market Summary
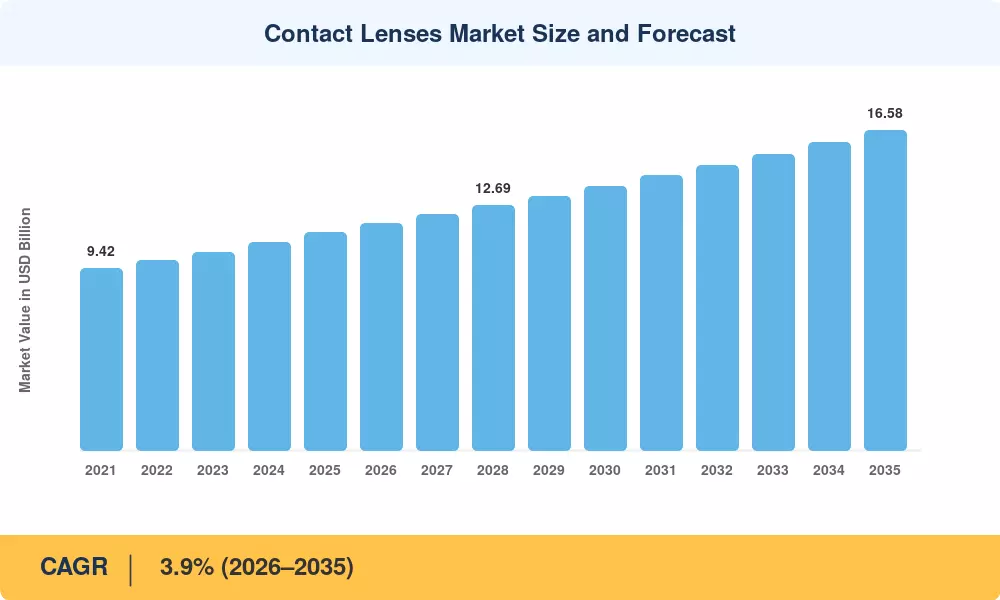
The Contact Lenses Market reached USD 11.31 billion in 2025 and opens the forecast window at USD 11.75 billion in 2026, climbing to USD 16.58 billion by 2035 at a 3.9% CAGR. Two catalysts anchor that trajectory. The World Health Organization's 2019 vision report put the global unaddressed refractive error burden at 123.7 million people, and myopia prevalence is projected to touch half the world's population by 2050 [1][2]. Payers and health ministries have started treating that as a public health line item rather than an optical retail footnote.
Manufacturing is where the real shift is happening. Legacy conventional hydrogel and annual-replacement stock keeping units are being retired in favour of high-oxygen-transmissibility polymers and single-use formats produced on automated cast-moulding lines. Alcon committed roughly USD 400 million to expanding daily disposable capacity across Singapore, Indonesia and the United States between 2022 and 2025, and CooperVision has run parallel expansions in Puerto Rico and Hungary [3][4].
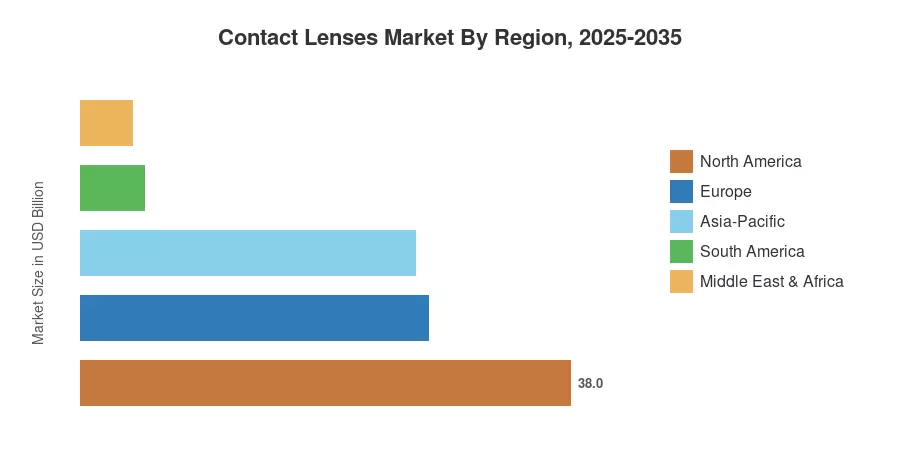
Regionally, North America holds 38% of the Contact Lenses Market on a 2025 basis, supported by high practitioner density and insurance-linked purchasing. Asia-Pacific grows fastest at a 5.2% CAGR, driven by paediatric myopia programmes in China, Japan and Taiwan. Europe ranks second at 27%, where reimbursement for therapeutic fitting keeps volumes resilient. The next decade rewards whoever industrialises single-use economics first.
Key Report Takeaways
• By Material
- Silicone hydrogel accounts for 47% of 2025 revenue, the largest material pool in the Contact Lenses Market
- Gas permeable materials post a 2.6% CAGR, held back by fitting complexity
• By Application
- Vision correction represents 84% of global revenue
- Therapeutic applications generate roughly USD 0.79 billion in 2025
- Cosmetic and tinted formats expand at a 4.8% CAGR through 2035
• By Region
- North America leads the Contact Lenses Market with a 38% revenue share
- Asia-Pacific advances at a 5.2% CAGR, the fastest of any region
- Middle East & Africa contributes approximately USD 0.45 billion in 2025
Market Size and Forecast (2021–2035)
Figures below blend audited manufacturer segment disclosures, customs-level trade data on finished optical goods, practitioner panel surveys across 14 countries, and national health-service dispensing statistics. Historical years are reconciled against reported optical-segment revenue from the four largest producers; forecast years apply prevalence-weighted penetration modelling.