Control Valve Market (2026 - 2035)

Control Valve Market Size, Share & Growth Analysis Report By Valve Type (Globe, Ball, Butterfly, Plug, Others), By Actuation Technology (Pneumatic, Hydraulic, Electric, Others), By End-User Industry (Oil and Gas, Chemical, Water & Wastewater, Pharmaceuticals, Energy & Power, Petrochemical & Fertilizer, Others), By Material (Steel, Cast Iron, Alloy-Based, Plastic) and By Regional (North America, Europe, South America, Asia Pacific, Middle East and Africa) โ€“ Industry Growth & Forecast to 2035
ID: MRFR/EnP/1408-CR
155 Pages
Priya Nagrale
Last Updated: June 22, 2026
Control Valve Market
Market Size
Forecast Period2026-2035
CAGR (2026-2035)7.90%
2025 Market SizeUSD 7.85 Billion
2035 Market SizeUSD 16.79 Billion
Key Players
Emerson Electric Co.
Flowserve Corporation
Valmet Oyj
IMI plc
Samson AG
Spirax Group plc
Opportunities
  • Predictive Valve Maintenance via AI and IIoT
  • Emerging-Market Municipal Water Expansion
  • Modular Nuclear (SMR) Piping Systems

Control Valve Market Summary

The Control Valve Market reached USD 7.85 Billion in 2025 and is forecast to climb from USD 8.47 Billion in 2026 to USD 16.79 Billion by 2035, advancing at a 7.90% CAGR during 2026โ€“2035. Rising global investment in water-treatment infrastructureโ€”the U.S. EPA alone allocated over USD 50 Billion under the Bipartisan Infrastructure Law for clean water programsโ€”and tightening fugitive-emission regulations across OECD economies are channeling procurement budgets toward higher-specification flow-control hardware[2].

A generational technology shift is redefining the Control Valve Market. Legacy pneumatic-only valve assemblies are giving way to digitally integrated units equipped with smart positioners, predictive-diagnostics firmware, and low-emission packing systems. The European Commission's updated Industrial Emissions Directive (IED-2024) imposes packing-leakage limits below 100 ppm, compelling plant operators to retrofit or replace tens of thousands of aging valve stations across refining and petrochemical complexes [3]. Simultaneously, the rise of hydrogen-ready and small modular reactor (SMR) piping specifications is pulling R&D spend toward cryogenic trim, high-alloy body materials, and fail-safe electric actuation.

North America commanded a 36.0% share of the Control Valve Market in 2025, anchored by midstream pipeline expansions and pharmaceutical facility build-outs. Asia-Pacific is positioned as the fastest-growing region at an 8.95% CAGR through 2035, driven by China's "Dual Carbon" decarbonization strategy and India's Jal Jeevan Mission water program. Europe holds the second-largest share at 25.8%, buoyed by green-hydrogen valve demand. These regional dynamics suggest the Control Valve Market will diversify revenue sources considerably over the coming decade.

ย 

Key Report Takeaways

โ€ข By Valve Type

  • Butterfly valves accounted for 32.1% of Control Valve Market revenue in 2025, reflecting their widespread adoption in HVAC and water-distribution systems.
  • Plug valves are projected to post an 8.35% CAGR through 2035, supported by increasing deployment in isolation and throttling duties across chemical plants.

โ€ข By Actuation Technology

  • Pneumatic actuators held a 43.9% share of the Control Valve Market in 2025, favored for their fast stroking speeds in safety-critical loops.
  • Electric actuators are set to register the fastest growth at a 10.75% CAGR, fueled by plant electrification and digital-twin integration.

โ€ข By Region

  • North America captured 36.0% of the Control Valve Market in 2025.
  • Asia-Pacific is forecast to expand at an 8.95% CAGR, the highest among all regions.

ย 

Market Size and Forecast (2021โ€“2035)

Market Research Future derives its sizing estimates from bottom-up demand analysis across thirteen end-use verticals, cross-validated with import/export customs databases, OEM shipment disclosures, and distributor channel checks in over 40 countries. All historical values are based on confirmed shipment and installation data; forecast figures incorporate macroeconomic projections from the IMF, regional capex pipeline trackers, and policy scenario modeling[4].
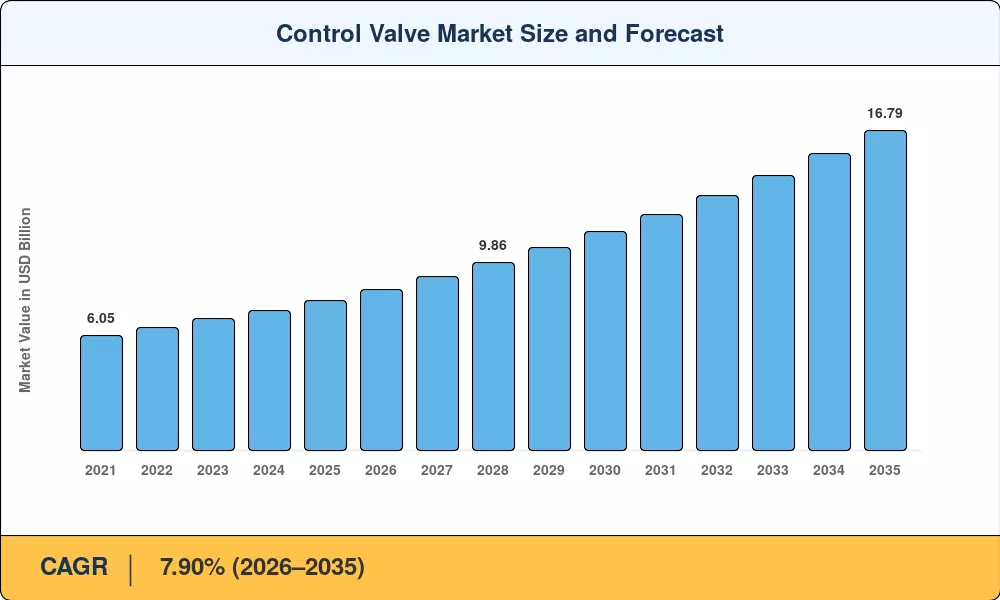
Control Valve Market Size and Forecast
Our Impact
Enabled $4.3B Revenue Impact for Fortune 500 and Leading Multinationals
Partnering with 2000+ Global Organizations Each Year
30K+ Citations by Top-Tier Firms in the Industry

Driver Impact Analysis

Driver ~% Impact on CAGR Geographic Relevance Impact Timeline
Water & wastewater infrastructure spending ~1.8% Global Long-term (โ‰ฅ4 yr)
Fugitive-emission and methane regulations ~1.5% North America, Europe Medium-term (2โ€“4 yr)
Hydrogen economy valve specifications ~1.2% Europe, Asia-Pacific Long-term (โ‰ฅ4 yr)
Pharmaceutical & biologics facility expansion ~1.0% North America, Europe Short-term (โ‰ค2 yr)
Electric-actuator electrification trend ~0.9% Global Medium-term (2โ€“4 yr)
SMR & advanced nuclear construction ~0.8% North America, Europe Long-term (โ‰ฅ4 yr)
Digital positioner & IIoT integration ~0.7% Global Medium-term (2โ€“4 yr)

ย 

Water and Wastewater Infrastructure Investment

A multi-decade expansion phase of global water infrastructure spending is about to begin. While the EU's Urban Wastewater Treatment Directive amendment requires enhanced nutrient removal at more than 1,500 treatment plants by 2035, the U.S. Bipartisan Infrastructure Law allots more than $50 billion to wastewater and drinking water systems [2]. These initiatives immediately expand the addressable control valve market by generating a steady demand for butterfly, ball, and plug control valves rated for corrosive slurry and high-solid-content flows.

ย 

Fugitive-Emission and Methane Regulations

The U.S. EPA's Methane Emissions Reduction Program, finalized in late 2024, imposes a per-ton charge on methane releases exceeding facility baselines, incentivizing operators to upgrade to low-leakage packing and bellows-seal valve architectures [10]. In Europe, the EU Methane Regulation requires quarterly optical gas-imaging surveys at oil, gas, and coal facilities, pushing end users toward certified zero-fugitive-emission valve assemblies. These mandates raise the specification floor across the entire Control Valve Market.

Pharmaceutical and Biologics Facility Expansion

The global biologics contract development and manufacturing organization (CDMO) sector is projected to add over 200 new single-use and stainless-steel production suites between 2025 and 2030. Each suite requires 150โ€“300 sanitary control valves with CIP/SIP compatibility, translating to a concentrated near-term procurement wave. FDA and EMA pressure on continuous manufacturing further amplifies demand for high-precision globe control valves with sub-1% flow-coefficient accuracy.

Hydrogen Economy Valve Specifications

Green-hydrogen electrolysis projects announced globally now total over 45 GW of capacity through 2030, according to IRENA [8]. Hydrogen service introduces valve challenges, including embrittlement resistance, cryogenic sealing integrity, and high-pressure-differential trim design. These requirements channel procurement toward specialty alloy-bodied control valves with severe-service trim, creating a premium-price segment within the Control Valve Market.

ย 

Restraints Impact Analysis

The restraint estimates below are directional offsets against the baseline growth trajectory. Actual net impact depends on the pace of technology cost reduction and regulatory harmonization efforts.

Restraint ~% Impact on CAGR Geographic Relevance Impact Timeline
High upfront cost of smart valve assemblies โ€“0.6% Emerging markets Short-term (โ‰ค2 yr)
Raw material price volatility (nickel, chromium) โ€“0.5% Global Medium-term (2โ€“4 yr)
Skilled workforce shortage for commissioning โ€“0.4% Global Long-term (โ‰ฅ4 yr)
Interoperability gaps between OEM digital platforms โ€“0.3% Global Medium-term (2โ€“4 yr)
Geopolitical trade barriers on specialty alloys โ€“0.3% Asia-Pacific, Europe Medium-term (2โ€“4 yr)

ย 

High Upfront Cost of Smart Valve Assemblies

A fully instrumented smart control valveโ€”including digital positioner, limit-switch feedback, and diagnostic moduleโ€”can cost 40โ€“60% more than a conventional pneumatic assembly [15]. In price-sensitive markets across South Asia and Sub-Saharan Africa, this premium discourages adoption, particularly in municipal water utilities operating under constrained capital budgets. The effect dampens near-term growth in the Control Valve Market's emerging-economy segments until lifecycle-cost awareness improves.

Raw Material Price Volatility

Chromium-molybdenum alloys and nickel-bearing stainless steels are used extensively in control valve bodies, trim, and seat rings. Nickel prices on the London Metal Exchange fluctuated by more than 45% between 2022 and 2024, causing OEM input costs to become unstable and postponing final investment decisions on large-order framework contracts [6]. Order-book conversion in the Control Valve Market is momentarily slowed by this volatility, which also compresses manufacturer margins and may cause end users to postpone purchases.

ย 

ย 

Control Valve Market Opportunities

Predictive Valve Maintenance via AI and IIoT

Cloud-connected digital positioners now generate continuous valve-signature dataโ€”stem travel, friction profiles, seat-leakage ratesโ€”enabling AI algorithms to predict packing failure and trim erosion weeks before functional loss [13]. This predictive-maintenance capability creates a recurring-revenue layer for OEMs willing to sell outcome-based service agreements, transforming the Control Valve Market from a replacement-cycle business into a data-monetization platform.

Emerging-Market Municipal Water Expansion

With a budget of more than USD 28 billion in federal and state funding, India's Jal Jeevan Mission seeks to provide piped water to every rural family by 2028 [9]. Similar initiatives are growing at the same time in Nigeria, Vietnam, and Indonesia. These initiatives support affordable butterfly and ball control valves, creating large-volume markets for Asian producers who can compete on price while still fulfilling fundamental performance requirements.

ย 

Modular Nuclear (SMR) Piping Systems

The U.S. Nuclear Regulatory Commission has certified designs for multiple SMR platforms, with construction starts expected at six domestic sites before 2030 [7]. Each SMR unit requires approximately 500โ€“800 nuclear-grade control valves rated for Class 1 and Class 2 piping. This emerging vertical brings long-duration, high-specification order books to the Control Valve Market.

Carbon Capture and Storage (CCS) Valve Demand

CCS project announcements surpassed 400 globally by mid-2025, targeting combined capture capacity above 350 Mtpa by 2035 [14]. COโ‚‚ transport pipelines and injection-well control stations demand valves rated for supercritical COโ‚‚ serviceโ€”high pressure, corrosive media, and precise flow modulation. This application segment is expected to contribute meaningfully to control valve procurement across the Control Valve Market over the next decade.

Valve-as-a-Service and Subscription Models

Several large OEMs have begun piloting outcome-based commercial models in which end users pay a monthly fee covering valve hardware, commissioning, remote diagnostics, and replacement parts [15]. These subscription structures lower procurement barriers for smaller operators and generate predictable recurring revenue for manufacturers, potentially reshaping competitive dynamics within the Control Valve Market.

ย 

Control Valve Market Future Outlook

AI-Driven Autonomous Valve Control

By 2030, the installed base of digitally instrumented control valves is expected to exceed 12 million units globally [13]. Combined with edge-computing platforms and plant-wide digital twins, this connectivity will enable closed-loop autonomous valve optimizationโ€”adjusting set points, stroking profiles, and packing tension without human intervention. Early adopters in refining report 15โ€“20% reductions in unplanned shutdowns, signaling a tangible productivity payoff for the Control Valve Market.

Electrification of Actuation Systems

Electric actuators offer variable-speed positioning, regenerative braking, and elimination of compressed-air infrastructure, making them attractive for both greenfield plants and brownfield retrofits [12]. The IEA projects that industrial electrification rates will rise from 21% in 2023 to 32% by 2035, providing a secular tailwind for electric-actuator penetration within the Control Valve Market [14].

ESG Disclosure and Supply-Chain Traceability

Mandatory Scope 3 emissions reportingโ€”now required under the EU Corporate Sustainability Reporting Directive and SEC climate-disclosure rulesโ€”compels end users to track embedded carbon in procured equipment [3]. Valve manufacturers responding with environmental product declarations (EPDs) and digitally traceable material certificates will gain procurement-preference advantages, particularly in European and North American tenders tied to the Control Valve Market.

Platform Consolidation and Software Economics

An industry-wide shift toward sensor-to-cloud control-valve platforms is exemplified by Emerson's acquisition of NI (National Instruments) and Flowserve's expansion of ValveSight [18][19]. Revenue from recurring software and diagnostics becomes the differentiator in the market as hardware margins shrink. Market Research Future forecasts that software-attached services might account for 12โ€“18% of all OEM income from the Control Valve Market by 2035.

ย 

ย 

Control Valve Market Segmentation

By Valve Type

Segment Key Metric Primary Demand Driver
Globe 21.5% share (2025) Precision throttling in pharma and chemical loops
Ball 8.20% CAGR (2026โ€“2035) On-off and modulating duties in oil & gas
Butterfly 32.1% share (2025) Water treatment, HVAC, and large-diameter piping
Plug 8.35% CAGR (2026โ€“2035) Isolation and diverting services in the petrochemical
Others USD 0.42 Billion (2025) Specialty applications (pinch, diaphragm, gate)

ย 

Butterfly valves dominate the Control Valve Market on a volume basis thanks to their compact footprint, low torque requirements, and cost efficiency in large-diameter water and wastewater pipelines. High-performance triple-offset butterfly designs are increasingly displacing traditional globe valves in moderate-pressure chemical applications, blurring segment boundaries. Globe valves, however, retain a strong hold in pharmaceutical, nuclear, and high-precision chemical dosing installations where fine-resolution flow modulation is non-negotiable.

Plug valves are emerging as the fastest-expanding type segment, gaining traction in multiport diverting configurations for petrochemical feed switching and in specialty alloy constructions for corrosive-media isolation. Their inherent low-friction sealing and bidirectional shutoff capability make them attractive as plants seek to reduce the number of valve assemblies per piping run.

By Actuation Technology

Segment Key Metric Primary Demand Driver
Pneumatic 43.9% share (2025) Fast-stroke safety-loop requirements
Hydraulic USD 0.94 Billion (2025) High-force subsea and pipeline applications
Electric 10.75% CAGR (2026โ€“2035) Plant electrification and IIoT integration
Others 5.2% share (2025) Manual-override and electrohydraulic hybrid

ย 

Pneumatic actuators remain the backbone of the Control Valve Market due to their proven reliability in SIL-rated safety instrumented systems and their ability to deliver sub-second stroking in emergency shutdown applications. Compressed-air supply infrastructure is already embedded in most brownfield plants, lowering marginal installation cost.

Electric actuators represent the segment's most dynamic growth vector. Elimination of air-compressor parasitic energy consumption, coupled with native digital communication (HART, PROFIBUS, Foundation Fieldbus), positions electric units as the preferred choice for greenfield facilities designed around Industry 4.0 architectures. The Control Valve Market will see the electric-actuator share approach 30% by 2035, up from approximately 19% in 2025.

By End-User Industry

Segment Key Metric Primary Demand Driver
Oil and Gas 22.4% share (2025) Upstream production and midstream transport
Chemical 8.60% CAGR (2026โ€“2035) Specialty-chemical and fine-chemical capacity growth
Water & Wastewater 23.05% share (2025) Municipal infrastructure and reuse mandates
Pharmaceuticals 9.75% CAGR (2026โ€“2035) Biologics CDMO expansion
Energy & Power USD 1.09 Billion (2025) Thermal, nuclear, and renewable utility loops
Petrochemical & Fertilizer 7.80% CAGR (2026โ€“2035) Downstream integration projects
Others USD 0.58 Billion (2025) Food & beverage, pulp & paper, mining

ย 

Water and wastewater treatment edges ahead as the largest end-user segment for the Control Valve Market, narrowly surpassing oil and gas for the first time in 2025. Stringent discharge-quality regulations and aging pipe networks in North America and Europe are catalyzing multi-year replacement and upgrade programs that favor resilient butterfly and ball valve installations.

By Material

Segment Key Metric Primary Demand Driver
Steel 44.8% share (2025) General-purpose industrial applications
Cast Iron USD 0.87 Billion (2025) Low-pressure water distribution
Alloy-Based 9.20% CAGR (2026โ€“2035) Corrosive, high-temp, and hydrogen service
Plastic 6.15% CAGR (2026โ€“2035) Chemical dosing and ultrapure water

ย 

Steel remains the default body material across the Control Valve Market, offering a balance of mechanical strength, machinability, and cost. Alloy-based valvesโ€”constructed from Inconel, Hastelloy, Monel, and duplex stainless steelsโ€”are gaining share as end users specify materials resistant to hydrogen embrittlement, chloride stress-corrosion cracking, and high-temperature oxidation environments.

ย 

Regional Market Share Analysis

Region Key Metric Primary Investment Themes
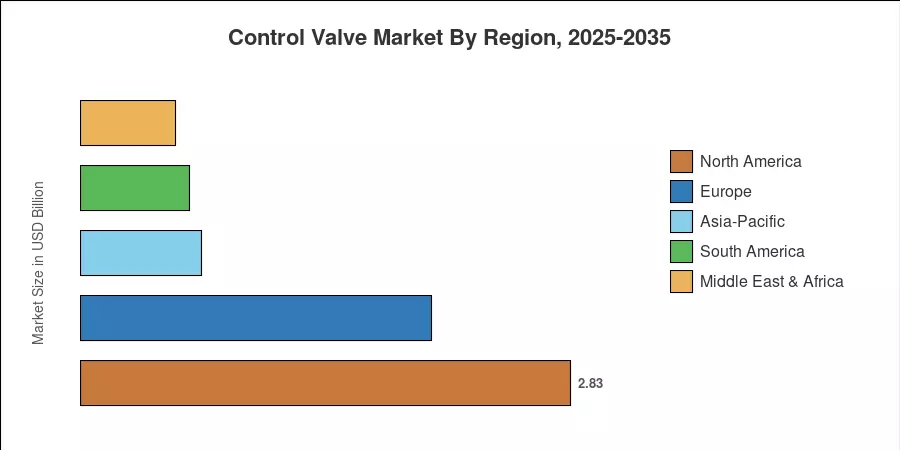
North America 36.0% share (2025) Midstream methane compliance; pharma CDMO build-out
Europe USD 2.03 Billion (2025) Green-hydrogen valve specs; IED-2024 retrofit cycle
Asia-Pacific 8.95% CAGR (2026โ€“2035) Municipal water infrastructure; refinery expansion
South America USD 0.63 Billion (2025) Pre-salt offshore oil; mining process automation
Middle East & Africa 7.0% share (2025) Desalination mega-projects; petrochemical diversification
Total USD 7.85 Billion (2025) โ€”

The Control Valve Market exhibits a clear geographic hierarchy, with North America leading on installed base and regulatory-driven upgrades, while Asia-Pacific delivers the steepest growth trajectory through greenfield industrial construction.

ย 

North America

Country Key Metric Key Driver
US 72.4% of regional share EPA methane rule; LNG export terminal valves
Canada 7.15% CAGR Oil-sands decarbonization retrofits
Mexico USD 0.17 Billion Nearshoring-driven chemical plant expansion

ย 

North America's Control Valve Market benefits from a mature installed base undergoing regulatory-driven modernization. The EPA Methane Emissions Reduction Program, combined with DOE hydrogen hub selections totaling USD 7 Billion, creates parallel procurement streams for both conventional and next-generation valve architectures across the continent [2][10].

Europe

Country Key Metric Key Driver
Germany 22.6% of regional share Chemical-sector decarbonization; Industrie 4.0 retrofits
UK USD 0.31 Billion North Sea decommissioning and offshore wind hydrogen
France 7.85% CAGR Nuclear fleet refurbishment and SMR pilots
Italy USD 0.21 Billion Downstream refining modernization
Spain 6.9% CAGR Renewable-hydrogen corridor development
Nordic Countries USD 0.16 Billion Battery gigafactory process utilities
Russia 5.8% CAGR Domestic substitution of Western valve imports
Rest of Europe USD 0.24 Billion Wastewater treatment directive compliance

ย 

European demand for the Control Valve Market is shaped by two regulatory pillars: the EU Industrial Emissions Directive recast and the REPowerEU hydrogen strategy. Together, these frameworks mandate equipment upgrades at over 3,000 large industrial installations while simultaneously creating new valve demand along planned hydrogen backbone corridors connecting Spain, Germany, and the Netherlands [3][8].

Asia-Pacific

Country Key Metric Key Driver
China 38.5% of regional share "Dual Carbon" refinery retrofits; coal-to-chemicals
India 9.45% CAGR Jal Jeevan Mission; refinery capacity additions
Japan USD 0.28 Billion SMR development; ammonia co-firing retrofits
South Korea 7.6% CAGR Semiconductor fab cleanroom utility systems
ASEAN USD 0.19 Billion Petrochemical and palm-oil refining expansion
Rest of Asia-Pacific 7.2% CAGR Mining and mineral-processing automation

ย 

Asia-Pacific's rapid expansion within the Control Valve Market stems from parallel infrastructure buildouts in water, energy, and downstream chemicals. China's 14th Five-Year Plan for ecological protection targets advanced treatment at 90% of urban wastewater plants by 2030, while India's refining capacity is set to increase by over 50 MTPA through 2028 [9][17].

South America

Country Key Metric Key Driver
Brazil 61.8% of regional share Pre-salt deepwater oil production expansion
Argentina 7.3% CAGR Vaca Muerta shale gas development
Rest of South America USD 0.08 Billion Mining process-water treatment upgrades

ย 

Brazil's Petrobras-led pre-salt development program continues to anchor South American demand, with FPSO vessel orders each requiring 1,200โ€“1,800 control valves rated for subsea and topsides service [5].

Middle East & Africa

Country Key Metric Key Driver
Saudi Arabia 34.2% of regional share NEOM and Vision 2030 industrial cities
UAE 8.1% CAGR Desalination and downstream diversification
South Africa USD 0.05 Billion Mining and power-generation retrofits
Egypt 7.5% CAGR Suez Canal Economic Zone Industrialization
Rest of MEA USD 0.09 Billion East African geothermal and water projects

ย 

Saudi Arabia's giga-project pipelineโ€”spanning NEOM, Jubail 2, and Ras Al-Khair desalinationโ€”anchors the region's Control Valve Market. These projects feature high-specification valve requirements for seawater service, high-temperature utility systems, and corrosive chemical environments [17].

ย 

Control Valve Market By Region, 2025-2035

Competitive Benchmarking

The Control Valve Market exhibits medium concentration, with the top five suppliers commanding an estimated 42โ€“48% of global revenue. The Herfindahl-Hirschman Index (HHI) sits in the 800โ€“1,100 range, indicating a moderately fragmented competitive field. Recent M&A activityโ€”particularly Emerson's integration of control-valve lines and Flowserve's digital-services expansionโ€”is gradually consolidating the upper tier, while Asian manufacturers like KITZ and Azbil compete aggressively on cost in commodity butterfly and ball valve categories [18][19].

Company Est. Revenue Share Range Key Offerings for the Control Valve Market Strategic Positioning
Emerson Electric Co. ~12โ€“15% Fisher globe, butterfly, rotary valves; DeltaV integration Full-stack automation platform; largest installed base
Flowserve Corporation ~8โ€“11% Valtek, Kammer, Limitorque actuated assemblies Aftermarket strength; ValveSight digital diagnostics
Valmet Oyj ~6โ€“9% Neles ball, butterfly, and segment valves Pulp & paper specialization; merged Neles platform
IMI plc ~5โ€“8% CCI severe-service trim; IMI STI nuclear-grade valves Critical-application focus: nuclear and power
Baker Hughes Company ~4โ€“7% Masoneilan, Consolidated pressure-relief valves Oil & gas integration; Cordant software analytics
Samson AG ~3โ€“5% SAMSON positioners, self-operated regulators Mid-market European strength; strong in the chemical sector
Spirax Group plc ~3โ€“5% Spirax Sarco steam-system control valves Steam and thermal energy niche; high-margin aftermarket
Honeywell International ~2โ€“4% Honeywell UOP process valves; Maxon combustion Diversified industrial automation platform
KITZ Corporation ~2โ€“4% Industrial ball, gate, and butterfly valves Cost-competitive Asian manufacturing base
Azbil Corporation ~2โ€“3% Smart positioners, control valves for HVAC, and process Japanese precision engineering; building-automation crossover

ย 

ย 

Recent News & Developments

ย 

  • Flowserve Corporation (September 2024): Expanded the ValveSight predictive analytics platform to support electric actuators, enabling condition monitoring across mixed pneumatic-electric fleets [19].
  • IMI plc (March 2024): Received American Society of Mechanical Engineers (ASME) N-stamp certification for its next-generation severe-service globe valves designed for SMR primary-loop piping [7].
  • U.S. EPA (December 2024): Finalized the Methane Emissions Reduction Program, setting per-ton fees on excess methane emissions and driving demand for zero-fugitive-emission valve packing technologies [10].
  • European Commission (January 2025): Published implementing guidelines for the revised Industrial Emissions Directive (IED-2024), establishing packing-leakage thresholds below 100 ppm for large combustion and chemical installations [3].
  • Baker Hughes (August 2023): Announced integration of Masoneilan control-valve diagnostics into the Cordant asset-performance-management platform, targeting predictive-maintenance contracts in LNG facilities [21].
  • KITZ Corporation (February 2025): Opened a new automated valve assembly line in Vietnam, expanding Southeast Asian production capacity by approximately 35% to serve cost-sensitive regional demand [22].

ย 

Control Valve Market Report Scope

Parameter Detail
Market Scope Global Control Valve Market โ€” valves with modulating or on-off control capability across industrial end users
Study Period 2021โ€“2035
CAGR (Forecast) 7.90% (2026โ€“2035)
Base Year Market Size USD 7.85 Billion (2025)
Forecast Endpoint USD 16.79 Billion (2035)
Fastest Growing Segment Electric actuators (by actuation); Pharmaceuticals (by end user); Alloy-based (by material)
Companies Profiled 10 (Emerson, Flowserve, Valmet, IMI, Baker Hughes, Samson, Spirax, Honeywell, KITZ, Azbil)
Valuation Currency USD Billion

ย 

ย 

FAQs

What is the projected size of the Control Valve Market by 2035?
The Control Valve Market is forecast to reach USD 16.79 Billion by 2035, growing at a 7.90% CAGR from 2026. Water infrastructure and emission regulations are the primary expansion catalysts [1].
Which valve type holds the largest share in the Control Valve Market?
Butterfly valves led with a 32.1% revenue share in 2025, driven by demand in water distribution and HVAC systems [1].
What actuation technology is growing fastest in the Control Valve Market?
Electric actuators are expanding at a 10.75% CAGR through 2035, propelled by plant electrification and native digital communication [12].
How do lifecycle costs compare between pneumatic and electric control valves?
Electric actuators typically eliminate compressed-air infrastructure costs, reducing total lifecycle expense by 20โ€“30% over a 15-year service period despite higher upfront pricing [12][15].
Which end-user industry offers the strongest growth for the Control Valve Market?
Pharmaceuticals are forecast to grow at a 9.75% CAGR through 2035, driven by biologics CDMO expansion and continuous-manufacturing adoption [11].
What role does hydrogen readiness play in control valve procurement decisions?
Hydrogen service demands embrittlement-resistant alloys and cryogenic sealing, pushing procurement toward premium valve specifications with 30โ€“50% price premiums over standard units [8][23].
How are digital diagnostics changing aftermarket strategies in the Control Valve Market?
Cloud-connected positioners enable predictive maintenance, allowing OEMs to shift toward outcome-based service contracts that generate recurring revenue alongside traditional spare-parts sales [13][18]. ย  ย 
Author
Author
Author Profile
Priya Nagrale LinkedIn
Senior Research Analyst
With an experience of over five years in market research industry (Chemicals & Materials domain), I gather and analyze market data from diverse sources to produce results, which are then presented back to a client. Also, provide recommendations based on the findings. As a Senior Research Analyst, I perform quality checks (QC) for market estimations, QC for reports, and handle queries and work extensively on client customizations. Also, handle the responsibilities of client proposals, report planning, report finalization, and execution

Research Approach

ย 

Secondary Research

The secondary research process involved comprehensive analysis of technical standards databases, regulatory filings, industry association publications, and process engineering literature. Key sources included the International Electrotechnical Commission (IEC 60534 series standards for industrial-process control valves), International Society of Automation (ISA-75 control valve standards), American Petroleum Institute (API 598 valve inspection/testing, API 6D pipeline valves), American Society of Mechanical Engineers (ASME B16.34, B31.3 piping codes), and International Organization for Standardization (ISO 5211 actuator attachments, ISO 15848 fugitive emissions). Industry associations such as the Valve Manufacturers Association (VMA), British Valve & Actuator Association (BVAA), Japan Valve Manufacturers Association (JVMA), and Manufacturers Standardization Society (MSS) provided shipment data and industry trend analysis. Government and regulatory sources included the US Department of Energy (DOE) Industrial Assessment Center database, Environmental Protection Agency (EPA) emissions compliance data, EU Eurostat Industrial Production indices, US Bureau of Safety and Environmental Enforcement (BSEE) facility reports, and NACE International (AMPP) corrosion standards (MR0175). Technical literature from IEEE Xplore (automation control systems), ScienceDirect (fluid dynamics research), and ChemEng Online provided insights on smart valve technologies and materials science advancements.

Certification requirements, standards compliance data, installation statistics by end-use sector, and technology landscape analysis for rotary valves (ball, butterfly, plug), linear valves (globe, diaphragm), pneumatic/electric/hydraulic actuation systems, and severe-service materials were gathered using these sources.

ย 

Primary Research

Qualitative and quantitative insights were obtained by interviewing supply-side and demand-side stakeholders during the primary research process. CEOs, VPs of Product Engineering, Chief Technology Officers, regulatory compliance leaders, and global sales directors from control valve manufacturers, actuator specialists, and component OEMs comprised supply-side sources. Demand-side sources included plant maintenance managers, EPC (Engineering, Procurement, Construction) procurement leads, process control engineers, reliability managers from oil and gas upstream/midstream operators, utility power plant engineers, chemical process managers, and water treatment facility directors. Market segmentation was validated across valve types (rotary versus linear), smart valve/digital positioner adoption timelines were confirmed, and insights on specification trends, predictive maintenance integration, lifecycle cost analysis, and procurement frameworks for critical service applications were gathered through primary research.

Primary Respondent Breakdown:

โ€ข By Designation: C-level Primaries (32%), Director Level (38%), Others (30%)

โ€ข By Region: North America (33%), Europe (29%), Asia-Pacific (31%), Rest of World (7%)

ย 

Market Size Estimation

Revenue mapping and unit shipment analysis were implemented to determine the global market valuation. The methodology comprised the following:

โ€ข The identification of over 40 significant manufacturers in North America, Europe, Asia-Pacific, the Middle East, and Latin America, such as Emerson Electric, Flowserve, IMI plc, Honeywell, Alfa Laval, AVK Holding, Velan, Burkert, and Valvitalia

โ€ข Product mapping for rotary valves (ball, butterfly, plug), linear valves (globe, diaphragm, gate), valve body materials (stainless steel, cast iron, alloy-based, cryogenic), actuation technologies (pneumatic, electric, hydraulic), and size categories (<1" to >50")

โ€ข Examination of annual revenues that are reported and modeled for control valve portfolios, with the exception of standalone on-off isolation valves and aftermarket spares

โ€ข In 2024, the coverage of manufacturers will account for 75-80% of the global market share.

โ€ข Segment-specific valuations for oil & gas, energy & power, chemical processing, and water/wastewater applications are derived through extrapolation using bottom-up (unit shipments ร— ASP by country/region, segmented by end-use industry) and top-down (manufacturer revenue validation, distributor margin analysis) approaches.

Download Free Sample

Kindly complete the form below to receive a free sample of this Report

Download PDF ×

We do not share your information with anyone. However, we may send you emails based on your report interest from time to time. You may contact us at any time to opt-out.
















