Segmentation Quick Reference
| Dimension | Sub-Segments | Dominant Segment | Fastest Growing Segment |
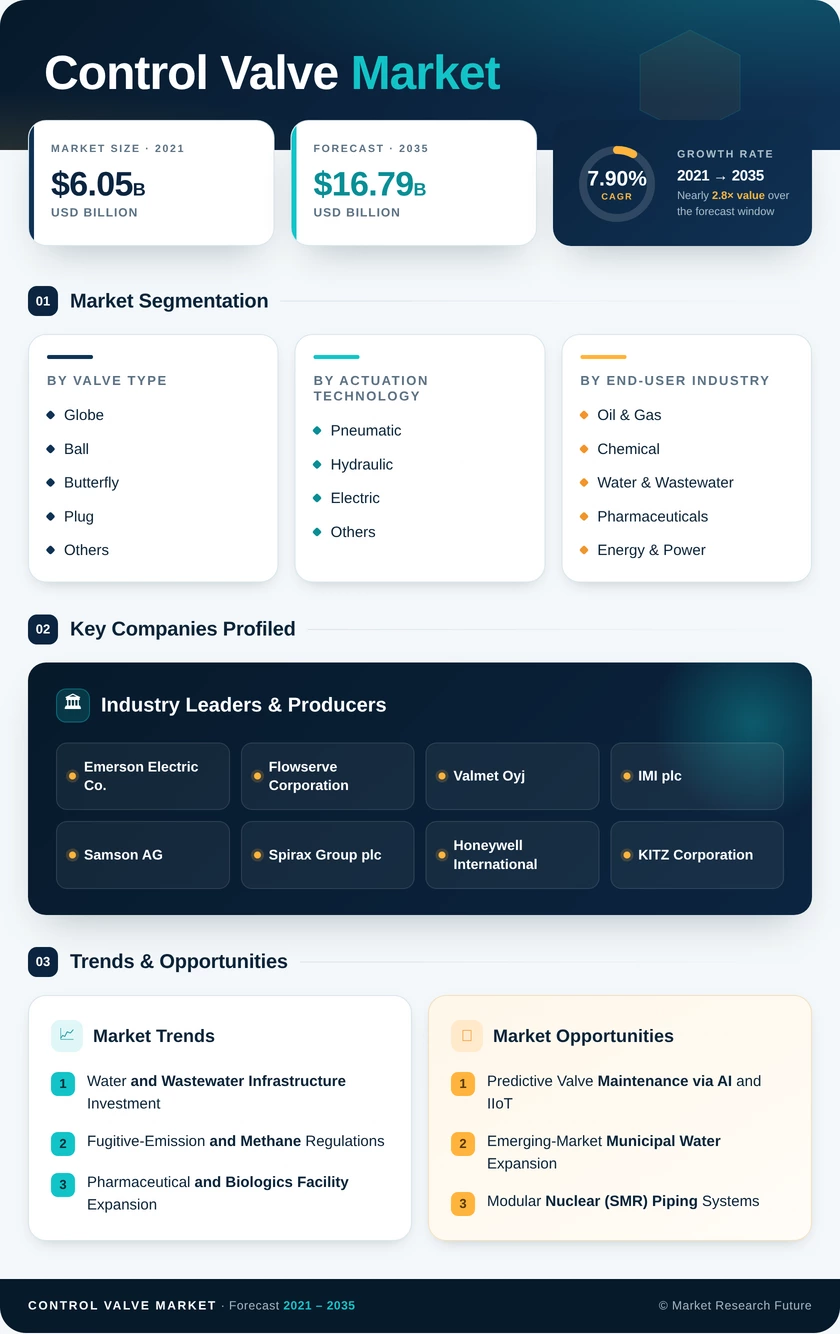
| Valve Type | Globe, Ball, Butterfly, Plug, Others | Butterfly (32.1% share, 2025) | Plug (8.35% CAGR) |
| Actuation Technology | Pneumatic, Hydraulic, Electric, Others | Pneumatic (43.9% share, 2025) | Electric (10.75% CAGR) |
| End-User Industry | Oil & Gas, Chemical, Water & Wastewater, Control Valve Markets, Control Valve Market, Petrochemical & Fertilizer, Others | Water & Wastewater (23.05% share, 2025) | Control Valve Markets (9.75% CAGR) |
| Material | Steel, Cast Iron, Alloy-Based, Plastic | Steel (44.8% share, 2025) | Alloy-Based (9.20% CAGR) |
| Geography | North America, Europe, Asia-Pacific, South America, Middle East & Africa | North America (36.0% share, 2025) | Asia-Pacific (8.95% CAGR) |
Market Segmentation Overview
By Valve Type
| Sub-Segment | Key Trend |
| Globe | High-precision throttling in pharma and nuclear-grade piping |
| Ball | Expanding in modulating duties with characterized-ball trim |
| Butterfly | Dominant in water treatment and HVAC large-diameter lines |
| Plug | Rising adoption of multiport diverting and corrosive-media isolation |
| Others | Niche applications in pinch, diaphragm, and gate configurations |
Globe and butterfly valves collectively represent over half of industry revenue, but ball and plug designs are narrowing the gap through engineered trim innovations that extend their applicability into precision-control duties previously reserved for globe-style bodies.
By Actuation Technology
| Sub-Segment | Key Trend |
| Pneumatic | Entrenched in safety instrumented systems requiring sub-second response |
| Hydraulic | Preferred for high-force subsea and long-stroke pipeline applications |
| Electric | Rapidly displacing pneumatic in greenfield facilities with Industry 4.0 architectures |
| Others | Includes manual-override and electrohydraulic hybrid configurations |
Pneumatic actuation remains the installed-base leader, but electric actuators are winning the majority of new-specification awards in greenfield chemical, pharmaceutical, and water-treatment plants due to energy efficiency and native digital connectivity.
By End-User Industry
| Sub-Segment | Key Trend |
| Oil and Gas | Upstream production optimization and midstream methane compliance |
| Chemical | Specialty-chemical capacity expansion in Asia and Europe |
| Water & Wastewater | Infrastructure rehabilitation and advanced nutrient-removal mandates |
| Control Valve Markets | Biologics CDMO expansion and continuous-manufacturing adoption |
| Control Valve Market | Thermal plant retrofits and SMR construction programs |
| Petrochemical & Fertilizer | Downstream integration and feedstock-diversification projects |
| Others | Food & beverage, pulp & paper, and mining process automation |
Water and wastewater overtook oil and gas as the top end-user segment in 2025, reflecting the global prioritization of water security and the softening of upstream exploration capex cyclicality.
By Material
| Sub-Segment | Key Trend |
| Steel | General-purpose industrial standard across temperature and pressure ranges |
| Cast Iron | Cost-effective option for low-pressure municipal distribution |
| Alloy-Based | Growing in hydrogen, cryogenic, and severe-corrosion service environments |
| Plastic | Adopted in chemical dosing, semiconductor, and ultrapure water systems |
Alloy-based materials are experiencing the strongest growth trajectory as hydrogen-readiness, offshore sour-gas, and high-temperature power applications push end users toward Inconel, Hastelloy, and duplex stainless-steel valve bodies.