• Cat-intel
  • MedIntelliX
  • Resources
  • About Us
  • Hero Background
    English
    Chinese
    French
    Japanese
    Korean
    German
    Spanish

    Controlled Release Fertilizers Size

    ID: MRFR/AGR/4540-HCR
    128 Pages
    Tejas Chaudhary
    October 2025

    Controlled-release Fertilizers Market Research Report Information by Technology (Coating and Encapsulation), Form (Liquid, Granular and Powder), Mode of Application (Dibbling, Foliar and other) and Region (North America, Europe, Asia-Pacific and Rest of the World) - Forecast till 2035

    Share:
    Download PDF ×

    We do not share your information with anyone. However, we may send you emails based on your report interest from time to time. You may contact us at any time to opt-out.

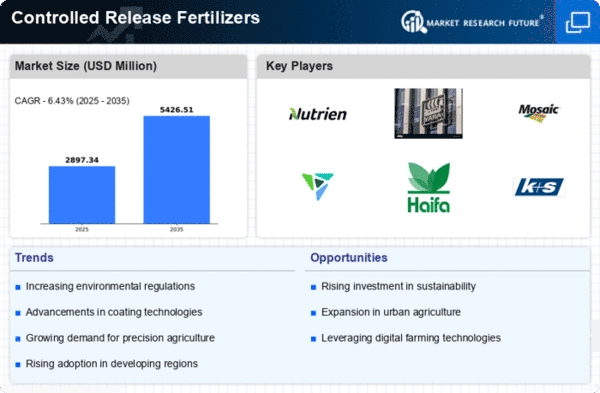
    Controlled Release Fertilizers Infographic
    $ 4,950.0
    $ 5,950.0
    $ 7,250.0

    Controlled Release Fertilizers Size

    Controlled Release Fertilizers Growth Projections and Opportunities

    Controlled-release fertilizers (CRF) have seen a significant shift in their market dynamics in recent years, reflecting the changing agricultural environment and the need for sustainable farming practices. One of the main drivers of this growth is the global rise in population and, hence, food demand. Advanced fertilizers that ensure better nutrient management are being opted for by farmers to improve crop yields and productivity. This is where controlled-release fertilizers come in as they provide nutrients slowly to crops and avoid leaching or volatilization losses at the highest level possible. Environmental concerns have also played a part in changing the dynamics of controlled-release fertilizers markets. Traditional fertilizers may cause nutrient runoff, resulting in water pollution that can negatively affect ecosystems. At the same time, technological progress, as well as innovations within agriculture, have led to new formulations and application techniques for CRFs. There is a growing trend towards customized precision agricultural solutions that enable farmers to regulate fertilizer release rates based on specific crop requirements and soil conditions. While better utilization of these resources can contribute positively towards cost-effective practices, it also provides a more efficient means of applying fertilizers. The competitive landscape of the market for control-release fertilizers is marked by key players who constantly invest in R&D activities aimed at entering new products with improved properties across such areas as production technology. Nonetheless, issues like high initial costs compared to traditional options still hinder increased use while farmers continue to require proper guidance before they start using them." The world has been affected by the COVID-19 outbreak, thereby influencing Controlled-Release Fertilizers Market Outlook severely." Governments around the globe have taken drastic measures that restrict travel across many regions due to its spread worldwide during this pandemic period, only allowing essential movements during this period through imposing travel bans, including the closure of airports; thus, the movement has been restricted due to lockdowns imposed by nations all over our globe against Covid 19 pandemic. This has necessitated higher demand for controlled-release fertilizers as many farmers and landowners seek ways to enhance crop productivity. However, the supply chain has been significantly disrupted, with manufacturing companies struggling to obtain the necessary raw materials for fertilizer production.
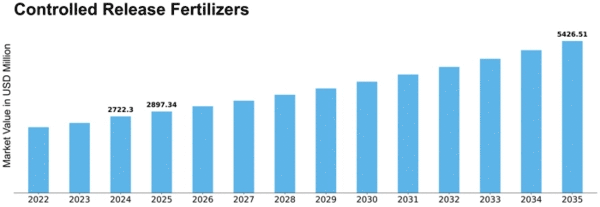
    Controlled Release Fertilizers Size Graph

    Market Summary

    As per Market Research Future Analysis, the Controlled-Release Fertilizers Market was valued at USD 1.96 billion in 2023 and is projected to grow from USD 2.08 billion in 2024 to USD 3.58 billion by 2032, with a CAGR of 7.02% during the forecast period (2024 - 2032). The market is driven by the need to enhance agricultural productivity through the gradual release of fertilizers, which improves soil quality and crop yield while reducing environmental impact and costs. The COVID-19 pandemic initially disrupted supply chains, increasing demand for controlled-release fertilizers as farmers faced challenges in accessing traditional fertilizers. Recent developments include EuroChem's new phosphate facility in Brazil and Mivena's introduction of vegan and organic fertilizers, highlighting innovation in the sector.

    Key Market Trends & Highlights

    The Controlled-Release Fertilizers Market is witnessing significant growth driven by technological advancements and environmental considerations.

    • Market Size in 2023: USD 1.96 billion.
    • Projected Market Size by 2032: USD 3.58 billion.
    • CAGR during 2024-2032: 7.02%.
    • Key players include Agrium Inc, Agro Bridge, and Haifa Chemicals Ltd.

    Market Size & Forecast

    2023 Market Size USD 1.96 billion
    2024 Market Size USD 2.08 billion
    2032 Market Size USD 3.58 billion
    CAGR (2024-2032) 7.02%
    Dominating Region Asia-Pacific.

    Major Players

    Agrium Inc, Agro Bridge, Haifa Chemicals Ltd, Shikefeng Chemical Industry

    Market Trends

    The increasing emphasis on sustainable agricultural practices appears to drive the adoption of controlled-release fertilizers, which may enhance nutrient efficiency and reduce environmental impact.

    U.S. Department of Agriculture

    Controlled Release Fertilizers Market Drivers

    Increasing Demand for Sustainable Agriculture

    The Global Controlled-Release Fertilizers Market Industry is experiencing a notable shift towards sustainable agricultural practices. Farmers are increasingly adopting controlled-release fertilizers to enhance nutrient efficiency and minimize environmental impact. This trend aligns with global initiatives aimed at reducing chemical runoff and promoting soil health. As a result, the market is projected to reach 2.08 USD Billion in 2024, reflecting the growing preference for eco-friendly solutions. The emphasis on sustainability is likely to drive innovation in fertilizer formulations, further expanding the market's reach and appeal.

    Market Segment Insights

    Regional Insights

    Key Companies in the Controlled Release Fertilizers market include

    Industry Developments

    The Controlled-Release Fertilizers Market Trends is one of the advancements of the technique which has the highest reach and benefits. After the lockdown, the people are interested in getting the controlled–release fertilizer as this provides less harm to the human as well as to nature when compared to other fertilizers. Due to this heavy demand, the manufacturing companies are increasing their productivity to compensate for the need of the customer. In addition to this, they are planning to expand their business once they get the proper financial source.

    Regional analysis

    The dominating region in the Asia Pacific region in which there is the demand for food and the raw materials for the food. As there was rapid growth in the population so the demand for food was high. So the agricultural activities were also high. So this region is dominating region when compared to the other regions. The dominating countries are China, India, Japan etc.

    The second place for holding the largest share in North America, as there were good agricultural technologies and good agricultural farming machines. So the second leading country in North America.

    Controlled-release Fertilizers Market Segment Overview

    Crop Type

    • Cereals & grains
    • Oilseeds & pulses
    • Fruits & vegetables
      • Plantation crops
    Application Type
      • Foliar application
      • Fustigation
      • Other

    Product Type

    • Coated & encapsulated
    • Nitrogen stabilizers (N-Stabilizers)

    By Region

    • North America
    •  Europe
    • Asia-Pacific

    Future Outlook

    Controlled Release Fertilizers Future Outlook

    The Global Controlled-Release Fertilizers Market is projected to grow at a 7.02% CAGR from 2024 to 2035, driven by technological advancements, increasing agricultural productivity demands, and environmental sustainability initiatives.

    New opportunities lie in:

    • Develop biodegradable controlled-release fertilizers to meet eco-friendly consumer preferences.
    • Invest in precision agriculture technologies to enhance fertilizer application efficiency.
    • Expand distribution networks in emerging markets to capture growing agricultural sectors.

    By 2035, the market is expected to achieve substantial growth, reflecting evolving agricultural practices and sustainability trends.

    Market Segmentation

    Report Scope

    Market Highlights

    Author

    Tejas Chaudhary
    Research Analyst Level II

    She holds an experience of about 6+ years in market research and business consulting, working under the spectrum of information communication technology, telecommunications and semiconductor domains. aarti conceptualizes and implements a scalable business strategy and provides strategic leadership to the clients. her expertise lies in market estimation, competitive intelligence, pipeline analysis, customer assessment, etc.

    Leave a Comment

    Latest Comments

    John Doe
    john@example.com

    This is a great article! Really helped me understand the topic better.

    Posted on July 23, 2025, 10:15 AM
    Jane Smith
    jane@domain.com

    Thanks for sharing this. I’ve bookmarked it for later reference.

    Posted on July 22, 2025, 7:45 PM

    FAQs

    What is the previous valuation of the global controlled-release fertilizers industry?

    controlled-release fertilizers market value was USD 3.58 billion by 2032.

    What is the growth rate of the global controlled-release fertilizers industry?

    controlled-release fertilizers market is expected to thrive at a CAGR of 6.5% from 2024 to 2032.

    What is the major driver of the global controlled-release fertilizers?

    Development of high-efficiency fertilizers which can minimize the loss of nutrients is the major driver of the global controlled-release fertilizers market.

    What factors restrain the global controlled-release fertilizers industry?

    Lack of skilled laborers and presence of counterfeit products can hamper the global controlled-release fertilizers market growth.

    Which region can dominate in the global controlled-release fertilizers industry?

    The APAC region can dominate the global controlled-release fertilizers market due to adoption of modern agricultural practices.

    Name the notable players of the global controlled-release fertilizers industry?

    Agrium, Scottsmiracle-Gro, Helena Chemical, Yara International, Jcam Agri., Haifa Chemicals Ltd, Compo Expert GmbH, SQM, Kingenta, Koch Industries, ICL, and BASF SE are major players of the global controlled-release fertilizers market.

    1. List of Tables and Figures
      1. |-
      2. Table of Contents 1. Executive Summary 2. Market Introduction 2.1. Market Definition 2.2. Scope of the Study 2.2.1. Research Objectives 2.2.2. Assumptions & Limitations 2.3. Market Structure 3. MARKET Research Methodology 3.1. Research Process 3.2. Secondary Research 3.3. Primary Research 3.4. Forecast Model 4. MARKET LANDSCAPE 4.1. Supply Chain Analysis 4.1.1. Raw Material Suppliers 4.1.2. Manufacturers/Producers 4.1.3. Distributors/Retailers/Wholesalers/E-Commerce 4.1.4. End Users 4.2. Porter’s Five Forces Analysis 4.2.1. Threat of New Entrants 4.2.2. Bargaining Power of Buyers 4.2.3. Bargaining Power of Suppliers 4.2.4. Threat of Substitutes 4.2.5. Internal Rivalry 5. MARKET DYNAMICS OF THE GLOBAL CONTROLLED-RELEASE FERTILIZERS MARKET 5.1. Introduction 5.2. Drivers 5.3. Restraints 5.4. Opportunities 5.5. Challenges 6. GLOBAL CONTROLLED-RELEASE FERTILIZERS MARKET, BY TECHNOLOGY 6.1. Introduction 6.2. Coating 6.2.1. Market Estimates & Forecast, 2024-2032 6.2.2. Market Estimates & Forecast, by Region, 2024-2032 6.3. Encapsulation 6.3.1. Market Estimates & Forecast, 2024-2032 6.3.2. Market Estimates & Forecast, by Region, 2024-2032 7. GLOBAL CONTROLLED-RELEASE FERTILIZERS MARKET, BY FORM 7.1. Introduction 7.2. Liquid 7.2.1. Market Estimates & Forecast, 2024-2032 7.2.2. Market Estimates & Forecast, by Region, 2024-2032 7.3. Granular 7.3.1. Market Estimates & Forecast, 2024-2032 7.3.2. Market Estimates & Forecast, by Region, 2024-2032 7.4. Powder 7.4.1. Market Estimates & Forecast, 2024-2032 7.4.2. Market Estimates & Forecast, by Region, 2024-2032 8. GLOBAL CONTROLLED-RELEASE FERTILIZERS MARKET, BY MODE OF APPLICATION 8.1. Introduction 8.2. Dibbling 8.2.1. Market Estimates & Forecast, 2024-2032 8.2.2. Market Estimates & Forecast, by Region, 2024-2032 8.3. Foliar 8.3.1. Market Estimates & Forecast, 2024-2032 8.3.2. Market Estimates & Forecast, by Region, 2024-2032 8.4. Other 8.4.1. Market Estimates & Forecast, 2024-2032 8.4.2. Market Estimates & Forecast, by Region, 2024-2032 9. GLOBAL CONTROLLED-RELEASE FERTILIZERS MARKET, BY APPLICATION 9.1. Introduction 9.2. Cereals & Grains 9.2.1. Market Estimates & Forecast, 2024-2032 9.2.2. Market Estimates & Forecast, by Region, 2024-2032 9.3. Oilseeds & Pulses 9.3.1. Market Estimates & Forecast, 2024-2032 9.3.2. Market Estimates & Forecast, by Region, 2024-2032 9.4. Turfs & Ornamentals 9.4.1. Market Estimates & Forecast, 2024-2032 9.4.2. Market Estimates & Forecast, by Region, 2024-2032 9.5. Fruits & Vegetables 9.5.1. Market Estimates & Forecast, 2024-2032 9.5.2. Market Estimates & Forecast, by Region, 2024-2032 9.6. Others 9.6.1. Market Estimates & Forecast, 2024-2032 9.6.2. Market Estimates & Forecast, by Region, 2024-2032 10. GLOBAL CONTROLLED-RELEASE FERTILIZERS MARKET, BY REGION 10.1. Introduction 10.2. North America 10.2.1. Market Estimates & Forecast, 2024-2032 10.2.2. Market Estimates & Forecast, by Technology, 2024-2032 10.2.3. Market Estimates & Forecast, by Form, 2024-2032 10.2.4. Market Estimates & Forecast, by Mode of Application, 2024-2032 10.2.5. Market Estimates & Forecast, by Application, 2024-2032 10.2.6. Market Estimates & Forecast, by Country, 2024-2032 10.2.7. US 10.2.7.1. Market Estimates & Forecast, by Technology, 2024-2032 10.2.7.2. Market Estimates & Forecast, by Form, 2024-2032 10.2.7.3. Market Estimates & Forecast, by Mode of Application, 2024-2032 10.2.7.4. Market Estimates & Forecast, by Application, 2024-2032 10.2.8. Canada 10.2.8.1. Market Estimates & Forecast, by Technology, 2024-2032 10.2.8.2. Market Estimates & Forecast, by Form, 2024-2032 10.2.8.3. Market Estimates & Forecast, by Mode of Application, 2024-2032 10.2.8.4. Market Estimates & Forecast, by Application, 2024-2032 10.2.9. Mexico 10.2.9.1. Market Estimates & Forecast, by Technology, 2024-2032 10.2.9.2. Market Estimates & Forecast, by Form, 2024-2032 10.2.9.3. Market Estimates & Forecast, by Mode of Application, 2024-2032 10.2.9.4. Market Estimates & Forecast, by Application, 2024-2032 10.3. Europe 10.3.1. Market Estimates & Forecast, 2024-2032 10.3.2. Market Estimates & Forecast, by Technology, 2024-2032 10.3.3. Market Estimates & Forecast, by Form, 2024-2032 10.3.4. Market Estimates & Forecast, by Mode of Application, 2024-2032 10.3.5. Market Estimates & Forecast, by Application, 2024-2032 10.3.6. Market Estimates & Forecast, by Country, 2024-2032 10.3.7. Germany 10.3.7.1. Market Estimates & Forecast, by Technology, 2024-2032 10.3.7.2. Market Estimates & Forecast, by Form, 2024-2032 10.3.7.3. Market Estimates & Forecast, by Mode of Application, 2024-2032 10.3.7.4. Market Estimates & Forecast, by Application, 2024-2032 10.3.8. UK 10.3.8.1. Market Estimates & Forecast, by Technology, 2024-2032 10.3.8.2. Market Estimates & Forecast, by Form, 2024-2032 10.3.8.3. Market Estimates & Forecast, by Mode of Application, 2024-2032 10.3.8.4. Market Estimates & Forecast, by Application, 2024-2032 10.3.9. France 10.3.9.1. Market Estimates & Forecast, by Technology, 2024-2032 10.3.9.2. Market Estimates & Forecast, by Form, 2024-2032 10.3.9.3. Market Estimates & Forecast, by Mode of Application, 2024-2032 10.3.9.4. Market Estimates & Forecast, by Application, 2024-2032 10.3.10. Spain 10.3.10.1. Market Estimates & Forecast, by Technology, 2024-2032 10.3.10.2. Market Estimates & Forecast, by Form, 2024-2032 10.3.10.3. Market Estimates & Forecast, by Mode of Application, 2024-2032 10.3.10.4. Market Estimates & Forecast, by Application, 2024-2032 10.3.11. Italy 10.3.11.1. Market Estimates & Forecast, by Technology, 2024-2032 10.3.11.2. Market Estimates & Forecast, by Form, 2024-2032 10.3.11.3. Market Estimates & Forecast, by Mode of Application, 2024-2032 10.3.11.4. Market Estimates & Forecast, by Application, 2024-2032 10.3.12. Rest of Europe 10.3.12.1. Market Estimates & Forecast, by Technology, 2024-2032 10.3.12.2. Market Estimates & Forecast, by Form, 2024-2032 10.3.12.3. Market Estimates & Forecast, by Mode of Application, 2024-2032 10.3.12.4. Market Estimates & Forecast, by Application, 2024-2032 10.4. Asia-Pacific 10.4.1. Market Estimates & Forecast, 2024-2032 10.4.2. Market Estimates & Forecast, by Technology, 2024-2032 10.4.3. Market Estimates & Forecast, by Form, 2024-2032 10.4.4. Market Estimates & Forecast, by Mode of Application, 2024-2032 10.4.5. Market Estimates & Forecast, by Application, 2024-2032 10.4.6. Market Estimates & Forecast, by Country, 2024-2032 10.4.7. China 10.4.7.1. Market Estimates & Forecast, by Technology, 2024-2032 10.4.7.2. Market Estimates & Forecast, by Form, 2024-2032 10.4.7.3. Market Estimates & Forecast, by Mode of Application, 2024-2032 10.4.7.4. Market Estimates & Forecast, by Application, 2024-2032 10.4.8. Japan 10.4.8.1. Market Estimates & Forecast, by Technology, 2024-2032 10.4.8.2. Market Estimates & Forecast, by Form, 2024-2032 10.4.8.3. Market Estimates & Forecast, by Mode of Application, 2024-2032 10.4.8.4. Market Estimates & Forecast, by Application, 2024-2032 10.4.9. India 10.4.9.1. Market Estimates & Forecast, by Technology, 2024-2032 10.4.9.2. Market Estimates & Forecast, by Form, 2024-2032 10.4.9.3. Market Estimates & Forecast, by Mode of Application, 2024-2032 10.4.9.4. Market Estimates & Forecast, by Application, 2024-2032 10.4.10. Australia & New Zealand 10.4.10.1. Market Estimates & Forecast, by Technology, 2024-2032 10.4.10.2. Market Estimates & Forecast, by Form, 2024-2032 10.4.10.3. Market Estimates & Forecast, by Mode of Application, 2024-2032 10.4.10.4. Market Estimates & Forecast, by Application, 2024-2032 10.4.11. Rest of Asia-Pacific 10.4.11.1. Market Estimates & Forecast, by Technology, 2024-2032 10.4.11.2. Market Estimates & Forecast, by Form, 2024-2032 10.4.11.3. Market Estimates & Forecast, by Mode of Application, 2024-2032 10.4.11.4. Market Estimates & Forecast, by Application, 2024-2032 10.5. Rest of the World 10.5.1. Market Estimates & Forecast, 2024-2032 10.5.2. Market Estimates & Forecast, by Technology, 2024-2032 10.5.3. Market Estimates & Forecast, by Form, 2024-2032 10.5.4. Market Estimates & Forecast, by Mode of Appplication, 2024-2032 10.5.5. Market Estimates & Forecast, by Appplication, 2024-2032 10.5.6. Market Estimates & Forecast, by Country, 2024-2032 10.5.7. South America 10.5.7.1. Market Estimates & Forecast, by Technology, 2024-2032 10.5.7.2. Market Estimates & Forecast, by Form, 2024-2032 10.5.7.3. Market Estimates & Forecast, by Mode of Application, 2024-2032 10.5.7.4. Market Estimates & Forecast, by Application, 2024-2032 10.5.8. Middle East 10.5.8.1. Market Estimates & Forecast, by Technology, 2024-2032 10.5.8.2. Market Estimates & Forecast, by Form, 2024-2032 10.5.8.3. Market Estimates & Forecast, by Mode of Application, 2024-2032 10.5.8.4. Market Estimates & Forecast, by Application, 2024-2032 10.5.9. Africa 10.5.9.1. Market Estimates & Forecast, by Technology, 2024-2032 10.5.9.2. Market Estimates & Forecast, by Form, 2024-2032 10.5.9.3. Market Estimates & Forecast, by Mode of Application, 2024-2032 10.5.9.4. Market Estimates & Forecast, by Application, 2024-2032 11. Competitive Landscape 11.1. Introduction 11.2. Market Key Strategies 11.3. Key Development Analysis (Expansions/Mergers & Acquisitions/Joint Ventures/New Product Developments/Agreements/Investments) 12. COMPANY PROFILES 12.1. BASF SE 12.1.1. Company Overview 12.1.2. Financial Updates 12.1.3. Product/Business Segment Overview 12.1.4. Key Strategies 12.1.5. Key Developments 12.1.6. SWOT Analysis 12.2. Yara International 12.2.1. Company Overview 12.2.2. Financial Updates 12.2.3. Product/Business Segment Overview 12.2.4. Key Strategies 12.2.5. Key Developments 12.2.6. SWOT Analysis 12.3. Haifa Chemicals Ltd 12.3.1. Company Overview 12.3.2. Financial Updates 12.3.3. Product/Business Segment Overview 12.3.4. Key Strategies 12.3.5. Key Developments 12.3.6. SWOT Analysis 12.4. Koch Industries 12.4.1. Company Overview 12.4.2. Financial Updates 12.4.3. Product/Business Segment Overview 12.4.4. Key Strategies 12.4.5. Key Developments 12.4.6. SWOT Analysis 12.5. Scottsmiracle-Gro 12.5.1. Company Overview 12.5.2. Financial Updates 12.5.3. Product/Business Segment Overview 12.5.4. Key Strategies 12.5.5. Key Developments 12.5.6. SWOT Analysis 12.6. Compo Expert GmbH 12.6.1. Company Overview 12.6.2. Financial Updates 12.6.3. Product/Business Segment Overview 12.6.4. Key Strategies 12.6.5. Key Developments 12.6.6. SWOT Analysis 12.7. Agrium 12.7.1. Company Overview 12.7.2. Financial Updates 12.7.3. Product/Business Segment Overview 12.7.4. Key Strategies 12.7.5. Key Developments 12.7.6. SWOT Analysis 12.8. Jcam Agri. 12.8.1. Company Overview 12.8.2. Financial Updates 12.8.3. Product/Business Segment Overview 12.8.4. Key Strategies 12.8.5. Key Developments 12.8.6. SWOT Analysis 12.9. Helena Chemical 12.9.1. Company Overview 12.9.2. Financial Updates 12.9.3. Product/Business Segment Overview 12.9.4. Key Strategies 12.9.5. Key Developments 12.9.6. SWOT Analysis 12.10. ICL 12.10.1. Company Overview 12.10.2. Financial Updates 12.10.3. Product/Business Segment Overview 12.10.4. Key Strategies 12.10.5. Key Developments 12.10.6. SWOT Analysis 12.11. Kingenta 12.11.1. Company Overview 12.11.2. Financial Updates 12.11.3. Product/Business Segment Overview 12.11.4. Key Strategies 12.11.5. Key Developments 12.11.6. SWOT Analysis 12.12. SQM 12.12.1. Company Overview 12.12.2. Financial Updates 12.12.3. Product/Business Segment Overview 12.12.4. Key Strategies 12.12.5. Key Developments 12.12.6. SWOT Analysis 13. CONCLUSION LIST OF TABLES
      3. Table 1 Global Controlled Released Fertilizers Market, by Region, 2024-2032 (USD Million)
      4. Table 2 Global Controlled Released Fertilizers Market, by Technology, 2024-2032 (USD Million)
      5. Table 3 Global Controlled Released Fertilizers Market, by Form, 2024-2032 (USD Million)
      6. Table 4 Global Controlled Released Fertilizers Market, by Mode of Application, 2024-2032 (USD Million)
      7. Table 5 Global Controlled Released Fertilizers Market, by Application, 2024-2032 (USD Million)
      8. Table 6 North America: Controlled Released Fertilizers Market, by Country, 2024-2032 (USD Million)
      9. Table 7 North America: Controlled Released Fertilizers Market, by Technology, 2024-2032 (USD Million)
      10. Table 8 North America: Controlled Released Fertilizers Market, by Form, 2024-2032 (USD Million)
      11. Table 9 North America: Controlled Released Fertilizers Market, by Mode of Application, 2024-2032 (USD Million)
      12. Table 10 North America: Controlled Released Fertilizers Market, by Application, 2024-2032 (USD Million)
      13. Table 11 US: Controlled Released Fertilizers Market, by Technology, 2024-2032 (USD Million)
      14. Table 12 US: Controlled Released Fertilizers Market, by Form, 2024-2032 (USD Million)
      15. Table 13 US: Controlled Released Fertilizers Market, by Mode of Application, 2024-2032 (USD Million)
      16. Table 14 US: Controlled Released Fertilizers Market, by Application, 2024-2032 (USD Million)
      17. Table 15 Canada: Controlled Released Fertilizers Market, by Technology, 2024-2032 (USD Million)
      18. Table 16 Canada: Controlled Released Fertilizers Market, by Form, 2024-2032 (USD Million)
      19. Table 17 Canada: Controlled Released Fertilizers Market, by Mode of Application, 2024-2032 (USD Million)
      20. Table 18 Canada: Controlled Released Fertilizers Market, by Application, 2024-2032 (USD Million)
      21. Table 19 Mexico: Controlled Released Fertilizers Market, by Technology, 2024-2032 (USD Million)
      22. Table 20 Mexico: Controlled Released Fertilizers Market, by Form, 2024-2032 (USD Million)
      23. Table 21 Mexico: Controlled Released Fertilizers Market, by Mode of Application, 2024-2032 (USD Million)
      24. Table 22 Mexico: Controlled Released Fertilizers Market, by Application, 2024-2032 (USD Million)
      25. Table 23 Europe: Controlled Released Fertilizers Market, by Country, 2024-2032 (USD Million)
      26. Table 24 Europe: Controlled Released Fertilizers Market, by Technology, 2024-2032 (USD Million)
      27. Table 25 Europe: Controlled Released Fertilizers Market, by Form, 2024-2032 (USD Million)
      28. Table 26 Europe: Controlled Released Fertilizers Market, by Mode of Application, 2024-2032 (USD Million)
      29. Table 27 Europe: Controlled Released Fertilizers Market, by Application, 2024-2032 (USD Million)
      30. Table 28 Germany: Controlled Released Fertilizers Market, by Technology, 2024-2032 (USD Million)
      31. Table 29 Germany: Controlled Released Fertilizers Market, by Form, 2024-2032 (USD Million)
      32. Table 30 Germany: Controlled Released Fertilizers Market, by Mode of Application, 2024-2032 (USD Million)
      33. Table 31 Germany: Controlled Released Fertilizers Market, by Application, 2024-2032 (USD Million)
      34. Table 32 France: Controlled Released Fertilizers Market, by Technology, 2024-2032 (USD Million)
      35. Table 33 France: Controlled Released Fertilizers Market, by Form, 2024-2032 (USD Million)
      36. Table 34 France: Controlled Released Fertilizers Market, by Mode of Application, 2024-2032 (USD Million)
      37. Table 35 France: Controlled Released Fertilizers Market, by Application, 2024-2032 (USD Million)
      38. Table 36 Italy: Controlled Released Fertilizers Market, by Technology, 2024-2032 (USD Million)
      39. Table 37 Italy: Controlled Released Fertilizers Market, by Form, 2024-2032 (USD Million)
      40. Table 38 Italy: Controlled Released Fertilizers Market, by Mode of Application, 2024-2032 (USD Million)
      41. Table 39 Italy: Controlled Released Fertilizers Market, by Application, 2024-2032 (USD Million)
      42. Table 40 Spain: Controlled Released Fertilizers Market, by Technology, 2024-2032 (USD Million)
      43. Table 41 Spain: Controlled Released Fertilizers Market, by Form, 2024-2032 (USD Million)
      44. Table 42 Spain: Controlled Released Fertilizers Market, by Mode of Application, 2024-2032 (USD Million)
      45. Table 43 Spain: Controlled Released Fertilizers Market, by Application, 2024-2032 (USD Million)
      46. Table 44 UK: Controlled Released Fertilizers Market, by Technology, 2024-2032 (USD Million)
      47. Table 45 UK: Controlled Released Fertilizers Market, by Form, 2024-2032 (USD Million)
      48. Table 46 UK: Controlled Released Fertilizers Market, by Mode of Application, 2024-2032 (USD Million)
      49. Table 47 UK: Controlled Released Fertilizers Market, by Application, 2024-2032 (USD Million)
      50. Table 48 Rest of Europe: Controlled Released Fertilizers Market, by Technology, 2024-2032 (USD Million)
      51. Table 49 Rest of Europe: Controlled Released Fertilizers Market, by Form, 2024-2032 (USD Million)
      52. Table 50 Rest of Europe: Controlled Released Fertilizers Market, by Mode of Application, 2024-2032 (USD Million)
      53. Table 51 Rest of Europe: Controlled Released Fertilizers Market, by Application, 2024-2032 (USD Million)
      54. Table 52 Asia-Pacific: Controlled Released Fertilizers Market, by Country, 2024-2032 (USD Million)
      55. Table 53 Asia-Pacific: Controlled Released Fertilizers Market, by Technology, 2024-2032 (USD Million)
      56. Table 54 Asia-Pacific: Controlled Released Fertilizers Market, by Form, 2024-2032 (USD Million)
      57. Table 55 Asia-Pacific: Controlled Released Fertilizers Market, by Mode of Application, 2024-2032 (USD Million)
      58. Table 56 Asia-Pacific: Controlled Released Fertilizers Market, by Application, 2024-2032 (USD Million)
      59. Table 57 China: Controlled Released Fertilizers Market, by Technology, 2024-2032 (USD Million)
      60. Table 58 China: Controlled Released Fertilizers Market, by Form, 2024-2032 (USD Million)
      61. Table 59 China: Controlled Released Fertilizers Market, by Mode of Application, 2024-2032 (USD Million)
      62. Table 60 China: Controlled Released Fertilizers Market, by Application, 2024-2032 (USD Million)
      63. Table 61 India: Controlled Released Fertilizers Market, by Technology, 2024-2032 (USD Million)
      64. Table 62 India: Controlled Released Fertilizers Market, by Form, 2024-2032 (USD Million)
      65. Table 63 India: Controlled Released Fertilizers Market, by Mode of Application, 2024-2032 (USD Million)
      66. Table 64 India: Controlled Released Fertilizers Market, by Application, 2024-2032 (USD Million)
      67. Table 65 Japan: Controlled Released Fertilizers Market, by Technology, 2024-2032 (USD Million)
      68. Table 66 Japan: Controlled Released Fertilizers Market, by Form, 2024-2032 (USD Million)
      69. Table 67 Japan: Controlled Released Fertilizers Market, by Mode of Application, 2024-2032 (USD Million)
      70. Table 68 Japan: Controlled Released Fertilizers Market, by Application, 2024-2032 (USD Million)
      71. Table 69 Australia & New Zealand: Controlled Released Fertilizers Market, by Technology, 2024-2032 (USD Million)
      72. Table 70 Australia & New Zealand: Controlled Released Fertilizers Market, by Form, 2024-2032 (USD Million)
      73. Table 71 Australia & New Zealand: Controlled Released Fertilizers Market, by Mode of Application, 2024-2032 (USD Million)
      74. Table 72 Australia & New Zealand: Controlled Released Fertilizers Market, by Application, 2024-2032 (USD Million)
      75. Table 73 Rest of Asia-Pacific: Controlled Released Fertilizers Market, by Technology, 2024-2032 (USD Million)
      76. Table 74 Rest of Asia-Pacific: Controlled Released Fertilizers Market, by Form, 2024-2032 (USD Million)
      77. Table 75 Rest of Asia-Pacific: Controlled Released Fertilizers Market, by Mode of Application, 2024-2032 (USD Million)
      78. Table 76 Rest of Asia-Pacific: Controlled Released Fertilizers Market, by Application, 2024-2032 (USD Million)
      79. Table 77 Rest of the World (RoW): Controlled Released Fertilizers Market, by Country, 2024-2032 (USD Million)
      80. Table 78 Rest of the World (RoW): Controlled Released Fertilizers Market, by Technology, 2024-2032 (USD Million)
      81. Table 79 Rest of the World (RoW): Controlled Released Fertilizers Market, by Form, 2024-2032 (USD Million)
      82. Table 80 Rest of the World (RoW): Controlled Released Fertilizers Market, by Mode of Application, 2024-2032 (USD Million)
      83. Table 81 Rest of the World (RoW): Controlled Released Fertilizers Market, by Application, 2024-2032 (USD Million)
      84. Table 82 South America: Controlled Released Fertilizers Market, by Technology, 2024-2032 (USD Million)
      85. Table 83 South America: Controlled Released Fertilizers Market, by Form, 2024-2032 (USD Million)
      86. Table 84 South America: Controlled Released Fertilizers Market, by Mode of Application, 2024-2032 (USD Million)
      87. Table 85 South America: Controlled Released Fertilizers Market, by Application, 2024-2032 (USD Million)
      88. Table 86 Middle East: Controlled Released Fertilizers Market, by Technology, 2024-2032 (USD Million)
      89. Table 87 Middle East: Controlled Released Fertilizers Market, by Form, 2024-2032 (USD Million)
      90. Table 88 Middle East: Controlled Released Fertilizers Market, by Mode of Application, 2024-2032 (USD Million)
      91. Table 89 Middle East: Controlled Released Fertilizers Market, by Application, 2024-2032 (USD Million)
      92. Table 90 Africa: Controlled Released Fertilizers Market, by Technology, 2024-2032 (USD Million)
      93. Table 91 Africa: Controlled Released Fertilizers Market, by Form, 2024-2032 (USD Million)
      94. Table 92 Africa: Controlled Released Fertilizers Market, by Mode of Application, 2024-2032 (USD Million)
      95. Table 93 Africa: Controlled Released Fertilizers Market, by Application, 2024-2032 (USD Million) LIST OF FIGURES
      96. FIGURE 1 Global Controlled-Release Fertilizers Market Segmentation
      97. FIGURE 2 Forecast Research Methodology
      98. FIGURE 3 Five Forces Analysis of the Global Controlled-Release Fertilizers Market
      99. FIGURE 4 Value Chain of the Global Controlled-Release Fertilizers Market
      100. FIGURE 5 Share of the Global Controlled-Release Fertilizers Market in 2024, by Country (%)
      101. FIGURE 6 Global Controlled-Release Fertilizers Market, by Region, 2024-2032,
      102. FIGURE 7 Global Controlled-Release Fertilizers Market Size, by Technology, 2024
      103. FIGURE 8 Share of the Global Controlled-Release Fertilizers Market, by Technology, 2024-2032 (%)
      104. FIGURE 9 Global Controlled-Release Fertilizers Market Size, by Form 2024
      105. FIGURE 10 Share of the Global Controlled-Release Fertilizers Market, by Form, 2024-2032 (%)
      106. FIGURE 11 Global Controlled-Release Fertilizers Market Size, by Mode of Application, 2024
      107. FIGURE 12 Share of the Global Controlled-Release Fertilizers Market, by Mode of Application, 2024-2032 (%)
      108. FIGURE 13 Global Controlled-Release Fertilizers Market Size, by Application, 2024
      109. FIGURE 14 Share of the Global Controlled-Release Fertilizers Market, by Application, 2024-2032 (%)

    Controlled-release Fertilizers Market Segment Overview

    Crop Type

    • Cereals & grains
    • Oilseeds & pulses
    • Fruits & vegetables
    • Plantation crops
    Application Type
    • Foliar application
    • Fustigation
    • Other

    Product Type

    • Coated & encapsulated
    • Nitrogen stabilizers (N-Stabilizers)

    By Region

    • North America
    •  Europe
    • Asia-Pacific
    Infographic

    Free Sample Request

    Kindly complete the form below to receive a free sample of this Report

    Get Free Sample

    Customer Strories

    “I am very pleased with how market segments have been defined in a relevant way for my purposes (such as "Portable Freezers & refrigerators" and "last-mile"). In general the report is well structured. Thanks very much for your efforts.”

    Victoria Milne

    Founder
    Case Study
    Chemicals and Materials