Copper Alloy Foils Market (2026 - 2035)

Copper Alloy Foils Market Research Report Information By Product Type (Copper Foil, Brass Foil, Bronze Foil, Copper Nickel Foil, and Others), By Application (Construction, Electrical & Electronics, Industrial Machinery, Consumer Goods, and Others) And By Region (North America, Europe, Asia-Pacific, And Rest Of The World) โ€“Market Forecast Till 2035
ID: MRFR/CnM/2544-HCR
111 Pages
Chitranshi Jaiswal
Last Updated: July 02, 2026
Copper Alloy Foils Market
Market Size
Forecast Period2026-2035
CAGR (2026-2035)4.3%
2025 Market SizeUSD 58,750 Million
2035 Market SizeUSD 89,480 Million
Key Players
Wieland Group
Aurubis AG
KME Group
Mitsubishi Materials Corporation
Materion Corporation
Mueller Industries
Opportunities
  • Recycled-Copper Circular Economy
  • High-Performance Alloys for Semiconductor Fabrication
  • Offshore Wind and Subsea Cabling

Copper Alloy Foils Market Summary

The Copper Alloy Foils Market reached an estimated USD 58,750 Million in 2025 and is projected to grow from USD 61,275 Million in 2026 to USD 89,480 Million by 2035, registering a CAGR of 4.3% across the forecast window. This trajectory reflects sustained global investment in electrification infrastructure โ€” the International Energy Agency's World Energy Outlook 2024 flagged copper-intensive grid upgrades worth over USD 680 billion through 2030, a catalyst that directly feeds demand for high-conductivity alloy grades [1]. Government mandates tied to the energy transition, including the U.S. Inflation Reduction Act and the EU Green Deal Industrial Plan, have locked in multi-decade procurement pipelines for copper-based components used in EV charging stations, renewable energy systems, and smart-grid interconnects .

The Copper Alloy Foils Market is undergoing a quiet but meaningful transformation in processing technology. Traditional batch-melt casting lines are steadily giving way to continuous-strip casting and precision powder-metallurgy routes that deliver tighter tolerances and reduce scrap rates by 12โ€“18% . This shift matters because downstream OEMs in electronics and automotive are specifying thinner, lighter alloy profiles that older equipment simply cannot produce at scale. Investments in digital twin-enabled smelters โ€” Aurubis committed EUR 530 million to its Hamburg site modernization program through 2026 โ€” signal where the industry is heading [4].

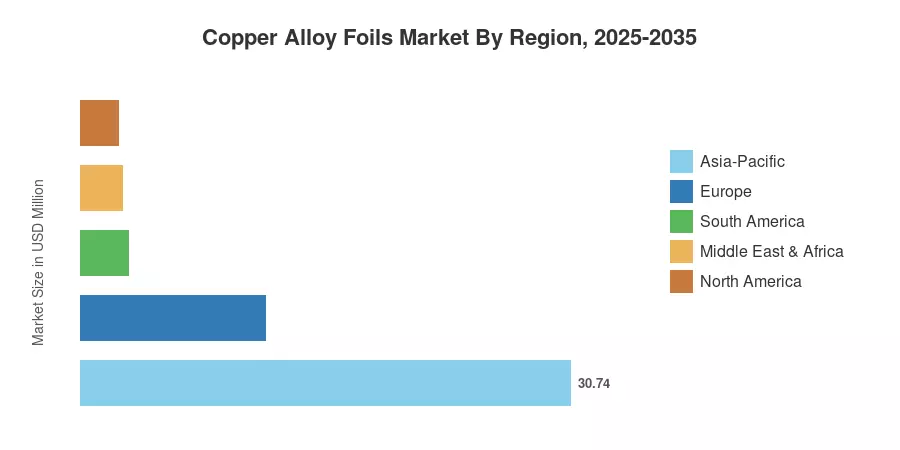
Asia-Pacific commands roughly 53% of the Copper Alloy Foils Market and also represents the fastest-growing region, propelled by China's infrastructure stimulus packages and India's push to expand domestic copper smelting capacity under its Production-Linked Incentive schemeย [5]. Europe holds the second-largest share at approximately 20%, anchored by Germany's automotive and industrial-machinery sectors. North America, accounting for around 17%, is gaining momentum as onshoring policies redirect supply chains back to domestic alloy producers. The decade ahead will reward market participants who can scale sustainable production while meeting increasingly stringent alloy-purity specifications.

ย 

Key Report Takeaways

โ€ข By Type

  • Brass accounts for the largest share of the Copper Alloy Foils Market at roughly 41% of global revenue, driven by plumbing, architectural hardware, and ammunition casing demand.
  • Bronze is expanding at a CAGR of 4.6% through 2035, fueled by marine propulsion and heavy-bearing applications that prize corrosion resistance.
  • Copper-Nickel alloys represent approximately USD 10,800 Million in 2025, reflecting strong pull from desalination plants and offshore energy infrastructure.

โ€ข By End-Use Industry

  • Construction is the top end-use vertical for the Copper Alloy Foils Market, contributing around 30% of demand through plumbing tube, roofing sheet, and HVAC componentry.
  • Electrical and Electronics holds a CAGR of 4.7%, the fastest among end-use segments, underpinned by 5G rollout and data-center expansion.
  • Automotive demand is valued at approximately USD 11,750 million in 2025, with EV-related content per vehicle climbing steadily.

โ€ข By Region

  • Asia-Pacific dominates the Copper Alloy Foils Market, contributing over 53% of global revenue in 2025.
  • North America is growing at a CAGR of 4.1%, supported by re-shoring incentives and grid-modernization spending.
  • Europe maintains a share of roughly 20%, with Germany alone accounting for nearly a third of regional consumption.

ย 

Market Size and Forecast (2021โ€“2035)

Market Research Future's estimates draw on a triangulated methodology combining top-down trade-flow analysis (ICSG, World Bureau of Metal Statistics), bottom-up production audits from the 25 largest smelters and rolling mills, and proprietary demand modeling calibrated against GDP, construction-output, and vehicle-production indices across 42 countries.
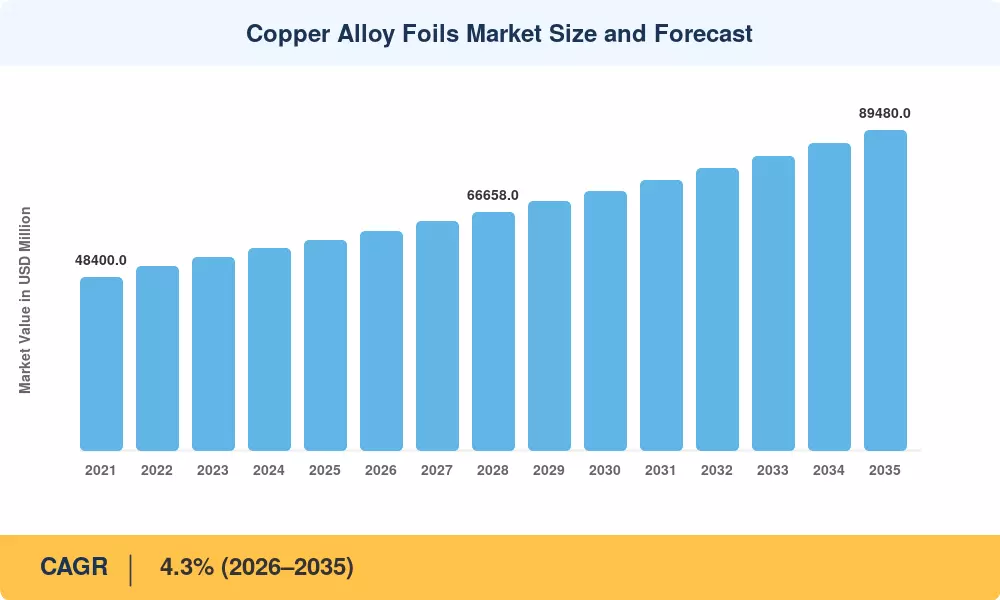
Copper Alloy Foils Market Size and Forecast
Our Impact
Enabled $4.3B Revenue Impact for Fortune 500 and Leading Multinationals
Partnering with 2000+ Global Organizations Each Year
30K+ Citations by Top-Tier Firms in the Industry

Driver Impact Analysis

Driver ~% Impact on CAGR Geographic Relevance Impact Timeline
Global electrification & grid upgrades +0.9% Global Long-term (โ‰ฅ4 yr)
EV production ramp-up +0.7% Asia-Pacific, Europe, N. America Medium-term (2โ€“4 yr)
Construction & urbanization +0.6% Asia-Pacific, MEA Long-term (โ‰ฅ4 yr)
5G and data-center expansion +0.4% North America, Asia-Pacific Short-term (โ‰ค2 yr)
Renewable energy infrastructure +0.5% Europe, North America Medium-term (2โ€“4 yr)
Desalination & water infrastructure +0.3% MEA, Asia-Pacific Medium-term (2โ€“4 yr)
Defense modernization programs +0.2% North America, Europe Long-term (โ‰ฅ4 yr)

ย 

Global Electrification and Grid Upgrades

Power-grid modernization is the single largest structural tailwind for the Copper Alloy Foils Market. The IEA estimates that global electricity grids require USD 570-574 billion in investment by 2030 just to keep pace with renewable-energy additions, with copper-intensive transformer windings, busbar systems, and underground cabling consuming an incremental 2.1 million tonnes of refined copper annually by the early 2030s [1]. China's State Grid Corporation alone budgeted CNY 560 billion for ultra-high-voltage transmission corridors in its 2024โ€“2026 capital plan, each corridor requiring thousands of tonnes of copper-alloy conductor rods and connectors [11].

Electric Vehicle Production Ramp-Up

The quantity of copper-alloy content in a battery-electric vehicle is 53โ€“83 kg, which is about 3.5 times the amount in a typical internal-combustion automobile, and is found in motor windings, power electronics, charging inlets, and wiring harnesses [6]. Global EV sales are expected to hit 30 million units per annum by 2030 according to BloombergNEF, meaning the Copper Alloy Foils Market is set to absorb an additional 1.5 - 2.5 million tonnes of alloy demand in the projected period. European OEMs such as Volkswagen and Stellantis have already officially committed to full-BEV line-ups by 2035 and locked in long-term procurement contracts for high-purity copper nickel and phosphor-bronze stripย [12].

ย 

Construction and Urbanization

The United Nations forecasts that 68% of the world population will live in cities by 2050, translating into significant demand for plumbing tube, architectural cladding, roofing sheet, and HVAC componentry that is reliant on copper and its alloys for durability and antimicrobial efficacy [7]. Indiaโ€™s Pradhan Mantri Awas Yojana housing program targets the construction of 20 million urban dwelling units by 2026, with an estimated requirement of 15-22 kg of copper-alloy products per dwelling unit. Simultaneously, Chinaโ€™s ongoing urban-renewal campaigns are creating a replacement demand for aging piping and electrical infrastructure in Tier-2 and Tier-3 cities [13].

ย 

Renewable Energy Infrastructure

Copper-heavy assets include wind turbines and solar power plants: a 3 MW onshore wind turbine requires around 4.7 tonnes of copper, and utility-scale solar farms utilize roughly 5.5 tonnes per MW of installed capacity . The Copper Alloy Foils Market immediately benefits from this, with IRENAโ€™s prediction that global renewable capacity must triple by 2030 to remain on the 1.5 ยฐC pathway creating persistent pull for bus-bar alloys, grounding conductors and transformer-grade copper strip [14].

ย 

ย 

Restraints Impact Analysis

Restraint ~% Impact on CAGR Geographic Relevance Impact Timeline
Fluctuating raw-material prices โˆ’0.5% Global Short-term (โ‰ค2 yr)
Substitution by aluminum and plastics โˆ’0.4% North America, Europe Medium-term (2โ€“4 yr)
Environmental & emissions compliance costs โˆ’0.3% Europe, North America Medium-term (2โ€“4 yr)
Energy-intensive smelting cost pressures โˆ’0.2% Global Long-term (โ‰ฅ4 yr)
Geopolitical supply-chain disruptions โˆ’0.3% Global Short-term (โ‰ค2 yr)

ย 

Fluctuating Raw-Material Prices

LME copper prices swung between USD 7,800 and USD 10,700 per tonne across 2023โ€“2024, a range wide enough to compress margins for mid-stream alloy fabricators who typically operate on 4โ€“7% EBITDA margins [15]. When cathode costs spike, downstream buyers in cost-sensitive verticals like residential construction often defer purchases or downgrade to thinner-gauge alternatives, creating demand volatility that dampens the steady growth trajectory of the Copper Alloy Foils Market. Hedging programs mitigate but do not eliminate this risk, particularly for smaller producers without access to sophisticated commodity-desk infrastructure.

Substitution Pressure from Aluminum and Polymers

Aluminum's weight advantage and lower per-kilogram cost make it a credible substitute in automotive heat-exchanger tubing, power-cable jacketing, and certain plumbing applications where corrosion resistance standards permit [16]. The high-performance polymer piping (PEX and CPVC) continues to erode copper's share in potable-water distribution โ€” a dynamic that constrains volume growth for the Copper Alloy Foils Market in mature economies [20].

ย 

Copper Alloy Foils Market Opportunities

Recycled-Copper Circular Economy

Secondary (recycled) copper currently satisfies roughly 35% of global copper demand, yet collection and processing rates in developing economies remain below 20% [17]. The EU Critical Raw Materials Act (CRMA), which entered into force in May 2024, explicitly focuses on building internal European capacityโ€”aiming to recycle at least 25% of the EU's annual consumption of strategic materials by 2030. Producers that invest in automated scrap-sorting and direct-melt recycling lines can capture both cost advantages and regulatory compliance premiums.

High-Performance Alloys for Semiconductor Fabrication

The advanced fabrication nodes at 3 nm and below require ultra-high-purity copper alloy lead frames and bonding wire with impurity levels less than 5 parts per million. The worldwide semiconductor capital-expenditure cycle (projected by SEMI to exceed USD 200 billion per year through 2027) offers a premium niche in the Copper Alloy Foils Market for companies that can achieve these stringent metallurgical requirements [8]. Japan and South Korea have the best alloy specialists, but there are still capacity deficits in North America and Europe.

ย 

Offshore Wind and Subsea Cabling

The Global Wind Energy Council expects the total offshore-wind capacity to surpass 380 GW by 2032, with each GW needing roughly 5,500 tons of copper-nickel alloy for inter-array and export cables capable of resisting corrosion from saltwater [14]. The Copper Alloy Foils Market has a multi-billion-dollar incremental opportunity, especially in Northern Europe and the Asia-Pacific offshore-wind corridors being created off Taiwan, Japan, and South Korea.

ย 

Emerging-Market Smelting Capacity Expansion

Indonesia, the Democratic Republic of Congo, and Zambia are actively courting foreign direct investment to build domestic smelting and alloy-fabrication capacity, offering tax holidays, subsidized power, and streamlined permitting [5]. For global alloy producers seeking lower-cost production bases closer to mine supply, these emerging-market greenfield projects represent a structural opportunity to serve local and regional demand while diversifying geopolitical risk.

Digital Alloy Specification Platforms

A growing number of procurement teams are shifting alloy sourcing onto digital platforms that allow buyers to specify exact compositions, delivery schedules, and certification requirements online. The Copper Alloy Foils Market stands to benefit from improved price transparency and reduced transaction costs โ€” early movers like Metalshub and Shanghai Metals Market already handle over USD 4 billion in annual non-ferrous transaction volume, compressing traditional distributor margins and broadening market access for smaller fabricators [21].

ย 

Copper Alloy Foils Market Future Outlook

Electrification Supercycle

The convergence of EV adoption, renewable-energy buildout, and grid modernization amounts to a multi-decade electrification supercycle that underpins the Copper Alloy Foils Market's long-range outlook. The IEA's Net Zero Emissions scenario estimates that copper demand from clean-energy technologies alone will more than double by 2040, reaching 12.5 million tonnes annually โ€” a volume that current mine and smelter capacity cannot satisfy without significant greenfield investment [1]. Alloy producers positioned to offer higher-conductivity, lower-loss formulations will capture disproportionate value as grid operators and automakers prioritize energy efficiency.

Sustainability and ESG-Driven Procurement

ESG considerations are moving from voluntary reporting to binding procurement criteria across the Copper Alloy Foils Market. The EU's Corporate Sustainability Reporting Directive and the SEC's proposed climate-disclosure rules compel major copper-alloy buyers to audit Scope 3 emissions embedded in their purchased materials [17]. Producers who achieve third-party verified carbon-footprint certifications are already commanding 2โ€“4% price premiums on spot markets, and this differential is expected to widen as procurement ESG scoring becomes standard practice.

AI-Enabled Smart Manufacturing

AI and machine-learning algorithms are beginning to reshape alloy production by optimizing melt chemistry in real time, predicting strip-surface defects before they reach downstream customers, and automating order-routing across multi-site production networks. The Copper Alloy Foils Market stands to gain through reduced scrap rates (early adopters report 8โ€“12% reductions), shorter lead times, and the ability to offer custom alloy compositions economically at smaller batch sizes . Digital twins of continuous-casting lines โ€” piloted by Wieland and Mitsubishi Materials โ€” allow process engineers to simulate the effects of composition changes before committing to production runs.

Supply-Chain Regionalization

Geopolitical friction between major trading blocs is accelerating supply-chain regionalization in the Copper Alloy Foils Market. The U.S. CHIPS Act and IRA domestic-content provisions, Europe's Carbon Border Adjustment Mechanism, and India's PLI scheme all incentivize localized alloy fabrication [19]. Over the next decade, this trend will likely fragment global supply chains into three loosely coupled trade zones โ€” Americas, Europe-MEA, and Asia-Pacific โ€” each developing semi-independent alloy-fabrication capacity and certification regimes.

ย 

Copper Alloy Foils Market Segmentation

By Type

Segment Key Metric Primary Demand Driver
Brass ~41% share Plumbing fittings, architectural hardware, ammunition
Bronze CAGR 4.6% Marine, heavy bearings, artistic castings
Copper-Nickel Alloy ~USD 10,800 Million (2025) Desalination, offshore energy, coinage
Others ~12% share Beryllium copper, copper-chromium, specialty grades

ย 

Brass remains the volume leader across the Copper Alloy Foils Market, driven by its combination of machinability, corrosion resistance, and aesthetic appeal that makes it indispensable in plumbing, hardware, and decorative applications. Lead-free brass formulations (compliant with NSF/ANSI 372 and EU Drinking Water Directive revisions) are growing faster than traditional leaded grades as regulatory mandates tighten globally [20].

Bronze alloys โ€” particularly phosphor bronze and aluminum bronze โ€” are gaining share in demanding environments such as marine propulsion, mining-equipment bushings, and aerospace bearings where resistance to fatigue and saltwater corrosion is paramount. The segment's above-average CAGR of 4.6% through 2035 reflects expanding offshore-wind and subsea-energy infrastructure.

By End-Use Industry

Segment Key Metric Primary Demand Driver
Construction ~30% share Plumbing tube, roofing, HVAC, architectural cladding
Electrical and Electronics CAGR 4.7% Connectors, PCBs, 5G antenna components
Automotive ~USD 11,750 Million (2025) EV wiring, motor windings, power electronics
Industrial Machinery ~15% share Bearings, gears, valve seats, hydraulic fittings
Others CAGR 3.8% Defense, marine, coinage, healthcare

ย 

Construction has historically been the dominant end-use vertical for the Copper Alloy Foils Market, and this pattern holds through the forecast period as urbanization trends in Asia-Pacific and the Middle East sustain demand for plumbing systems, roofing products, and antimicrobial copper-alloy touch surfaces in healthcare facilities [7].

Electrical and Electronics is the fastest-growing end-use segment, expanding at a 4.7% CAGR as 5G base-station rollouts, hyperscale data-center construction, and miniaturized consumer electronics push demand for precision copper-alloy strip, foil, and wire in ever-tighter specifications [8].

ย 

Regional Market Share Analysis

Region Key Metric Primary Investment Themes
Asia-Pacific ~53% share Grid expansion, EV manufacturing, urbanization
Europe ~20% share Automotive electrification, circular economy
North America CAGR 4.1% Onshoring, grid modernization, defense
South America ~USD 3,525 Million (2025) Mining-linked downstream integration
Middle East & Africa CAGR 4.5% Desalination, construction mega-projects
Total USD 58,750 Million (2025) โ€”

The Copper Alloy Foils Market exhibits a pronounced concentration in Asia-Pacific, with the remaining share distributed across Europe, North America, South America, and the Middle East & Africa. Regional demand patterns reflect underlying differences in industrialization stage, infrastructure investment priorities, and regulatory environments.

ย 

North America

Country Key Metric Key Driver
US ~72% of regional share Grid modernization; IRA incentives
Canada CAGR 3.9% Mining-sector integration, renewable builds
Mexico ~USD 1,190 Million (2025) Nearshoring automotive manufacturing

ย 

The United States drives the bulk of North American demand for the Copper Alloy Foils Market, with the Bipartisan Infrastructure Law directing over USD 65 billion toward power-grid upgrades that require copper-alloy transformer components, bus bars, and cable accessories . Canada's mining-linked fabrication ecosystem and Mexico's rapidly expanding automotive-assembly corridor add complementary demand vectors that keep the region on a steady upward path.

Europe

Country Key Metric Key Driver
Germany ~31% of regional share Automotive OEMs, industrial machinery
UK CAGR 3.8% Offshore wind cabling, construction
France ~USD 1,640 Million (2025) Nuclear refurbishment, rail electrification
Italy ~12% of regional share Plumbing and architectural alloys
Spain CAGR 4.0% Renewable energy, construction rebound
Nordic Countries ~USD 980 Million (2025) Offshore wind, green-hydrogen projects
Russia ~8% of regional share Domestic smelting, heavy industry
Rest of Europe CAGR 3.7% Varied industrial applications

ย 

Europe's position in the Copper Alloy Foils Market is anchored by Germany's automotive and precision-engineering sectors, which consume high-specification brass and bronze strip for connectors, bushings, and valve components. The EU Critical Raw Materials Act, adopted in 2024, strengthens the region's strategic focus on securing domestic alloy supply chains and boosting recycled-copper content to 45% of total input by 2030 [17].

Asia-Pacific

Country Key Metric Key Driver
China ~58% of regional share Infrastructure stimulus, EV production
India CAGR 5.2% PLI scheme, urban housing construction
Japan ~USD 3,280 Million (2025) Electronics, semiconductor alloys
South Korea ~8% of regional share Semiconductor lead frames, shipbuilding
ASEAN CAGR 4.8% Urbanization, FDI-driven manufacturing
Rest of Asia-Pacific ~USD 1,450 Million (2025) Mining downstream, infrastructure

ย 

Asia-Pacific is the center of gravity for the Copper Alloy Foils Market. China's position as both the world's largest copper smelter and its largest alloy consumer creates a self-reinforcing ecosystem; the country's 2024 fiscal stimulus directed CNY 1 trillion toward local-government infrastructure bonds, much of it flowing into copper-intensive water, power, and transit projects [11]. India's Production-Linked Incentive scheme for advanced chemistry cells and its ambitious National Infrastructure Pipeline are accelerating demand growth at roughly 5.2% annually [5].

South America

Country Key Metric Key Driver
Brazil ~54% of regional share Construction, automotive assembly
Argentina CAGR 3.6% Mining development, lithium-copper synergy
Rest of South America ~USD 930 Million (2025) Copper-mining downstream processing

ย 

South America's role in the Copper Alloy Foils Market is shaped by its dual identity as a major mine-supply region and an emerging downstream fabrication hub. Chile and Peru together account for over 37% of global mined copper output, and government policies increasingly incentivize domestic value-addition through alloy-fabrication zones adjacent to smelter complexes [22].

Middle East & Africa

Country Key Metric Key Driver
Saudi Arabia ~28% of regional share NEOM, Vision 2030 construction
UAE CAGR 4.6% Desalination, smart-city infrastructure
South Africa ~USD 520 Million (2025) Mining sector, local manufacturing
Egypt CAGR 4.3% New Administrative Capital, power grids
Rest of MEA ~22% of regional share Varied infrastructure buildout

ย 

The Middle East & Africa region is the smallest but one of the fastest-growing segments of the Copper Alloy Foils Market. Saudi Arabia's Vision 2030 program and the NEOM mega-city project alone are expected to consume hundreds of thousands of tonnes of copper-alloy plumbing, cabling, and architectural products through the early 2030s, while sub-Saharan Africa's electrification push is pulling in transformer-grade copper strip and distribution-cable alloys at accelerating rates [9].

ย 

Copper Alloy Foils Market By Region, 2025-2035

Competitive Benchmarking

The Copper Alloy Foils Market exhibits medium concentration, with the top five players collectively holding an estimated 28โ€“34% revenue share. The competitive field blends vertically integrated smelter-fabricators (Aurubis, Wieland) with diversified mining-and-materials conglomerates (Mitsubishi Materials, Hindalco) and specialized alloy producers (Materion, Poongsan). An estimated HHI of approximately 450โ€“600 confirms a moderately fragmented structure where regional champions compete alongside global incumbents.

Company Est. Revenue Share Range Key Offerings Strategic Positioning
Wieland Group ~7โ€“9% Rolled strip, tubes, profiles (brass, bronze, copper-nickel) Vertically integrated European leader; digital-foundry pioneer
Aurubis AG ~6โ€“8% Cathodes, flat-rolled products, recycling services Largest European copper recycler; carbon-neutral copper brand
KME Group ~4โ€“6% Tubes, sheets, bars for construction and industrial use Strong Southern European footprint; plumbing specialist
Mitsubishi Materials Corporation ~4โ€“6% High-purity copper alloys, electronic materials Japanese precision-alloy leader; semiconductor-grade focus
Materion Corporation ~3โ€“5% Beryllium copper, high-performance alloys Niche specialist in aerospace and defense alloys
Mueller Industries ~3โ€“5% Plumbing and HVAC copper tube, fittings North American distribution network strength
Diehl Stiftung & Co. KG ~2โ€“4% Brass and copper strip, ammunition components Diversified German conglomerate with defense adjacency
Ningbo Boway Alloy Material ~3โ€“5% Copper-alloy strip for electronics, lead frames Chinese volume leader in precision electronic strip
Poongsan Corporation ~2โ€“4% Copper-alloy sheets, coinage blanks, ammunition South Korean integrated producer; government contracts
Hindalco Industries ~2โ€“3% Copper cathodes, rods, alloy flat products Indian mining-to-fabrication integration; cost advantage

ย 

ย 

Recent News & Developments

  • Aurubis AG (September 2024): Announced the commissioning of its new multi-metal recycling plant in Richmond, Georgia, representing a USD 740 million investment to expand North American secondary-copper processing capacity [4].
  • Wieland Group (October 2019): Completed the acquisition of Global Brass and Copper Holdings' remaining specialty strip assets, strengthening its position in high-precision electronic connector alloys for the Copper Alloy Foils Market [23].

ย 

  • Hindalco Industries (January 2026): Announced a major 210 billion rupee (USD 2.29 billion) capital investment initiative to aggressively expand its upstream non-ferrous manufacturing footprint in Odisha, focusing heavily on reducing import dependence by scaling domestic smelting capacities and constructing advanced battery-grade material lines to feed high-growth clean energy ecosystems.
  • European Commission (May 2024): Formally enacted the European Critical Raw Materials Act, officially identifying refined copper as a strategic material and establishing binding regional infrastructure goals to satisfy 10% of copper needs via domestic extraction, 40% via chemical processing, and at least 25% through circular recycling networks by 2030.

ย 

ย 

ย 

Copper Alloy Foils Market Report Scope

Parameter Details
Market Scope Global Copper Alloy Foils Market covering brass, bronze, copper-nickel, and other alloy types across five end-use industries and five geographic regions
Study Period 2021โ€“2035
CAGR 4.3% (2026โ€“2035)
Market Size (2025) USD 58,750 Million
Market Size (2035) USD 89,480 Million
Fastest Growing Segment Electrical and Electronics (by end-use); Bronze (by type)
Companies Profiled 10 (Wieland, Aurubis, KME, Mitsubishi Materials, Materion, Mueller Industries, Diehl, Ningbo Boway, Poongsan, Hindalco)
Valuation Currency USD Million

ย 

ย 

FAQs

How does copper-alloy content per electric vehicle compare across BEV, PHEV, and HEV architectures?
A full battery-electric vehicle uses 53โ€“83 kg of copper alloy, roughly 3.5 times that of a conventional car. Plug-in hybrids average 40โ€“55 kg, while mild hybrids sit near 30 kg [6].
What quality certifications should procurement teams require when sourcing copper-alloy strip for electronics?
Buyers should verify ASTM B36/B103 compliance, RoHS/REACH declarations, and mill-test certificates showing impurity levels below 50 ppm. UL-recognized component marks add assurance for connector-grade strip [8].
How does the carbon footprint of primary versus recycled copper alloy affect purchasing decisions?
Recycled copper alloys generate roughly 80% fewer COโ‚‚ emissions per tonne than primary smelted material. Procurement teams with Scope 3 reporting obligations increasingly mandate minimum recycled-content thresholds [17].
Which alloy grades are best suited for high-salinity desalination environments?
Copper-nickel grades 90/10 (C70600) and 70/30 (C71500) dominate desalination due to superior seawater corrosion resistance. Grade 70/30 handles higher flow velocities and temperatures [9].
What lead times should buyers expect for custom copper-alloy compositions?
Standard commercial alloys ship in 4โ€“8 weeks from major mills. Custom compositions requiring dedicated melts typically need 12โ€“18 weeks, depending on order volume and certification requirements [21].
How are anti-dumping duties affecting cross-border copper-alloy trade flows?
Several jurisdictions maintain anti-dumping measures on Chinese copper-alloy products, with duties ranging from 8% to 26%. These tariffs redirect trade toward Southeast Asian and Indian suppliers [19].
What role does beryllium copper play in aerospace and defense applications?
Beryllium copper (C17200) offers a unique combination of high strength, non-sparking properties, and fatigue resistance. It is specified for landing-gear bushings, missile guidance connectors, and ordnance tooling [10]. ย  ย 
Author
Author
Author Profile
Chitranshi Jaiswal LinkedIn
Team Lead - Research
Chitranshi is a Team Leader in the Chemicals & Materials (CnM) and Energy & Power (EnP) domains, with 6+ years of experience in market research. She leads and mentors teams to deliver cross-domain projects that equip clients with actionable insights and growth strategies. She is skilled in market estimation, forecasting, competitive benchmarking, and both primary & secondary research, enabling her to turn complex data into decision-ready insights. An engineer and MBA professional, she combines technical expertise with strategic acumen to solve dynamic market challenges. Chitranshi has successfully managed projects that support market entry, investment planning, and competitive positioning, while building strong client relationships. Certified in Advanced Excel & Power BI she leverages data-driven approaches to ensure accuracy, clarity, and impactful outcomes.

Research Approach

ย 

Secondary Research

The secondary research process involved a comprehensive analysis of regulatory databases, peer-reviewed materials science journals, industry publications, and authoritative metal and mining organizations. Key sources included the US Geological Survey (USGS) Mineral Commodity Summaries, International Copper Study Group (ICSG), European Copper Institute (ECI), Copper Development Association (CDA), US Department of Commerce โ€“ Bureau of Industry and Security (BIS), International Wrought Copper Council (IWCC), World Bureau of Metal Statistics (WBMS), Organisation for Economic Co-operation and Development (OECD) Steel and Metals Committee, UN Comtrade Database, International Energy Agency (IEA) for energy transition materials demand, European Committee for Standardization (CEN) and ASTM International for material specifications, China Nonferrous Metals Industry Association (CNIA), Japan Copper & Brass Association (JCBA), and national geological surveys and trade ministries from key producing and consuming markets. These sources were used to collect production and consumption statistics, trade flow data, regulatory compliance frameworks (REACH, RoHS, conflict minerals), pricing benchmarks (LME, COMEX), patent filings for advanced alloy compositions, and market landscape analysis for copper foil, brass foil, bronze foil, copper-nickel foil, and other specialty alloy categories.

ย 

Primary Research

Qualitative and quantitative insights were obtained by interviewing supply-side and demand-side stakeholders during the primary research process. The supply-side sources consisted of CEOs, VPs of Manufacturing, leaders of R&D and metallurgy, plant directors, and commercial directors from copper alloy foil producers, rolling mills, and integrated mining-smelting-refining operations. Demand-side sources included procurement leaders from PCB and electronics manufacturers, automotive OEM purchasing managers, aerospace component engineers, renewable energy (solar/wind) system integrators, construction material specifiers, and medical device manufacturers. The market segmentation was validated by primary research with respect to product type (copper foil, brass foil, bronze foil, copper-nickel foil, and others), application (construction, electrical & electronics, industrial machinery, consumer goods, and others), thickness categories (thin, medium, thick, ultra-thin), and form factor (rolls, sheets, strips, and custom shapes). It also verified the timelines for capacity expansion, collected information on the adoption patterns of alloys, pricing strategies that are linked to LME copper premiums, and supply chain dynamics, including refuse recycling flows.

Primary Respondent Breakdown:

By Designation: C-level Primaries (30%), Director Level (32%), Others (38%)

By Region: North America (32%), Europe (30%), Asia-Pacific (30%), Rest of World (8%)

ย 

Market Size Estimation

Global market valuation was derived through production volume mapping and revenue analysis across the value chain. The methodology included:

Identification of 50+ key manufacturers and rolling mills across North America, Europe, Asia-Pacific, and Latin America

Product mapping across copper foil, brass foil, bronze foil, copper-nickel foil, and other specialty alloy foil categories

Analysis of reported and modeled annual revenues specific to copper alloy foil portfolios, incorporating LME copper price benchmarks and alloy-specific premiums

Coverage of manufacturers representing 70โ€“75% of global market share in 2024

Extrapolation using bottom-up (production volume ร— average selling price by country/region, adjusted for alloy composition and thickness premiums) and top-down (manufacturer revenue validation, trade data reconciliation) approaches to derive segment-specific valuations

Key Segments Covered: Product Type (Copper Foil, Brass Foil, Bronze Foil, Copper-Nickel Foil, Others), Application (Construction, Electrical & Electronics, Industrial Machinery, Consumer Goods, Others), Thickness (Thin, Medium, Thick, Ultra-Thin), Form Factor (Rolls, Sheets, Strips, Custom Shapes), and Region (North America, Europe, Asia-Pacific, Rest of the World).

Download Free Sample

Kindly complete the form below to receive a free sample of this Report

Download PDF ×

We do not share your information with anyone. However, we may send you emails based on your report interest from time to time. You may contact us at any time to opt-out.

















