Crop Protection Chemicals Market (2025 - 2035)

Crop Protection Chemicals Market Size, Share, Industry Trend & Analysis Research Report By Origin (Synthetic, Biological), By Product (Herbicides, Insecticides, Fungicides, Molluscicides, Nematicides, Bio-Pesticides), By Application Method (Foliar Spray, Seed Treatment, Soil Treatment, Others), By Crop (Grains & Cereals, Fruits & Vegetables, Commercial Crops, Others) -Forecast to 2035

Forecast Period
2025-2035
CAGR
4.5%
2025 Market Size
USD 413.00 Million
2035 Market Size
USD 639.00 Million
Agriculture ● Updated July 2026 Report ID: MRFR/Agri/3726-HCR | Pages: 200 | Author: Snehal Singh

Crop Protection Chemicals Market Summary

The Crop Protection Chemicals Market reached USD 413.00 Million in 2025 and is projected to grow from USD 430.00 Million in 2026 to USD 639.00 Million by 2035, registering a CAGR of 4.5% during the forecast period (2026–2035). Rising pest pressure driven by shifting climate patterns, alongside accelerating government precision-agriculture subsidies in key producing nations, continues to reshape input purchasing across the global farming sector. Regulatory bans on legacy active ingredients such as paraquat and chlorpyrifos have forced growers to adopt newer, lower-residue chemistries at premium price points, lifting overall market value even as volume growth moderates[2].

Within the Crop Protection Chemicals Market, a subtle but significant technological revolution is taking place. Data-driven variable-rate application systems combined with drone-assisted reconnaissance are replacing traditional broad-spectrum spraying programs, reducing chemical usage per hectare while increasing efficacy. By directing an estimated EUR 1.8 billion in public funding into integrated pest control and biological alternatives, the EU's Farm to Fork strategy alone aims to reduce the use of chemical pesticides by 50% by 2030 [3]. Access gaps for smallholders in Southeast Asia and Sub-Saharan Africa are being further reduced via digital farm-input marketplaces.

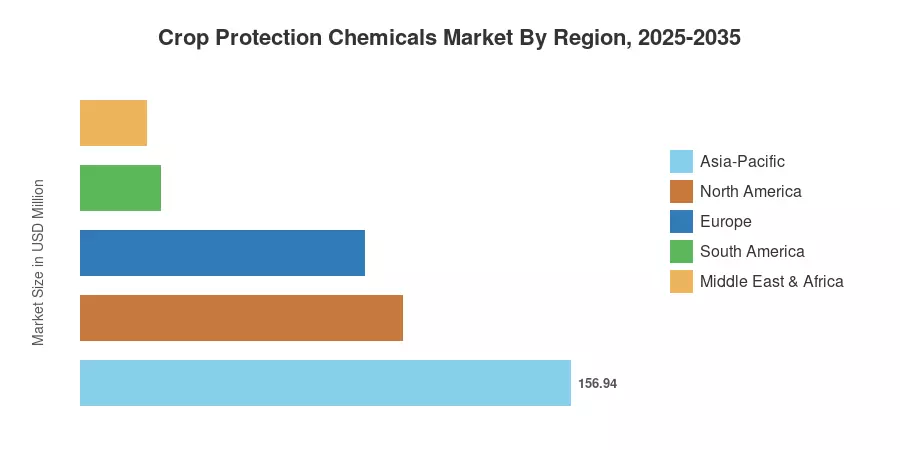
With intense rice and horticultural acreage in China, India, and ASEAN countries, the Asia-Pacific holds the highest share of the Crop Protection Chemicals Market, accounting for around 38% of 2025 revenue. With double-cropping expansion in Brazil's Cerrado belt driving growth at an anticipated 6.2% CAGR through 2035, South America is the fastest-growing continent. Herbicide-tolerant trait adoption and row-crop dominance maintain consistent demand in North America, which has the second-largest share at about 25%. Businesses that combine proven chemical efficacy with biological crop protection stacks and digital stewardship platforms will be rewarded more and more in the upcoming ten years.


Key Report Takeaways

• By Origin

  • Synthetic chemistries accounted for approximately 78% of the Crop Protection Chemicals Market share in 2025, reflecting continued reliance on proven active ingredients for broad-acre crops.
  • Biological formulations are advancing at a 10.2% CAGR through 2035, driven by residue-free export certification requirements and retailer sustainability mandates.

• By Product

  • Herbicides led the Crop Protection Chemicals Market with a 47% share in 2025, underpinned by the global expansion of herbicide-tolerant cropping systems.
  • Bio-pesticides represent the fastest-expanding product category at an 11.8% CAGR, as integrated pest management programs gain regulatory backing worldwide.

• By Application Method

  • Foliar spray captured roughly 58% of the Crop Protection Chemicals Market value in 2025, remaining the dominant delivery mechanism for field and orchard crops.
  • Seed treatment is growing at a 9.7% CAGR, offering growers a targeted, lower-dose approach that aligns with tightening maximum residue limits.

• By Region

  • Asia-Pacific dominates the Crop Protection Chemicals Market by revenue, driven by rice paddy acreage and intensive vegetable production across China and India.
  • South America is expanding at a 6.2% CAGR, fueled by soybean and sugarcane area expansion in Brazil and Argentina.


Crop Protection Chemicals Market Size and Forecast (2021–2035)

Market Research Future's estimates draw on a combination of proprietary demand models, trade-flow analysis, and company-reported revenue benchmarks calibrated against government agricultural statistics from FAO, USDA, and Eurostat[4]. Historical figures (2021–2024) reflect audited data; the base year (2025) blends preliminary actuals with survey-derived estimates; and the forecast period (2026–2035) applies a compound growth methodology anchored to crop-area projections, pest-pressure indices, and regulatory phase-out schedules.
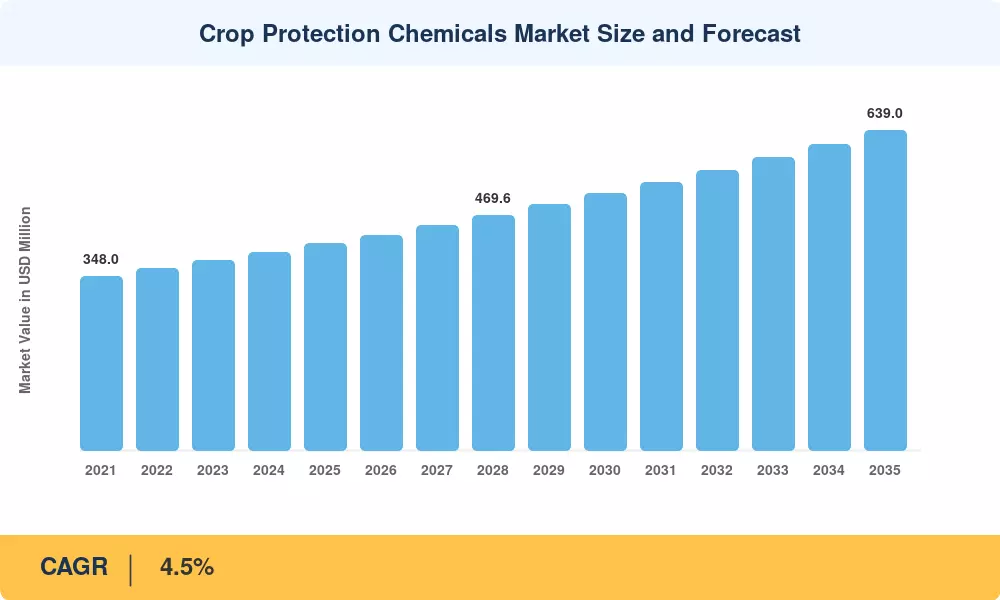
Crop Protection Chemicals Market Size and Forecast
Our Impact
Enabled $4.3B Revenue Impact for Fortune 500 and Leading Multinationals
Partnering with 2000+ Global Organizations Each Year
30K+ Citations by Top-Tier Firms in the Industry

Driver Impact Analysis

Driver ~% Impact on CAGR Geographic Relevance Impact Timeline
Rising pest & disease pressure from climate variability +0.9% Global Long-term (≥4 yr)
Regulatory phase-outs of legacy active ingredients +0.7% EU, APAC Medium-term (2–4 yr)
Precision agriculture & variable-rate sprayer adoption +0.6% North America, Europe Medium-term (2–4 yr)
Expansion of herbicide-tolerant crop acreage +0.5% South America, North America Short-term (≤2 yr)
Government subsidies for integrated pest management +0.4% APAC, EU Long-term (≥4 yr)
Growth in high-value horticulture & export crops +0.3% ASEAN, MEA Medium-term (2–4 yr)
Digital farm-input marketplaces for smallholders +0.2% APAC, Africa Long-term (≥4 yr)


Climate-Driven Pest Pressure

The UN Food and Agriculture Organization reports that plant pests and diseases destroy up to 40% of global food crops annually, creating substantial production losses. Accelerating climate change and shifting global temperatures expand the geographic range of invasive insects. This structural pressure drives growers to intensify targeted chemistry applications to protect baseline crop yields.


Regulatory Phase-Outs of Legacy Chemistries

Global chemical portfolios are shifting as major regulatory bodies restrict legacy active ingredients. Although the European Commission officially withdrew its proposed Sustainable Use Regulation in 2024, stringent localized restrictions and active bans on compounds like chlorpyrifos and paraquat continue across the EU, Brazil, and Thailand, forcing agribusinesses to adopt premium next-generation alternative formulations.


Precision Application Technology

The USDA Economic Research Service highlights that variable-rate technologies optimize chemical applications by matching field variations. Adoption has increased significantly, with variable-rate application covering over 37% of US corn acres. This data-driven precision technology allows commercial operations to justify premium-priced, highly targeted chemical solutions, offsetting lower total field volumes with higher-value specialty formulations.


Herbicide-Tolerant Crop Expansion

Data from Brazil’s Companhia Nacional de Abastecimento indicates continuous expansion of cultivated land, with soybean acreage projected to reach approximately 121 million acres. This expansion is paired with double-cropped safrinha corn, which relies extensively on genetically modified, herbicide-tolerant trait stacks. This structural acreage growth sustains predictable demand for pre-emergent and post-emergent chemical programs.


Restraints Impact Analysis

The restraint impacts below represent directional estimates of downward pressure on growth. They should not be subtracted directly from the CAGR and are presented to illustrate relative magnitude and timing.

Restraint ~% Impact on CAGR Geographic Relevance Impact Timeline
Organic farming expansion is reducing chemical demand –0.4% EU, North America Long-term (≥4 yr)
Herbicide resistance in key weed species –0.3% Global Medium-term (2–4 yr)
Maximum residue limit (MRL) trade disruptions –0.3% APAC, South America Short-term (≤2 yr)
Rising raw material and energy costs –0.2% Global Short-term (≤2 yr)
Seasonal labor migration is disrupting application timing –0.2% ASEAN, MEA Medium-term (2–4 yr)


Organic Farming Expansion

Certified organic acreage across the EU grew 56% between 2012 and 2022, reaching 16.9 million hectares, and the Farm to Fork strategy targets 25% of total EU farmland under organic management by 2030 [13]. In the United States, the USDA's Organic Transition Initiative allocated USD 300 million to support conventional-to-organic conversion. Each hectare transitioning out of conventional production represents a permanent demand loss for synthetic active ingredients in the Crop Protection Chemicals Market, particularly in high-value fruit and vegetable segments where organic premiums justify the yield trade-off.

Herbicide Resistance

Over 270 weed species have now developed confirmed resistance to at least one herbicide mode of action, with glyphosate-resistant Palmer amaranth alone affecting more than 40 million acres of US cropland [14]. Resistance forces growers into costlier multi-mode spray programs, but it also limits the efficacy ceiling of existing products and erodes farmer confidence in chemical-only strategies. The Crop Protection Chemicals Market faces a structural headwind as resistance-driven efficacy losses push integrated weed management adoption that partially substitutes mechanical and cultural controls for chemical inputs.

MRL-Related Trade Disruptions

Divergent maximum residue limits between importing and exporting nations create unpredictable market access risks. China's tightened MRLs on imported fruit from Thailand and Vietnam in 2023 triggered a temporary 12% drop in foliar fungicide applications on durian and longan orchards as exporters shifted to residue-free protocols [15]. Such trade-policy volatility dampens grower willingness to invest in full-season spray programs and introduces demand uncertainty into the Crop Protection Chemicals Market supply chain.


Crop Protection Chemicals Market Opportunities

Biological Crop Protection Integration

The convergence of microbial biocontrol agents, biostimulants, and RNA interference technologies opens a parallel growth lane. Companies bundling biological and chemical solutions into single resistance-management packages capture rapid biological portfolio growth while retaining base chemical revenue. Corporate pipeline developments signal that these integrated portfolios will define competitive advantage through 2035

.

Smallholder Digital Marketplaces in Emerging Markets

The UN Food and Agriculture Organization (FAO) reports that over 500 million smallholders supply most of the developing world's food, yet many lack formal agrochemical access. Emerging digital farm-input marketplaces connect these growers directly with verified suppliers, cutting supply chain costs and reducing reliance on counterfeit or unregistered crop protection products [12]

.

Data-Driven Prescription Services

Agrochemical companies are monetizing satellite imagery, weather analytics, and agronomic scouting data through subscription platforms. Shifting from commodity chemical suppliers to prescription service providers generates high-margin, recurring digital revenues alongside product sales. Operating on millions of hectares globally, these digital systems offer significantly stronger customer lock-in compared to transactional product sales [8].

Climate-Adaptive Formulation Development

Rising temperatures increase demand for heat-stable adjuvants, extended-release encapsulations, and drought-tolerant seed coatings. The World Bank estimates that global climate adaptation investments in agriculture must scale dramatically to safeguard regional food yields [2]. Manufacturers developing climate-resilient formulations can capture premium pricing across vulnerable, fast-warming agricultural zones in South Asia and Africa.


Drone-Applied Crop Protection

According to official ministry data, China's operational agricultural drone fleet has exceeded 300,000 units. Concurrently, India’s Sub-Mission on Agricultural Mechanization provides 40% to 50% financial assistance subsidies for drone procurement. The Crop Protection Chemicals Market must increasingly develop specialized, higher-margin formulations optimized explicitly for ultra-low-volume aerial applications [19].


Crop Protection Chemicals Market Future Outlook

AI-Powered Pest Surveillance and Autonomous Spraying

Artificial intelligence is redefining how the Crop Protection Chemicals Market operates at the field level. Machine-learning models trained on multispectral drone imagery can now detect fungal infections 5–10 days before visible symptom onset, enabling preemptive spot treatments that reduce overall chemical load by 20–40% [8]. By 2030, autonomous ground and aerial sprayers integrated with real-time pest-detection algorithms will become standard on operations exceeding 500 hectares in North America, Europe, and Brazil.

Platform Economics and Farm-Input Ecosystems

Digital platforms are consolidating the agrochemical value chain, bundling crop protection products with seed, fertilizer, insurance, and market-access services into single farmer subscriptions. Syngenta Group's acquisition of Valagro and BASF's Xarvio ecosystem illustrate how the Crop Protection Chemicals Market is evolving from transactional product sales toward recurring-revenue platform models [12]. The World Economic Forum (WEF) projects that digitalization will drive significant improvements in global agricultural input efficiency over the coming decade, and companies positioned at the platform layer are expected to capture disproportionate margins.


Sustainability Reporting and ESG Compliance

Mandatory sustainability disclosures under the EU's Corporate Sustainability Reporting Directive (CSRD) and the International Sustainability Standards Board (ISSB) framework are forcing agrochemical companies to quantify Scope 3 emissions across their value chains. The Crop Protection Chemicals Market will see growing differentiation between manufacturers that can demonstrate reduced environmental impact through formulation innovation and those reliant on legacy high-GWP production processes [13]. Companies with verified sustainability credentials will command procurement preference from multinational food processors and retailers targeting Science-Based Targets.

RNA-Based and Gene-Silencing Crop Protection

RNA interference (RNAi) and gene-editing technologies represent a highly disruptive long-term force in the Crop Protection Chemicals Market. Topical RNAi sprays targeting specific pest genes offer species-level selectivity without persistent soil residues, addressing both resistance and environmental concerns simultaneously [14]. Commercial proof-of-concept was established by GreenLight Biosciences' dsRNA-based product (Calantha) targeting the Colorado potato beetle, which achieved landmark regulatory registration and commercial launch. This success has prompted major market players, including Bayer and Syngenta, to advance their own topical RNA pipelines. Furthermore, regulatory bodies like the USDA and EPA have signaled that topically applied RNA products may qualify for expedited biopesticide pathways, potentially shortening traditional time-to-market timelines [21].


Crop Protection Chemicals Market Segmentation

By Origin

Segment Key Metric Primary Demand Driver
Synthetic 78% share (2025) Proven efficacy on broad-acre field crops
Biological 10.2% CAGR (2026–2035) Residue-free export and retailer mandates


Synthetic chemistries continue to anchor the Crop Protection Chemicals Market, delivering the broad-spectrum knock-down performance that large-scale grain and oilseed producers require. Active ingredient classes such as triazoles, strobilurins, and neonicotinoids remain workhorses across major cropping systems. Biological alternatives, however, are advancing rapidly as regulatory approvals expand and formulation stability improves. Microbial biocontrol agents based on Bacillus and Trichoderma strains now account for the majority of new biological registrations globally, and their integration into conventional spray programs is eroding the traditional either-or framing between chemical and biological approaches.

By Product Type

Segment Key Metric Primary Demand Driver
Herbicides 47% share (2025) Trait-stacked cropping systems
Insecticides USD 92.50 Million (2025) Lepidopteran and sucking pest cycles
Fungicides 4.6% CAGR (2026–2035) Systemic fungicide crop treatment programs
Molluscicides USD 8.20 Million (2025) Rice paddy snail control in ASEAN
Nematicides 5.1% CAGR (2026–2035) Soil-health awareness in horticulture
Bio-Pesticides 11.8% CAGR (2026–2035) IPM mandates and MRL compliance


Herbicides dominate the Crop Protection Chemicals Market product mix, reflecting the scale of global weed management spending tied to herbicide-tolerant soybean, corn, canola, and cotton acres. Glyphosate-based systems still account for the plurality of herbicide revenue, though post-patent generic competition is compressing margins. Bio-pesticides are the standout growth category, driven by government IPM mandates, retailer residue-free sourcing policies, and the registration of novel microbial strains that offer multi-target efficacy against both insects and soil-borne pathogens.

By Application Method

Segment Key Metric Primary Demand Driver
Foliar Spray 58% share (2025) Versatility across crop types and pest targets
Seed Treatment 9.7% CAGR (2026–2035) Targeted delivery and lower dose requirements
Soil Treatment USD 52.60 Million (2025) Nematode and soil-borne disease management
Others 3.8% CAGR (2026–2035) Chemigation and trunk-injection systems


Foliar spray remains the backbone application method in the Crop Protection Chemicals Market, delivering active ingredients directly to plant canopies where most pest and disease interactions occur. Seed treatment, however, is gaining share at a rapid pace as it places precise doses in the root zone at planting, reducing environmental exposure and aligning with zero-residue harvest targets. Advances in polymer coating technology and seed-applied biologicals are broadening the efficacy window of treated seeds beyond traditional fungicide and insecticide protection.

By Crop

Segment Key Metric Primary Demand Driver
Grains & Cereals 43% share (2025) Global staple-crop acreage dominance
Fruits & Vegetables 9.1% CAGR (2026–2035) High-value export residue compliance
Commercial Crops USD 78.40 Million (2025) Cotton, sugarcane, and plantation inputs
Others 3.5% CAGR (2026–2035) Turf, ornamentals, and forestry


Grains and cereals anchor the Crop Protection Chemicals Market by volume, with wheat, rice, maize, and soybean programs collectively consuming nearly half of all active ingredients sold globally. Fruits and vegetables represent the fastest-expanding crop segment as rising middle-class consumption in Asia and Africa drives fresh-produce demand and growers invest heavily in fungicide and insecticide programs to meet export MRL standards. Premium crops such as durian, mango, and avocado command high per-hectare protection spend, making them attractive targets for specialty formulation suppliers.


Regional Market Share Analysis

Region Key Metric Primary Investment Themes
Asia-Pacific 38% share (2025) Rice intensification; digital smallholder platforms
North America USD 103.00 Million (2025) Herbicide-tolerant traits; precision application
Europe 22% share (2025) Green Deal compliance; biological integration
South America 6.2% CAGR (2026–2035) Double-cropping expansion; trait adoption
Middle East & Africa USD 21.00 Million (2025) Irrigated horticulture; desert locust programs
Total USD 413.00 Million (2025)

The Crop Protection Chemicals Market displays pronounced regional variation shaped by crop mix, regulatory intensity, and distribution infrastructure maturity. Asia-Pacific leads by revenue, while South America registers the fastest growth rate through 2035.


North America

Country Key Metric Key Driver
US 72% of regional share Row-crop herbicide dominance
Canada 4.8% CAGR Canola and pulse crop expansion
Mexico USD 8.50 Million (2025) Avocado and berry export growth


North America's Crop Protection Chemicals Market benefits from highly mechanized farming, widespread adoption of genetically modified trait platforms, and a mature distribution channel. The US EPA's ongoing registration reviews of organophosphate and neonicotinoid classes are accelerating replacement demand for diamide and SDHI chemistries. At the same time, Canada's Pest Management Regulatory Agency continues to harmonize MRL standards with US tolerances to facilitate cross-border trade [10][20].

Europe

Country Key Metric Key Driver
Germany 19% of regional share Cereal and sugar beet programs
UK 4.3% CAGR Post-Brexit regulatory flexibility
France USD 14.80 Million (2025) Wine and oilseed protection spend
Italy 13% of the regional share Horticultural diversification
Spain 4.1% CAGR Mediterranean fruit & vegetable exports
Nordic Countries USD 4.20 Million (2025) Integrated pest management mandates
Russia 16% of regional share Wheat and sunflower area expansion
Rest of Europe 3.7% CAGR Emerging EU-candidate nation adoption


The European Crop Protection Chemicals Market operates under the world's most restrictive regulatory framework. The EU's Regulation (EC) 1107/2009 governs active substance approvals, and the pending Sustainable Use Regulation will impose binding national reduction targets. These constraints are shifting the product mix toward lower-risk substances and bio-based formulations, compressing the synthetic segment while opening opportunity corridors for companies with strong biological portfolios [3][13].

Asia-Pacific

Country Key Metric Key Driver
China 34% of the regional share Rice, vegetable, and fruit programs
India 5.8% CAGR Monsoon-driven insecticide demand
Japan USD 11.20 Million (2025) High-value horticultural automation
South Korea 3.9% CAGR Greenhouse and orchard treatments
ASEAN 26% of regional share Rice paddy and tropical fruit protection
Rest of Asia-Pacific 4.7% CAGR Emerging precision agriculture adoption


Asia-Pacific anchors the Crop Protection Chemicals Market with the world's largest rice-growing footprint and rapidly expanding horticultural acreage. China's recent ban on paraquat and ongoing tightening of environmental discharge standards for agrochemical manufacturers are consolidating the domestic production base and raising export quality thresholds. India's government subsidy programs for neem-based biopesticides and micro-irrigation are reshaping input demand patterns in the subcontinent [11][17].

South America

Country Key Metric Key Driver
Brazil 68% of regional share Soybean double-cropping and sugarcane
Argentina 5.9% CAGR Wheat-soybean rotation intensification
Rest of South America USD 5.60 Million (2025) Andean specialty crop demand


Brazil's Crop Protection Chemicals Market alone accounts for roughly two-thirds of the regional total, sustained by the world's largest soybean and sugarcane harvests. The country's Programa Nacional de Bioinsumos, launched in 2020, is accelerating biological product registrations; MAPA approved over 500 new biopesticide registrations between 2021 and 2024 [9][18].

Middle East & Africa

Country Key Metric Key Driver
Saudi Arabia 24% of regional share Greenhouse vegetable protection
UAE 5.1% CAGR Controlled-environment agriculture
South Africa USD 5.40 Million (2025) Maize and citrus crop programs
Egypt 28% of the regional share Nile Delta cotton and rice demand
Rest of MEA 4.6% CAGR Locust control and food security programs


The Middle East and Africa represent a smaller but strategically significant slice of the Crop Protection Chemicals Market. FAO-led desert locust emergency programs across the Horn of Africa have deployed organophosphate and biopesticide interventions valued at over USD 200 million since 2020 [2]. Urbanization-driven demand for fresh produce in the Gulf Cooperation Council states is funding controlled-environment agriculture investments that require specialized fungicide and insecticide inputs.


Crop Protection Chemicals Market By Region, 2025-2035

Competitive Benchmarking

The Crop Protection Chemicals Market exhibits high concentration, with the top five companies controlling an estimated 55–62% of global revenue. The Herfindahl-Hirschman Index sits in the moderately concentrated range (approximately 1,200–1,500), reflecting a structure where a handful of integrated multinational agrochemical firms compete with a long tail of regional generic manufacturers and emerging biological specialists. Patent cliffs on major active ingredients such as chlorantraniliprole (2026) and fluopyram (2028) are intensifying generic competition while redirecting R&D investment toward differentiated biological and RNA-based platforms.

Company Est. Revenue Share Range Key Offerings Strategic Positioning
Syngenta Group ~12–15% Broad fungicide, herbicide, and seed-treatment portfolio; Cropwise digital platform Vertically integrated with global distribution.
Bayer CropScience ~11–14% Herbicide-tolerant trait systems; RNAi pipeline; biological acquisitions Trait-chemistry integration leader
BASF SE ~9–12% Strobilurin fungicides; Xarvio digital farming; specialty herbicides Innovation-led premium positioning
Corteva Agriscience ~8–11% Spinosyn insecticides; Enlist herbicide system; biologicals pipeline Post-DowDuPont pure-play crop focus
FMC Corporation ~5–8% Diamide insecticides; biologicals through BioPhero acquisition Specialty insecticide niche leader
UPL Limited ~4–7% Generic post-patent crop protection; OpenAg platform Cost-competitive global reach
Sumitomo Chemical ~3–6% Japanese specialty chemistries; Nufarm partnership Asia-Pacific and Oceania stronghold
Nufarm Limited ~2–4% Herbicide and fungicide formulations for broadacre crops Australia and the Southern Hemisphere focus
ADAMA Ltd. ~2–4% Off-patent formulations; combination products Value-segment global distributor
Nihon Nohyaku Co. ~1–3% Specialty insecticides and fungicides for rice and horticulture Japanese domestic and Asian export network


Recent News & Developments

  • Syngenta (October 2025)- Launched VICTRATO in Brazil, a novel seed treatment technology designed to provide robust protection against nematodes and key early-season diseases.
  • Corteva Agriscience (June 2025)-Confirmed the release of Forcivo fungicide, utilizing three active ingredients to combat major foliar diseases in corn and soybeans.
  • BASF (May 2026)-Launched Valexio Insecticide and Mibelya Fungicide in India, introducing patented Revysol and Xemium ingredients to protect regional rice crops.


Crop Protection Chemicals Market Report Scope

Item Detail
Market Scope Global Crop Protection Chemicals Market covering synthetic and biological origins, six product categories, four application methods, and four crop segments
Study Period 2021–2035
CAGR (2026–2035) 4.5%
Base Year Market Size (2025) USD 413.00 Million
Forecast Endpoint (2035) USD 639.00 Million
Fastest Growing Segment Bio-Pesticides (11.8% CAGR)
Companies Profiled 10
Valuation Currency USD Million


FAQs

How do patent expirations on major active ingredients affect pricing in the Crop Protection Chemicals Market?
Patent cliffs trigger 30–50% price erosion within two years as generic manufacturers enter the market. Innovators offset losses by launching differentiated premix formulations and digital service bundles [5].
What role do adjuvants play in improving crop protection product performance?
Modern adjuvants enhance droplet retention, cuticle penetration, and rainfastness, boosting active ingredient uptake by 15–25%. Selecting the right adjuvant-chemistry pairing is critical for efficacy in the Crop Protection Chemicals Market [7].
How should procurement teams evaluate biological versus synthetic solutions?
Compare cost-per-hectare efficacy data across at least two crop seasons, factoring in residue compliance costs. Biologicals often deliver better ROI on high-value export crops despite higher unit pricing [25].
What cybersecurity risks exist for digitally connected precision spraying systems?
GPS-guided and IoT-enabled sprayers face firmware tampering and data interception threats. Manufacturers are embedding encrypted communication protocols into next-generation controllers within the Crop Protection Chemicals Market [8].
How does resistance management influence long-term formulation strategy?
Effective resistance management requires rotating at least three distinct modes of action per season. Companies investing in novel MOA discovery hold a strategic advantage in the Crop Protection Chemicals Market [14].
What quality certifications matter most when sourcing generic crop protection products?
ISO 9001, GHS-compliant labeling, and FAO/WHO specification equivalence are baseline requirements. Buyers should also verify stability data under tropical storage conditions [4].
How are carbon-credit programs creating new value in the Crop Protection Chemicals Market?
Reduced-tillage herbicide programs generate verifiable soil-carbon sequestration credits valued at USD 15–30 per hectare annually. Agrochemical companies are partnering with carbon registries to monetize this co-benefit [12].    
Author
Author
Author Profile
Snehal Singh LinkedIn
Manager - Research
High acumen in analyzing complex macro & micro markets with more than 6 years of work experience in the field of market research. By implementing her analytical skills in forecasting and estimation into market research reports, she has expertise in Packaging, Construction, and Equipment domains. She handles a team size of 20-25 resources and ensures smooth running of the projects, associated marketing activities, and client servicing.
Share::
Request Free Sample

Research Approach


Secondary Research

The secondary research process entailed an exhaustive examination of regulatory databases, agrochemical industry publications, peer-reviewed agricultural journals, and reputable food security organizations. Key sources included the US Environmental Protection Agency (EPA), European Food Safety Authority (EFSA), Food and Agriculture Organization (FAO) of the United Nations, US Department of Agriculture (USDA), European Chemicals Agency (ECHA), Health Canada's Pest Management Regulatory Agency (PMRA), Australian Pesticides and Veterinary Medicines Authority (APVMA), FAO/WHO Joint Meeting on Pesticide Residues (JMPR), Codex Alimentarius Commission, USDA National Agricultural Statistics Service (NASS), EU Pesticides Database, OECD Test Guidelines, CropLife International, and national agricultural ministry reports from key markets including the Central Insecticides Board (India), Chinese Ministry of Agriculture and Rural Affairs, and Brazil's Ministry of Agriculture. These sources were used to gather information on the use of pesticides, the safety of active ingredients, the approval of new pesticides by regulators, trends in the use of agricultural land, databases of crop yields, and the competitive landscape for herbicides, insecticides, fungicides, and new biological crop protection solutions.


Primary Research

During the primary research process, both supply-side and demand-side stakeholders were interviewed to gather both qualitative and quantitative information. Supply-side sources were CEOs, VPs of Product Development, heads of regulatory affairs, and commercial directors from agrochemical manufacturers, formulators, and early-stage biologicals companies. Demand-side sources included agronomists, crop consultants, managers of agricultural cooperatives, procurement leads from big farming operations, distributor sales reps, and sustainability officers from food processor networks. Primary research confirmed market segmentation across chemical and biological crop protection categories, confirmed product pipeline timelines for new active ingredients, and gathered insights on application technology adoption, precision agriculture integration, pricing strategies per hectare, and regulatory compliance costs.

Primary Respondent Breakdown:

By Designation: C-level Primaries (32%), Director Level (33%), Others (35%)

By Region: North America (32%), Europe (25%), Asia-Pacific (35%), Rest of World (8%)


Market Size Estimation

Global market valuation was derived through revenue mapping and application volume analysis. The methodology included:

Identification of 50+ key manufacturers and formulators across North America, Europe, Asia-Pacific, and Latin America

Product mapping across herbicides, insecticides, fungicides, and biopesticide categories including glyphosate, atrazine, neonicotinoids, pyrethroids, azoles, and strobilurins

Analysis of reported and modeled annual revenues specific to crop protection chemical portfolios

Coverage of manufacturers representing 75-80% of global market share in 2024

Extrapolation using bottom-up (cultivated hectare volume × application rate × ASP by country) and top-down (manufacturer revenue validation) approaches to derive segment-specific valuations for synthetic chemicals and biological alternatives

Share::
Request Free Sample
Download Free Sample

Kindly complete the form below to receive a free sample of this Report

Share::
Request Free Sample
Download PDF ×

We do not share your information with anyone. However, we may send you emails based on your report interest from time to time. You may contact us at any time to opt-out.
















