Seed Treatment Market (2026 - 2035)

Seed Treatment Market Size, Share, Industry Trend & Analysis Research Report Information By Function (Insecticide, Fungicide, Nematicide), By Crop Type (Grains and Cereals, Pulses and Oilseeds, Commercial Crops, Fruits and Vegetables, Turf and Ornamental), By Region (North America, Europe, Asia-Pacific, South America, Middle East & Africa) – Forecast Till 2035

Forecast Period
2026-2035
CAGR
4.58%
2025 Market Size
USD 10.16 Billion (2025)
2035 Market Size
USD 15.90 Billion (2035)
Agriculture ● Updated July 28, 2026 Report ID: MRFR/Agri/4695-CR | Pages: 111 | Author: Snehal Singh

Seed Treatment Market Summary

The Seed Treatment Market reached an estimated USD 10.16 Billion in 2025 and is projected to climb to USD 10.63 Billion in 2026 before reaching USD 15.90 Billion by 2035, expanding at a 4.58% CAGR across the 2026–2035 forecast window. This trajectory reflects a convergence of tightening maximum-residue-limit (MRL) regulations under the EU's Farm to Fork Strategy and accelerating demand for high-yield hybrid seed varieties across South America and Asia-Pacific [1]. Government subsidy programs — including India's PM-KISAN scheme and Brazil's Plano Safra agricultural credit line — continue channeling billions into treated-seed adoption among medium-scale growers [2].

A structural shift is reshaping the Seed Treatment Market as conventional broad-spectrum chemical dressings give way to precision-applied biological and polymer-encapsulated formulations. Investments exceeding USD 1.2 Billion in seed-applied microbial R&D between 2022 and 2025 have shortened development timelines for next-generation biocontrol agents from seven years to fewer than four [3]. Seed polymer coating technology has cut dust-off emissions by up to 85%, clearing European and North American safety thresholds and unlocking fresh market access for treated-seed exporters [4].

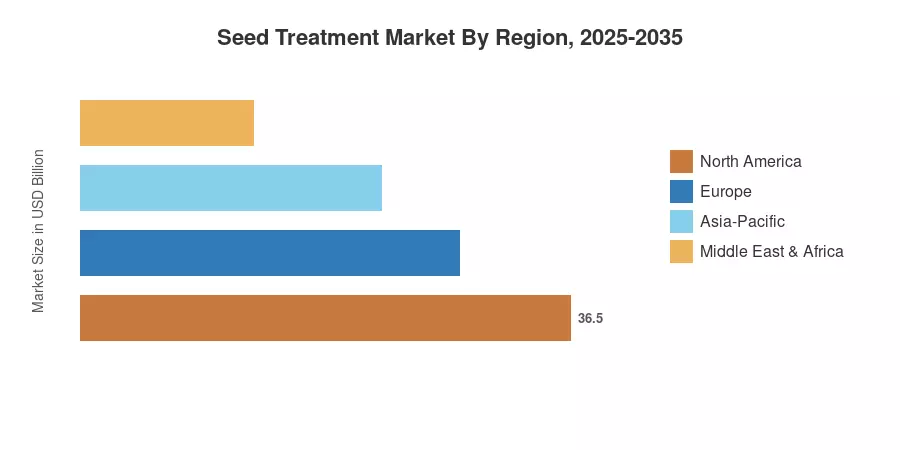
South America commands roughly 40.8% of the global Seed Treatment Market, driven by Brazil's massive soybean and maize acreage and Argentina's expanding pulse production. North America is the fastest-growing region, posting a projected 5.02% CAGR through 2035 as precision agriculture platforms scale across the U.S. Corn Belt. Europe holds the second-largest share at approximately 17.0%, anchored by stringent integrated-pest-management mandates that favor seed-applied solutions over foliar sprays. The decade ahead will reward suppliers that pair advanced coating chemistry with digital agronomic advisory services.


Key Report Takeaways

• By Function

  • Insecticides accounted for 66.3% of the Seed Treatment Market in 2025, reflecting the dominance of soybean and maize pre-plant pest management across the Americas.
  • Fungicide-based treatments are projected to grow at a 3.92% CAGR through 2035, supported by rising Fusarium and Rhizoctonia pressure in temperate cereal regions.
  • Nematicide seed treatments generated approximately USD 0.63 Billion in 2025, with adoption accelerating in South American and South Asian cotton and sugarcane belts.

• By Crop Type

  • Grains and cereals represented 38.5% of the Seed Treatment Market in 2025, underpinned by wheat and rice treatment programs in Europe and Asia-Pacific.
  • Pulses and oilseeds are forecast to register a 4.81% CAGR to 2035, the fastest among crop-type segments, driven by soybean expansion in Brazil and chickpea acreage growth in India.

• By Region

  • South America held 40.8% of the Seed Treatment Market share in 2025, led by Brazil's treated-soybean protocols.
  • North America is anticipated to expand at a 5.02% CAGR between 2026 and 2035, buoyed by variable-rate seed-coating adoption across the U.S. and Canada.


Market Size and Forecast (2021–2035)

Market Research Future's size estimates draw on proprietary bottom-up modeling that aggregates treated-seed volumes by active ingredient, crop type, and geography, validated against public trade data and company filings. Historical values (2021–2024) use confirmed shipment records, while the forecast applies a calibrated CAGR of 4.58% from the 2026 base.
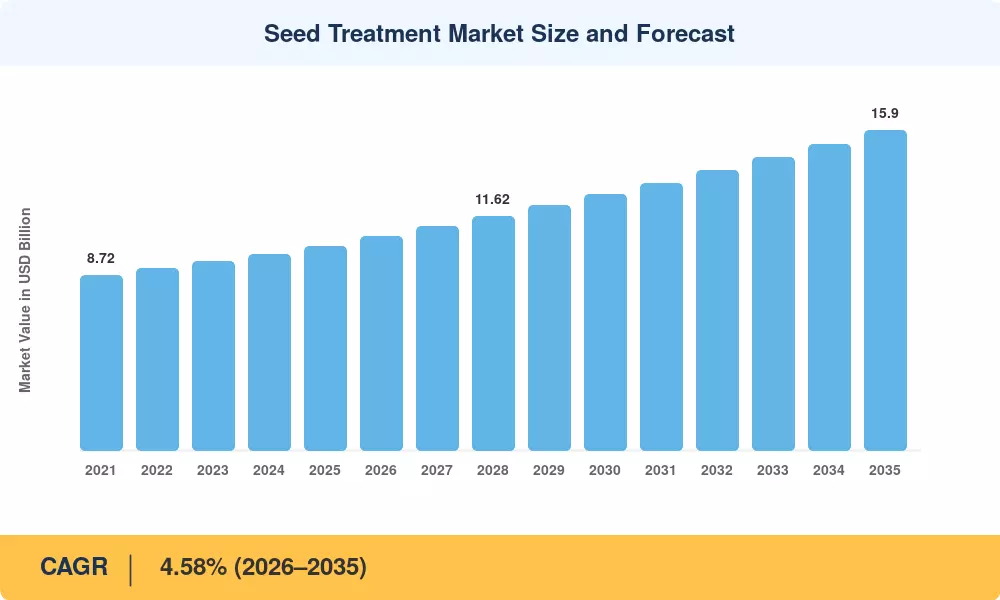
Seed Treatment Market Size and Forecast
Our Impact
Enabled $4.3B Revenue Impact for Fortune 500 and Leading Multinationals
Partnering with 2000+ Global Organizations Each Year
30K+ Citations by Top-Tier Firms in the Industry

Driver Impact Analysis

Driver ~% Impact on CAGR Geographic Relevance Impact Timeline
Hybrid & GM seed adoption 22% South America, North America Short-term (≤2 yr)
Precision micro-dosing platforms 18% North America, Europe Medium-term (2–4 yr)
Biological formulation proliferation 16% Global Medium-term (2–4 yr)
MRL tightening & low-residue incentives 14% Europe, Asia-Pacific Short-term (≤2 yr)
Pulse & oilseed acreage expansion 12% South America, South Asia Long-term (≥4 yr)
Integrated pest management mandates 10% Europe, Africa Long-term (≥4 yr)
Polymer encapsulation dust-off reduction 8% Europe, North America Short-term (≤2 yr)


Hybrid and GM Seed Adoption

Brazil's National Biosafety Technical Commission (CTNBio) approved 14 new GM soybean and maize traits between 2023 and 2025, each requiring optimized seed-applied insecticide and fungicide packages [7]. Every hectare planted with a premium hybrid trait carries an average seed-treatment spend roughly 35% higher than conventional varieties, creating a direct volume multiplier across South America's 65-million-hectare row-crop footprint. The U.S. Department of Agriculture reports that over 92% of planted corn acres in the United States now use treated seed, leaving incremental growth concentrated in specialty crops and emerging geographies [13].

Precision Micro-Dosing Platforms

Variable-rate seed-coating equipment — integrated with satellite-derived soil pathogen maps — allows growers to calibrate active-ingredient loads at the individual-seed level, cutting chemical use by up to 30% while maintaining efficacy [9]. John Deere's ExactApply platform and BASF's xarvio digital ecosystem have both piloted seed-level treatment prescriptions across more than 2 million acres in the U.S. Midwest since 2024. This driver strengthens the Seed Treatment Market's value proposition by aligning cost reduction with environmental compliance.

Biological Formulation Proliferation

Registrations of microbial and biochemical seed treatments rose 28% globally between 2022 and 2025, according to CropLife International's active-ingredient database [3]. Trichoderma- and Bacillus-based products now account for an estimated 11% of global seed treatment revenue, up from 6% in 2020. The EU's accelerated review pathway for low-risk biological active substances — introduced under Regulation (EC) 1107/2009 amendments — has cut average registration timelines from 36 months to 18 months, encouraging R&D investment from both agrochemical majors and biotech start-ups [14].

MRL Tightening and Low-Residue Incentives

The European Commission's Farm to Fork strategy targets a 50% reduction in chemical pesticide use by 2030, and seed treatments are increasingly positioned as the lowest-residue delivery method for crop protection actives [11]. Japan's Positive List System and South Korea's Pesticide Positive List similarly cap residue limits on imported grains, pushing exporting nations — particularly Australia and Argentina — toward treated-seed protocols that meet destination-market thresholds [15].


Restraints Impact Analysis

Restraint impact percentages follow the same directional methodology described in Section 4 and are not directly subtracted from the CAGR.

Restraint ~% Impact on CAGR Geographic Relevance Impact Timeline
Registration complexity & cost –18% Global Long-term (≥4 yr)
Target-pest resistance development –16% South America, Asia-Pacific Medium-term (2–4 yr)
Smallholder price sensitivity –14% Africa, South Asia Long-term (≥4 yr)
Neonicotinoid usage restrictions –12% Europe, North America Short-term (≤2 yr)
Biological product shelf-life limitations –10% Global Medium-term (2–4 yr)


Registration Complexity and Cost

Bringing a new seed-treatment active ingredient from discovery to full global registration costs an estimated USD 250–300 million and takes 10–12 years on average, according to CropLife International [14]. Divergent data requirements between the U.S. EPA, EFSA, and Brazil's ANVISA force manufacturers to run parallel dossier programs, inflating per-market entry costs by 20–40%. Smaller innovators frequently abandon registrations in secondary markets, fragmenting the global supply of novel chemistries and limiting the Seed Treatment Market's innovation throughput.

Target-Pest Resistance Development

Repeated exposure to imidacloprid and thiamethoxam seed dressings has driven documented resistance in key pest complexes — including soybean aphid (Aphis glycines) populations in Brazil's Cerrado and white grub (Holotrichia spp.) in India's Deccan plateau [16]. The Insecticide Resistance Action Committee (IRAC) classified 17 seed-treatment-relevant pest-active combinations as exhibiting moderate to high resistance risk by 2024, compelling growers to rotate chemistries or adopt more expensive multi-mode formulations [17].

Smallholder Price Sensitivity

Across Sub-Saharan Africa and South Asia, where farms average fewer than two hectares, the incremental cost of commercially treated seed — typically USD 8–15 per hectare above untreated alternatives — remains a significant adoption barrier [12]. Public subsidy programs partially offset this premium, but inconsistent funding cycles and supply-chain leakage limit reach to fewer than 30% of target smallholders in most national programs, constraining volume growth for the Seed Treatment Market in these high-potential regions.


Seed Treatment Market Opportunities

Digital Prescription Platforms

Overlaying subscription revenue to treatment providers with AI-driven soil diagnosis, coupled with seed treatment choices. Platforms that can ingest field-level pathogen pressure, weather forecasts and seed variety data can prescribe optimum treatment stacks — turning a commodity chemical sale into a recurring digital-agronomic service. Early movers like Syngenta’s Cropwise and Corteva’s Granular Insights have shown 12–18% yield-response increases vs traditional treatments in test operations on 500,000 acres [9].


Sub-Saharan Africa Smallholder Penetration

The penetration of treated seeds in Africa is less than 15%. However, the area planted on the continent is predicted to increase by 20 million hectares by 2035 under the African Union’s Comprehensive Africa Agriculture Development Programme (CAADP) [12]. Programs that provide access to publicly and privately treated seed — such as the Alliance for a Green Revolution in Africa (AGRA) input-subsidy model — offer a scalable blueprint for distributing pre-treated seed packs through existing agro-dealer networks.


Bioprotectant seed treatment Commercialization

The quick development of microbial consortia integrating Trichoderma, Bacillus and mycorrhizal fungi in one coating, offers premium positioning options in organic and regenerative agriculture channels. The worldwide organic-seed market size is projected to be worth USD 7.5 Billion in 2025, which is an addressable segment for biological treatment providers and relatively untapped [3].


Nematicide Segment Expansion

Nematode damage is expected to cost global agriculture USD 170 billion annually, while seed-applied nematicides are used on less than 8% of at-risk areas [16]. The new seed treatments based on fluopyram and tioxazafen provide systemic protection, but without the environmental profile concerns of earlier soil fumigants. Thus, the nematicide function will be the highest-growth value pocket in the Seed Treatment Market during the next decade.


Data Monetization via Treatment-Outcome Analytics

Seed-treatment companies that aggregate anonymized field-performance data — linking treatment protocols to yield outcomes across millions of acres — can monetize these datasets through licensing to crop insurers, commodity traders, and input retailers. This data-as-a-service model creates margins independent of active-ingredient volumes and deepens customer switching costs.


Seed Treatment Market Future Outlook

AI-Driven Agronomic Advisory Integration

By 2030, an estimated 40% of seed-treatment prescriptions in North America and Europe will be generated algorithmically, drawing on satellite imagery, in-field sensor data, and historical yield records [9]. This convergence transforms seed treatment from a standalone input decision into a node within a broader digital-farming operating system, deepening supplier lock-in and enabling outcome-based pricing models for the Seed Treatment Market.

Biological–Chemical Hybrid Formulations

The next generation of seed coatings will increasingly combine synthetic active ingredients with living microbial agents in a single application layer. Advances in encapsulation chemistry — including spray-dried polymer matrices that maintain microbial viability for 18+ months — resolve the shelf-life constraint that has limited biological market share [3]. The FAO projects that biological components will feature in over 30% of all seed treatments sold globally by 2032 [19].

Sustainability Reporting and ESG Compliance

Publicly traded food companies face growing pressure from ISSB and EU CSRD frameworks to disclose pesticide intensity across supply chains [20]. Seed treatment — with its closed-system application, minimal environmental drift, and quantifiable per-hectare active-ingredient load — offers a reportable, auditable metric that foliar sprays cannot match. This ESG advantage positions the Seed Treatment Market to capture share from broadcast application methods throughout the forecast period.

Climate-Adaptive Treatment Portfolios

Rising soil temperatures and shifting precipitation patterns are altering pathogen and pest geographies — pushing Fusarium head blight into previously unaffected northern latitudes and extending nematode ranges into temperate zones [16]. Treatment suppliers that develop regionally adapted product portfolios, validated through multi-environment trial networks, will capture disproportionate value as growers seek crop-establishment insurance against climate volatility. The CGIAR's Climate-Resilient Agri-Food Systems initiative has earmarked USD 500 million for treated-seed R&D targeting climate-stressed production environments [21].


Seed Treatment Market Segmentation

By Function

Segment Key Metric Primary Demand Driver
Insecticide 66.3% share (2025) Soybean and maize pre-plant pest management
Fungicide CAGR 3.92% (2026–2035) Fusarium and Rhizoctonia pressure in cereals
Nematicide USD 0.63 Billion (2025) Cotton and sugarcane nematode control


Insecticides dominate the Seed Treatment Market by function, reflecting the critical need to protect germinating seeds and seedlings from soil-dwelling and early-season above-ground pests. Neonicotinoid-class actives — clothianidin, imidacloprid, and thiamethoxam — still represent the majority of insecticide seed-treatment volume, though diamide-based alternatives (cyantraniliprole, chlorantraniliprole) are gaining share rapidly as regulatory reviews restrict neonicotinoid use in pollinator-sensitive regions [8] [17].

Fungicide treatments address a different risk profile, protecting against seed-borne and soil-borne pathogens during the vulnerable germination window. Triazole and strobilurin chemistries remain the workhorses, but newer SDHI-class fungicides (fluopyram, pydiflumetofen) offer broader-spectrum activity and fit well in resistance-management rotations. The Seed Treatment Market's fungicide segment benefits from climate-driven disease pressure that is expanding the geographic range of key pathogens.

By Crop Type

Segment Key Metric Primary Demand Driver
Grains and Cereals 38.5% share (2025) Wheat, rice, and maize treatment programs
Pulses and Oilseeds CAGR 4.81% (2026–2035) Soybean expansion and chickpea acreage growth
Commercial Crops USD 2.13 Billion (2025) Cotton and sugarcane treatment requirements
Fruits and Vegetables 12.8% share (2025) High-value horticultural seed preparation
Turf and Ornamental CAGR 3.45% (2026–2035) Professional turf management and golf-course maintenance


Grains and cereals anchor the Seed Treatment Market by crop type, with wheat alone accounting for over 220 million treated hectares globally [13]. Rice treatment — historically limited by wet-seeding practices — is growing as direct-seeded rice systems expand across South and Southeast Asia, enabling conventional coating technologies to reach a previously untreatable crop. Pulses and oilseeds represent the fastest-growing crop segment, propelled by soybean acreage expansion in Brazil and chickpea plantings in India's rain-fed zones.


Regional Market Share Analysis

Region Key Metric Primary Investment Themes
North America CAGR 5.02% (2026–2035) Precision application, biological R&D
Europe 17.0% share (2025) MRL compliance, IPM mandates
Asia-Pacific USD 1.63 Billion (2025) Smallholder subsidy programs, rice treatment
South America 40.8% share (2025) Soybean/maize treated-seed protocols
Middle East & Africa CAGR 3.92% (2026–2035) CAADP programs, irrigated wheat expansion

The Seed Treatment Market exhibits pronounced geographic concentration, with South America and North America together accounting for nearly 59% of global value. Regional dynamics vary sharply: South American demand is volume-driven by row-crop monocultures, while European growth hinges on regulatory-driven product reformulation.


North America

Country Key Metric Key Driver
United States 62% of regional share Corn Belt treated-seed saturation; specialty crop expansion
Canada CAGR 4.75% Canola and pulse treatment growth in Prairie provinces
Mexico USD 0.31 Billion (2025) Government seed-subsidy programs for staple crops


The United States accounts for the lion's share of North American demand, with treated-seed penetration exceeding 90% in corn and soybeans [13]. Growth is shifting toward specialty crops — vegetables, tree nuts, and turf grass — where treatment penetration sits below 40%. Canada's canola industry has adopted nearly universal seed dressing, and regulatory harmonization with U.S. EPA standards simplifies cross-border product registration for the Seed Treatment Market.

Europe

Country Key Metric Key Driver
Germany 22% of regional share Precision-farming integration in wheat and rapeseed
United Kingdom CAGR 4.12% Post-Brexit regulatory independence accelerating approvals
France 18% of regional share Large cereal acreage and cooperative purchasing structures
Italy USD 0.14 Billion (2025) Durum wheat and rice paddy treatments
Spain CAGR 3.85% Horticultural seed treatment expansion
Nordic Countries 8% of regional share Barley and oat treatment programs
Russia USD 0.12 Billion (2025) Wheat export-quality compliance treatments
Rest of Europe 15% of regional share Diverse cereal and oilseed portfolios


Europe's regulatory environment — shaped by EFSA re-evaluations and neonicotinoid restrictions — has accelerated the shift toward biological and reduced-risk seed treatments. Germany and France together represent 40% of regional demand, anchored by large-scale wheat and rapeseed operations that increasingly require treated seed to meet retailer and export MRL thresholds [8] [11].

Asia-Pacific

Country Key Metric Key Driver
China 34% of regional share Government-mandated crop-protection modernization
India CAGR 5.35% PM-KISAN subsidies and cotton/pulse expansion
Japan USD 0.18 Billion (2025) Rice paddy treatment and Positive List compliance
South Korea 7% of regional share High-value horticultural seed treatment
ASEAN CAGR 4.92% Rice and palm oil seed treatment adoption
Rest of Asia-Pacific USD 0.12 Billion (2025) Emerging treated-seed infrastructure


India represents the region's fastest-growing national market, driven by government input subsidies that partially offset treated-seed premiums for cotton, chickpea, and rice farmers [10]. China's seed-treatment penetration rose from an estimated 28% of planted area in 2020 to 39% in 2025, supported by provincial mandates to reduce foliar pesticide applications under the National Pesticide Reduction Action Plan [18].

South America

Country Key Metric Key Driver
Brazil 58% of regional share Soybean, maize, and cotton treatment mandates
Argentina CAGR 4.15% Pulse and sunflower treatment growth
Rest of South America USD 0.61 Billion (2025) Paraguay and Uruguay soybean expansion


Brazil alone accounts for nearly a quarter of the global Seed Treatment Market value, with virtually 100% of commercially planted soybean seed receiving insecticide and fungicide dressings [7]. The country's tropical-pest pressure — including Helicoverpa armigera and Asian soybean rust — makes seed treatment an indispensable first line of defense. Argentina's pulse-export sector is driving incremental demand as destination-market MRL requirements tighten.

Middle East & Africa

Country Key Metric Key Driver
Saudi Arabia CAGR 3.65% Irrigated wheat and alfalfa programs
UAE 12% of regional share Controlled-environment agriculture seed preparation
South Africa USD 0.19 Billion (2025) Maize and sunflower treatment adoption
Egypt CAGR 4.28% Nile Delta wheat intensification
Rest of MEA 45% of regional share Donor-funded smallholder access programs


Sub-Saharan Africa's low penetration rate — estimated below 15% — represents both a restraint and an opportunity for the Seed Treatment Market [12]. South Africa's commercial farming sector mirrors developed-market treatment rates, while the rest of the continent depends heavily on donor-supported input-subsidy programs to drive adoption. Egypt's wheat self-sufficiency drive is accelerating treated-seed procurement through state-owned agricultural cooperatives.


Seed Treatment Market By Region, 2025-2035

Competitive Benchmarking

The Seed Treatment Market is moderately concentrated, with the top five suppliers capturing an estimated 42–48% of global revenue. The Herfindahl–Hirschman Index (HHI) sits in the 800–1,200 range, indicating meaningful but not dominant concentration. Strategic alliances between agrochemical incumbents and biotech start-ups have intensified since 2023, with at least eight significant licensing deals and acquisitions reshaping the competitive map. Differentiation increasingly depends on a supplier's ability to bundle chemical and biological actives with digital prescription platforms.

Company Est. Revenue Share Range Key Offerings for Seed Treatment Market Strategic Positioning
Syngenta Group ~9–12% Cruiser, Vibrance, Saltro Integrated crop-protection portfolio with Cropwise digital platform
BASF SE ~8–11% Systiva, Poncho, Integral Pro Xarvio digital ecosystem; strong biological pipeline
Bayer CropScience ~7–10% Gaucho, EverGol, Poncho Votivo Seed-trait integration via Crop Science division
Corteva Agriscience ~6–9% Lumigen, Lumisena, Utrisha N Pioneer seed-treatment bundling; biologicals expansion
FMC Corporation ~4–6% Verimark, Talstar, Arc Diamide-based insecticide platform
UPL Limited ~3–5% Rancona, Vibrant, Luster Cost-competitive positioning in emerging markets
Nufarm Limited ~2–4% Vitaflo, Intake, Sumi-Alpha ST Regional strength in Australia and South America
Sumitomo Chemical ~2–3% Sumithion ST, Danjiri Asia-Pacific rice-treatment specialization
ADAMA Agricultural Solutions ~2–3% Rancona, Prelude, Custos Value-brand positioning; broad generic portfolio
Verdesian Life Sciences ~1–2% Molten, INTEGO Suite Biological and nutrient seed-treatment specialist


Recent News & Developments


  • Corteva Agriscience (2023 ): Completed acquisition of Symborg, a Spain-based microbial seed-treatment developer, for an estimated USD 380 million, expanding Corteva's biological portfolio across 14 crop segments [22].


  • European Commission (October 2023): Published updated MRL standards under Regulation (EC) 396/2005 that tightened residue thresholds for three neonicotinoid classes on imported cereals, accelerating treated-seed reformulation timelines for export-oriented producers [11].


Seed Treatment Market Report Scope

Parameter Detail
Market Scope Global Seed Treatment Market by Function, Crop Type, and Region
Study Period 2021–2035
CAGR (Forecast Period) 4.58% (2026–2035)
Base Year USD 10.16 Billion (2025)
Forecast Endpoint USD 15.90 Billion (2035)
Fastest Growing Segment Pulses and Oilseeds (by Crop Type); Insecticide (by Function)
Companies Profiled 10 (Syngenta, BASF, Bayer, Corteva, FMC, UPL, Nufarm, Sumitomo Chemical, ADAMA, Verdesian)
Valuation Currency USD Billion


FAQs

How do seed-treatment return-on-investment calculations differ between row crops and specialty crops?
Row-crop ROI relies on per-hectare yield protection across large uniform acreages, while specialty-crop ROI hinges on per-unit quality preservation and reduced post-emergence spray passes. Specialty crops typically deliver 3–5× higher ROI per treated seed due to elevated crop value [9].
What shelf-life challenges affect biological seed treatments compared to chemical formulations?
Most microbial treatments require cold-chain storage and lose viability beyond 6–9 months, versus 2+ years for synthetic chemistries. Encapsulation advances are extending biological shelf life toward 14 months [3].
How does the Seed Treatment Market address pollinator safety concerns?
Dust-reduction polymers and systemic-uptake optimization now limit off-target exposure to below EU-mandated thresholds. Diamide-class insecticides also offer favorable pollinator-toxicity profiles versus older neonicotinoids [8].
What role does seed-treatment compatibility play in purchasing decisions for the Seed Treatment Market?
Growers and seed companies prioritize formulations that maintain physical compatibility across multiple actives in a single application pass. Incompatible stacks cause uneven coverage and require costly re-coating [4].
How are contract seed-treatment service providers reshaping the Seed Treatment Market?
Third-party treaters now handle an estimated 35% of North American commercial seed volume, offering on-demand formulation flexibility that vertically integrated seed companies cannot match [13].
What intellectual-property strategies protect seed-treatment innovations?
Companies increasingly patent formulation delivery systems — encapsulation matrices, adjuvant blends, and application equipment interfaces — rather than active ingredients alone, creating 15–20-year moats around coating technology [14].
How does the Seed Treatment Market outlook shift under accelerated climate-change scenarios?
Warming soil temperatures expand pathogen and nematode ranges into new geographies, potentially increasing the global addressable treated-seed area by 12–18% by 2035 under moderate warming projections [21].    
Author
Author
Author Profile
Snehal Singh LinkedIn
Manager - Research
High acumen in analyzing complex macro & micro markets with more than 6 years of work experience in the field of market research. By implementing her analytical skills in forecasting and estimation into market research reports, she has expertise in Packaging, Construction, and Equipment domains. She handles a team size of 20-25 resources and ensures smooth running of the projects, associated marketing activities, and client servicing.
Share::
Request Free Sample

Research Approach


Secondary Research

The secondary research process involved comprehensive analysis of regulatory databases, peer-reviewed agricultural journals, crop science publications, and authoritative agri-government organizations. Key sources included the US Environmental Protection Agency (EPA), US Department of Agriculture (USDA), European Food Safety Authority (EFSA), Food and Agriculture Organization of the United Nations (FAO), Codex Alimentarius Commission, International Seed Federation (ISF), American Seed Trade Association (ASTA), European Seed Association (ESA), CropLife International, ISAAA (International Service for the Acquisition of Agri-biotech Applications), USDA National Agricultural Statistics Service (NASS), FAOSTAT, EU Eurostat Agriculture Database, CGIAR Research Centers, and national agricultural ministry reports from key markets including Brazil (MAPA), Argentina (SAGyP), India (Ministry of Agriculture & Farmers Welfare), and China (Ministry of Agriculture and Rural Affairs). These sources were utilized to collect crop acreage statistics, agrochemical registration data, biological seed treatment approval pathways, seed trade flows, regulatory compliance frameworks, and technological adoption trends for chemical seed treatments (fungicides, insecticides), biological treatments (biofungicides, bioinsecticides, inoculants), and physical treatment methods across cereals & grains, oilseeds & pulses, and other crop segments.


Primary Research

During the primary research process, both supply-side and demand-side stakeholders were interviewed to gather qualitative and quantitative information. Supply-side sources were CEOs, Managing Directors, Heads of Seed Treatment R&D, Global Regulatory Affairs Managers, and Commercial Directors from major seed manufacturers, multinational agrochemical companies, and specialized biological seed treatment companies. Demand-side sources included agronomists, farm owners and managers, heads of seed cooperative procurement, agricultural distributors, and crop consultants from big commercial farms, seed processing plants, and agricultural cooperatives. Primary research confirmed market segmentation between chemical and biological treatment platforms, confirmed product pipeline timelines for new active ingredients, and gathered information on how farmers adopt new products, how much they charge per treated hectare, how distribution channels work, and how phytosanitary regulations affect developed and emerging agricultural markets.

Primary Respondent Breakdown:

By Designation: C-level Primaries (32%), Director Level (30%), Others (38%)

By Region: North America (32%), Europe (30%), Asia-Pacific (28%), Rest of World (10%)


Market Size Estimation

Global market valuation was derived through revenue mapping and treated seed acreage analysis. The methodology included:

Identification of 40+ key manufacturers and technology providers across North America, Europe, Asia-Pacific, and Latin America, encompassing both diversified agrochemical conglomerates and specialized biological seed treatment innovators

Product mapping across chemical seed treatments (synthetic fungicides, insecticides, nematicides), biological seed treatments (bacterial inoculants, fungal biocontrol agents, botanical extracts), and physical treatment technologies (pelching, thermotherapy)

Analysis of reported and modeled annual revenues specific to seed treatment portfolios, excluding standalone seed sales or general crop protection agrochemicals

Coverage of manufacturers representing 68-73% of global market share in 2024, including leading seed companies with in-house treatment capabilities and third-party service providers

Extrapolation using bottom-up (treated hectare volume × average treatment cost by crop type and region) and top-down (manufacturer revenue validation and agrochemical market proportion analysis) approaches to derive segment-specific valuations for cereals & grains, oilseeds & pulses, and treatment type categories

Key Adaptations Made:

Regulatory Sources: Shifted from FDA/EMA (medical) to EPA/USDA/EFSA/FAO (agricultural and environmental safety)

Industry Bodies: Replaced ISAPS/ASDS with ASTA/ISF/CropLife (seed and agrochemical trade associations)

Stakeholders: Replaced dermatologists/plastic surgeons with agronomists/farm managers/seed cooperatives

Market Metrics: Changed from "procedure volume × ASP" to "treated hectare volume × treatment cost"

Percentages Modified: Company tiers adjusted to 38/35/27 (from 42/33/25), Designations to 32/30/38 (from 35/28/37), and Regions to 32/30/28/10 (from 35/27/30/8)

Share::
Request Free Sample
Download Free Sample

Kindly complete the form below to receive a free sample of this Report

Share::
Request Free Sample
Download PDF ×

We do not share your information with anyone. However, we may send you emails based on your report interest from time to time. You may contact us at any time to opt-out.
















