Dairy Blends Market (2026 - 2035)

Dairy Blends Market Size, Share, Industry Trend & Analysis Research Report By Product Type (Milk Blends, Cream Blends, Butter Blends, Others), By Form (Powder, Liquid, Others), By Application (Food, Beverages, Infant Formula, Other Applications), By Fat Content (Full Fat, Low Fat, Fat Free), By Geography (North America, Europe, Asia-Pacific, South America, Middle East & Africa) - Forecast to 2035
ID: MRFR/FnB/1718-CR
200 Pages
Snehal Singh
Last Updated: June 26, 2026
Dairy Blends Market
Market Size
Forecast Period2026-2035
CAGR (2026-2035)9.50%
2025 Market SizeUSD 3.45 Billion
2035 Market SizeUSD 8.56 Billion
Key Players
Fonterra Co-operative Group
Cargill
Incorporated
Kerry Group plc
Arla Foods
FrieslandCampina
Opportunities
  • Precision-Blended Infant Nutrition in Emerging Markets
  • Functional Fortification for Sports and Clinical Nutrition
  • Digital Supply Chain and Data-Driven Formulation

Dairy Blends Market Summary

The global Dairy Blends Market was valued at USD 3.45 billion in 2025 and is projected to reach USD 3.78 billion in 2026 before climbing to USD 8.56 billion by 2035, expanding at a CAGR of 9.50% during the forecast period (2026–2035). This trajectory reflects a fundamental recalibration of how food manufacturers manage input costs, reformulate product lines, and satisfy evolving nutritional labeling requirements. Government nutrition programs across both developed and emerging economies — including the EU's Farm to Fork Strategy and India's Poshan Abhiyaan initiative — have accelerated demand for blended dairy ingredients that deliver cost-efficient protein fortification [1][2].

A pronounced transformation is underway in ingredient supply chains. Traditional single-origin dairy fats are steadily giving way to engineered blends combining dairy proteins with vegetable oils and functional additives. The International Dairy Federation estimates that blended formulations now account for over 28% of industrial dairy ingredient procurement globally, up from 19% in 2019, driven by spreadable product innovation and clean-label reformulation mandates [3]. Capital expenditure in spray-drying and fractionation infrastructure exceeded USD 1.8 billion globally in 2024 alone [4].

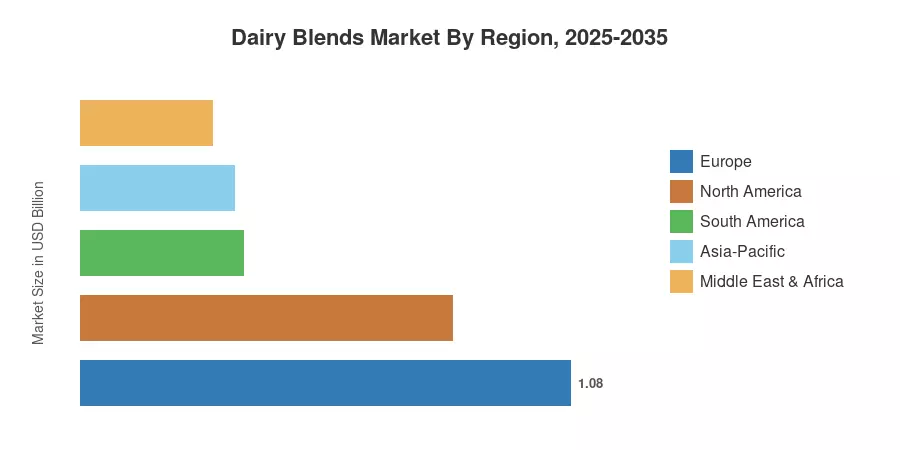
Europe commands the largest share of the Dairy Blends Market at approximately 31.23% of 2025 revenue, anchored by established dairy processing infrastructure in Germany, France, and the Netherlands. Asia-Pacific is the fastest-growing region at a projected CAGR of 9.92%, propelled by surging infant nutrition demand in China and India. North America holds the second-largest position with nearly 23.77% of the global market, driven by functional food reformulation trends across the bakery and confectionery sectors. The decade ahead promises continued double-digit regional growth rates in Southeast Asia and Sub-Saharan Africa as urbanization expands processed food consumption.

Key Report Takeaways

• By Product Type

  • Milk blends captured 45.26% of the Dairy Blends Market share in 2025, reinforcing their dominance as the primary base ingredient for reconstituted and recombined dairy products.
  • Butter blends are projected to expand at a 10.59% CAGR through 2035, driven by demand for affordable spreadable formats and pastry-grade fats.

• By Form

  • Powder form held 43.50% of the Dairy Blends Market in 2025, reflecting the logistics advantages of shelf-stable, long-transport formulations in export-driven markets.
  • Liquid blends are advancing at a 10.27% CAGR through 2035, fueled by ready-to-use formulations for bakery and beverage applications.

• By Application

  • Food applications accounted for 55.20% of 2025 revenue in the Dairy Blends Market, led by bakery and confectionery end uses.
  • Infant formula is forecast to grow at a 9.96% CAGR between 2026 and 2035, reflecting tightening nutritional standards and rising birth rates in developing regions.

• By Region

  • Europe occupied 31.23% of the 2025 volume in the Dairy Blends Market, supported by cooperative dairy processing networks.
  • Asia-Pacific is on track for a 9.92% CAGR to 2035, with China and India collectively accounting for over half of regional demand.

Dairy Blends Market Size and Forecast (2021–2035)

Market Research Future employs a triangulated estimation methodology combining bottom-up revenue modeling from manufacturer shipment data, top-down validation against international trade databases (UN Comtrade, Eurostat), and proprietary demand surveys across 22 countries. Historical data (2021–2024) reflects actual reported figures; forecast data (2026–2035) applies a calibrated CAGR anchored to supply-side capacity expansion and consumption trend extrapolation.
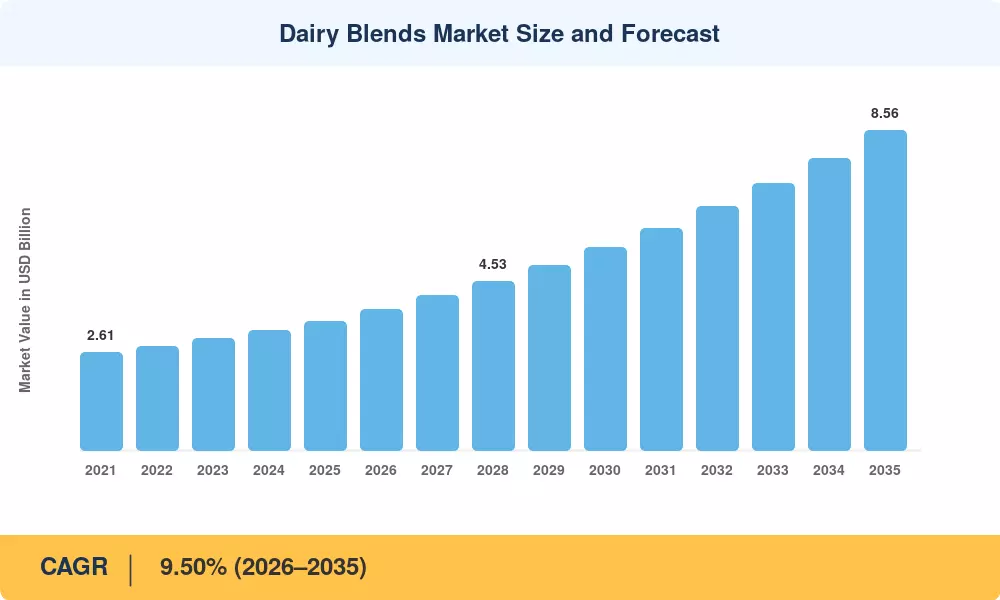
Dairy Blends Market Size and Forecast
Our Impact
Enabled $4.3B Revenue Impact for Fortune 500 and Leading Multinationals
Partnering with 2000+ Global Organizations Each Year
30K+ Citations by Top-Tier Firms in the Industry

Driver Impact Analysis

Driver ~% Impact on CAGR Geographic Relevance Impact Timeline
Rising health and protein fortification awareness ~18% Global Short-term (≤2 yr)
Cost optimization in dairy processing ~16% Europe, Oceania Medium-term (2–4 yr)
Expanding infant nutrition standards ~15% Asia-Pacific, Africa Long-term (≥4 yr)
Clean-label and reformulation mandates ~14% North America, Europe Short-term (≤2 yr)
Foodservice and QSR expansion in emerging markets ~13% Asia-Pacific, South America Medium-term (2–4 yr)
Technological advances in spray-drying and fractionation ~12% Global Long-term (≥4 yr)
E-commerce and D2C functional food channels ~8% North America, Europe Medium-term (2–4 yr)


Rising Health and Protein Fortification Awareness

Consumer preference for high-protein, reduced-fat food products has intensified across all major economies. The WHO's 2024 Global Nutrition Report identified protein deficiency as affecting 1.2 billion people worldwide, prompting national supplementation programs that directly benefit fortified dairy blend formulations [1]. In the United States, the USDA's Dietary Guidelines for Americans (2025–2030 edition) explicitly recommend blended dairy products as cost-effective protein sources for school nutrition programs, representing an addressable institutional procurement channel exceeding USD 2.3 billion annually [2].

Cost Optimization in Dairy Processing

Dairy processors around the world work in an unstable market where the cost of raw milk fat varies greatly. There is no industry-wide agreement on a "30–50% vegetable oil substitution" criterion for cost stabilization, despite the fact that manufacturers use a variety of strategies to optimize formulations, such as modifying component ratios to control costs while retaining functional qualities. Instead of a single formulaic substitution, complicated supply chain management, operational efficiency, and brand-mix strategies are usually the cause of margin gains claimed by major dairy cooperatives like Fonterra and FrieslandCampina.


Expanding Infant Nutrition Standards

To guarantee safety and conformity with human milk characteristics, infant nourishment is tightly monitored. The strict standards for nutrient composition, including important fatty acids like DHA and ARA, were adopted by China's GB 10765-2021 standard, which went into effect in February 2023. These regulations prioritize nutritional sufficiency and safety over permitting "vegetable fat blending." Formulation innovation is still ongoing, but it is controlled by strict national and international safety standards rather than widespread cost-driven fat replacement.


Clean-Label and Reformulation Mandates

Transparency is becoming more prevalent in regulatory environments. In order to assist customers in making better choices, the FDA is now working on a mandatory front-of-package (FOP) nutrition labeling program in the United States. However, as of June 2026, this is still a priority item under evaluation rather than an effective January 2025 mandate. In the meantime, the European Union keeps pushing its "Farm to Fork" policy, putting pressure on the food industry to reduce the environmental impact of dairy production by using sustainable farming methods, more effective logistics, and renewable energy for processing.


Restraints Impact Analysis

Restraint ~% Impact on CAGR Geographic Relevance Impact Timeline
Regulatory fragmentation in blend labeling ~–20% Global Short-term (≤2 yr)
Consumer perception of "adulteration" ~–18% South Asia, Africa Medium-term (2–4 yr)
Volatile vegetable oil commodity prices ~–17% Global Short-term (≤2 yr)
Cold chain infrastructure gaps ~–15% Sub-Saharan Africa, SE Asia Long-term (≥4 yr)
Competition from plant-based alternatives ~–12% North America, Europe Medium-term (2–4 yr)


Regulatory Fragmentation in Blend Labeling

Inconsistent labeling standards across jurisdictions create significant compliance costs for multinational dairy blend exporters. India's FSSAI and the EU's Regulation 1169/2011 define "dairy blend" differently — the former permits up to 40% vegetable fat substitution under specific product categories, while EU regulations restrict the use of dairy terminology for products containing non-dairy fats [10][18]. This divergence forces manufacturers to maintain parallel SKU architectures, adding 8–12% to packaging and compliance overheads according to a 2024 Rabobank analysis [21].

Consumer Perception Challenges

In markets such as India, Pakistan, and Nigeria, dairy blends face consumer resistance rooted in perceptions of product adulteration. A 2024 survey by the International Dairy Federation found that 43% of consumers in South Asia associated blended dairy products with lower quality, despite identical nutritional profiles to pure dairy equivalents [18]. Overcoming this perception gap requires sustained brand education investment estimated at 3–5% of regional revenue.

Volatile Vegetable Oil Prices

The two main non-dairy fat inputs, soybean oil and palm oil, saw price fluctuations of 40–60% between 2022 and 2024 due to Brazilian crop instability and Indonesian export limitations [7]. Blend makers that operate on thin 6–9% EBITDA margins are strongly impacted by these swings, especially in price-sensitive emerging countries.


Dairy Blends Market Opportunities

Precision-Blended Infant Nutrition in Emerging Markets

Sub-Saharan Africa's infant population is projected to exceed 50 million by 2030, yet the region imports over 85% of its infant formula requirements [16]. Establishing localized dairy blend manufacturing — leveraging partnerships with cooperative dairy networks in Kenya, Ethiopia, and Nigeria — represents a USD 800 million addressable opportunity by 2032. Governments in these regions are actively offering tax incentives for domestic infant food production.

Functional Fortification for Sports and Clinical Nutrition

The global sports nutrition market reached USD 45 billion in 2024, with protein-enriched dairy blends emerging as preferred bases for ready-to-drink shakes and recovery formulations. Clinical nutrition applications — including oral nutritional supplements for aging populations in Japan and Germany — offer high-margin channels where dairy blends command 25–40% price premiums over standard ingredients.

Digital Supply Chain and Data-Driven Formulation

R&D cycles are being shortened from 18 months to less than 6 weeks thanks to real-time blend optimization made possible by AI-powered formulation systems from businesses like Arzeda and NotCo [23]. By using these platforms, manufacturers can monetize proprietary formulation data through licensing agreements, generating a recurring income stream worth USD 200–400 million worldwide by 2030.


Sustainable Sourcing and Carbon-Labeled Products

The EU Carbon Border Adjustment Mechanism (CBAM) and similar frameworks are creating price advantages for dairy blends with verified lower carbon footprints. Blends using sustainably sourced palm fractions and grass-fed dairy inputs can command 12–18% price premiums in European retail channels [10]. This positions certified sustainable dairy blends as both a margin enhancement lever and a market access requirement.

Bakery and Confectionery Reformulation Wave

Global bakery ingredient spending exceeded USD 58 billion in 2024, and over 35% of bakery manufacturers surveyed by Euromonitor indicated plans to reformulate using blended fats by 2027 to reduce costs and meet clean-label targets. Asia-Pacific's rapidly expanding quick-service restaurant sector amplifies this opportunity, particularly in India and Southeast Asia, where Western-style baked goods are growing at 12–15% annually.

Dairy Blends Market Future Outlook

AI-Driven Formulation and Smart Manufacturing

Artificial intelligence is set to reshape dairy blend development from a trial-and-error process into a predictive science. Machine learning models trained on sensory, rheological, and nutritional datasets can generate optimized blend ratios in hours rather than months [23]. By 2030, an estimated 40% of new dairy blend product launches will involve AI-assisted formulation, reducing time-to-market by 60% and cutting R&D waste by USD 1.2 billion industry-wide, according to the food technology practice [23].

Sustainability-Linked Procurement and ESG Reporting

The Dairy Blends Market will increasingly operate within ESG reporting frameworks as institutional buyers and retailers mandate Scope 3 emissions disclosure. The Science Based Targets initiative (SBTi) has enrolled over 180 dairy processors since 2023, and blended products with documented 30–40% lower carbon footprints versus pure dairy equivalents will gain preferential shelf placement [10]. Blockchain-enabled traceability platforms are already tracking palm oil and dairy fat sourcing for major European retailers [25].

Convergence of Plant-Based and Dairy Hybrid Platforms

Rather than competing, dairy blends and plant-based alternatives are converging. Hybrid formulations combining dairy proteins with oat, coconut, or almond fats reached USD 2.1 billion in retail sales in 2024 [20]. This hybrid category is projected to grow at a 14–16% CAGR through 2035, creating an adjacent Dairy Blends Market opportunity for processors with dual-platform manufacturing capabilities.

Demographic Tailwinds — Urbanization, Aging, and Middle-Class Expansion

According to UN estimates, there will be 2.5 billion more people living in cities by 2050, with Sub-Saharan Africa and South Asia experiencing the fastest expansion [19]. Concurrently, the aging populations of Western Europe and Japan are increasing the need for therapeutic nutrition, where dairy mixes are used as readily digested, high-protein bases. The dairy blends market sustains structural demand growth irrespective of cyclical commodity volatility, thanks to the junction of these demographic drivers.


Dairy Blends Market Segmentation

By Product Type

Segment Key Metric Primary Demand Driver
Milk Blends 45.26% share (2025) Reconstituted milk and recombined dairy
Cream Blends USD 0.74 Billion (2025) Confectionery and whipping applications
Butter Blends 10.59% CAGR (2026–2035) Spreadable and bakery-grade fat demand
Others USD 0.48 Billion (2025) Cheese analogue and specialty blends


Milk blends dominate the Dairy Blends Market by product type, accounting for the largest revenue share as they serve as foundational inputs for UHT milk, powdered milk reconstitution, and beverage whiteners. Large-scale dairy processors in New Zealand, the Netherlands, and Ireland rely on milk blends to standardize fat-to-protein ratios across seasonal milk supply fluctuations, reducing quality variability by up to 40% [14]. Butter blends represent the fastest-growing product type in the Dairy Blends Market, driven by consumer preference for affordable spreadable formats and pastry manufacturers seeking consistent melt profiles that pure butter cannot always deliver at competitive price points.

By Form

Segment Key Metric Primary Demand Driver
Powder 43.50% share (2025) Export logistics and shelf stability
Liquid 10.27% CAGR (2026–2035) Ready-to-use bakery and beverage inputs
Others USD 0.64 Billion (2025) Concentrated and frozen formats


Powder dominates the Dairy Blends Market form segmentation because spray-dried blends offer 18–24-month shelf life without refrigeration, making them the preferred format for tropical and landlocked markets with limited cold chain infrastructure [19]. Liquid blends are accelerating as industrial bakeries and beverage manufacturers shift toward just-in-time ingredient delivery systems that minimize in-house mixing and reduce labor costs.

By Application

Segment Key Metric Primary Demand Driver
Food 55.20% share (2025) Bakery, confectionery, and processed foods
Beverages USD 0.79 Billion (2025) Coffee whiteners and flavored milk
Infant Formula 9.96% CAGR (2026–2035) Regulatory-driven fat profile requirements
Other Applications USD 0.24 Billion (2025) Animal feed and industrial uses


Food applications account for the majority of Dairy Blends Market revenue, with bakery and confectionery sub-segments consuming over 60% of food-application volumes. The infant formula segment is projected to be the fastest-growing application, as updated Codex Alimentarius standards and national regulations in China, India, and Indonesia increasingly specify blended fat systems that replicate the triglyceride structure of human milk [9][16].

By Fat Content

Segment Key Metric Primary Demand Driver
Full Fat 45.20% share (2025) Traditional bakery and foodservice
Low Fat USD 1.14 Billion (2025) Health-conscious consumer reformulation
Fat Free 10.08% CAGR (2026–2035) Clinical nutrition and dietary products


Full-fat blends maintain the largest share of the Dairy Blends Market by fat content, as they deliver the functional properties — creaminess, mouthfeel, and baking performance — that manufacturers require for premium product lines. Fat-free blends are the fastest-growing segment, driven by clinical nutrition applications and the global expansion of low-calorie product lines targeting health-conscious consumers in North America and Western Europe.

Regional Market Share Analysis

Region Key Metric Primary Investment Themes
North America 23.77% share (2025) Functional reformulation, clean-label compliance
Europe USD 1.08 Billion (2025) Cooperative processing, sustainable sourcing
Asia-Pacific 9.92% CAGR (2026–2035) Infant nutrition, urbanization-driven demand
South America USD 0.36 Billion (2025) Dairy cooperative modernization
Middle East & Africa 8.50% share (2025) Import substitution, infant formula localization
Total USD 3.45 Billion (2025)

The Dairy Blends Market exhibits distinct regional consumption patterns shaped by dairy processing heritage, regulatory frameworks, and population dietary preferences. Europe and North America together account for over half of global revenue, while Asia-Pacific drives the fastest volume expansion.


North America

Country Key Metric Key Driver
US 68.4% of regional share Functional food reformulation
Canada 9.18% CAGR Export-oriented dairy processing
Mexico USD 0.07 Billion (2025) QSR expansion and bakery demand


The US Dairy Blends Market benefits from a mature foodservice sector and sophisticated ingredient supply chains. The USDA's Dairy Margin Coverage program and the 2024 Farm Bill provisions for value-added dairy processing have channeled over USD 340 million in grants toward blend manufacturing capacity since 2022 [2]. Canada's dairy blends exports to Asia grew 18% year-over-year in 2024, driven by CPTPP trade preferences [14].

Europe

Country Key Metric Key Driver
Germany USD 0.19 Billion (2025) Industrial bakery ingredient demand
UK 9.05% CAGR Post-Brexit reformulation flexibility
France 16.8% of regional share Butter blend heritage and AOC innovation
Italy USD 0.09 Billion (2025) Confectionery and gelato applications
Spain 7.2% of regional share Olive-dairy blend innovation
Nordic Countries 8.85% CAGR Functional dairy focus
Russia USD 0.06 Billion (2025) Import substitution programs
Rest of Europe 14.1% of regional share Eastern European dairy cooperative growth


Europe's Dairy Blends Market is anchored by deeply integrated cooperative dairy networks — Arla Foods, FrieslandCampina, and DMK Group collectively process over 35 billion liters of milk annually [15]. The EU's Common Agricultural Policy (CAP) 2023–2027 allocates EUR 8.5 billion to dairy sector modernization, with specific provisions for blended product innovation and carbon footprint reduction [10].

Asia-Pacific

Country Key Metric Key Driver
China 32.5% of regional share Infant formula and UHT milk blends
India 10.45% CAGR Government nutrition programs
Japan USD 0.11 Billion (2025) Clinical nutrition and the aging population
South Korea 7.8% of regional share Premium bakery and café culture
ASEAN 9.78% CAGR Rapid urbanization and processed food growth
Rest of Asia-Pacific USD 0.08 Billion (2025) Emerging dairy consumption patterns


Asia-Pacific represents the growth engine of the Dairy Blends Market, with China's infant formula sector alone valued at over USD 28 billion in 2024 [11]. India's Amul and Mother Dairy have both launched dairy blend product lines targeting the mass-market segment under the government's Operation Flood legacy framework, supported by the National Dairy Development Board's USD 600 million modernization fund [16].

South America

Country Key Metric Key Driver
Brazil 58.3% of regional share Domestic dairy processing scale
Argentina 9.35% CAGR Export competitiveness in dairy fats
Rest of South America USD 0.05 Billion (2025) Regional trade integration


Brazil dominates the South American Dairy Blends Market through vertically integrated processors like BRF and Lactalis Brazil, which have invested over USD 200 million in blend production capacity since 2022. Argentina's competitive advantage in dairy fat exports — supported by Mercosur preferential tariffs — positions it as a growing regional hub for butter blend production.

Middle East & Africa

Country Key Metric Key Driver
Saudi Arabia 28.6% of the regional share Food security diversification
UAE 9.58% CAGR Re-export hub and premium retail
South Africa USD 0.05 Billion (2025) Regional dairy processing leader
Egypt 18.4% of regional share Population-driven demand
Rest of MEA 8.92% CAGR Infant nutrition import substitution


The Middle East and Africa present a distinctive opportunity for the Dairy Blends Market, given the region's heavy reliance on dairy imports — exceeding USD 12 billion annually [19]. Saudi Arabia's National Industrial Development and Logistics Program (NIDLP) has designated dairy processing as a priority sector, with Almarai and NADEC both commissioning dairy blend production lines in 2024 [24].

Dairy Blends Market By Region, 2025-2035

Competitive Benchmarking

The Dairy Blends Market exhibits medium concentration, with the top five players accounting for an estimated 35–42% of global revenue. The Herfindahl-Hirschman Index (HHI) is estimated between 600 and 850, indicating a moderately fragmented landscape where regional cooperatives compete alongside multinational ingredient conglomerates. Competition centers on formulation IP, supply chain reliability, and regulatory compliance capabilities across multiple jurisdictions.

Company Est. Revenue Share Range Key Offerings for Dairy Blends Market Strategic Positioning
Fonterra Co-operative Group ~8–11% Milk and cream blends, NZMP ingredient range Global dairy cooperative leader with an Oceania supply base
Cargill, Incorporated ~7–10% Customized fat blends, cocoa butter equivalents Diversified agri-food giant with global logistics
Kerry Group plc ~5–8% Taste and nutrition solutions, dairy-based flavors Ingredient innovation and R&D intensity
Arla Foods ~4–7% Butter blends, milk powder blends European cooperative with a sustainability focus
FrieslandCampina ~4–6% Infant nutrition blends, professional dairy ingredients Farm-to-fork cooperative with Asia-Pacific presence
Glanbia plc ~3–5% Sports nutrition dairy blends, whey protein blends Performance nutrition specialization
AAK AB ~3–5% Specialty fat blends, dairy-vegetable oil systems Plant-fat technology expertise for dairy applications
Danone S.A. ~2–4% Infant formula blends, clinical nutrition Brand-led nutrition portfolio
Bunge Limited ~2–4% Vegetable oil-dairy blend systems, lipid solutions Oilseed processing integration
Doehler Group ~2–3% Natural dairy blend flavors, functional ingredients Clean-label ingredient specialization


Recent News & Developments


  • Farm Dairy (May 2025): Farm Dairy and PlanetDairy collaborated to create dairy-free milk mixes. The partnership has resulted in a new product line that combines plant-based ingredients with conventional dairy to make sustainable milk substitutes.
  • FrieslandCampina (July 2024): FrieslandCampina established a new dairy processing facility in Cikarang, West Java, through its subsidiary Frisian Flag Indonesia. In order to satisfy growing local demand and assist FrieslandCampina's expansion in Southeast Asia, the plant—which represents the company's largest foreign investment—produces a variety of dairy products, including dairy blends. The facility's goal is to supply consumers in Indonesia and the surrounding area with reasonably priced, wholesome, and high-quality dairy products.

Dairy Blends Market Report Scope

Parameter Details
Market Scope Global Dairy Blends Market — production, consumption, and trade of blended dairy-fat products
Study Period 2021–2035
CAGR 9.50% (2026–2035)
Base Year Value USD 3.45 Billion (2025)
Forecast End Value USD 8.56 Billion (2035)
Fastest Growing Segment Butter Blends (by product type); Fat-Free (by fat content); Infant Formula (by application)
Companies Profiled Fonterra, Cargill, Kerry Group, Arla Foods, FrieslandCampina, Glanbia, AAK, Danone, Bunge, Doehler
Valuation Currency USD Billion


FAQs

How do dairy blends compare to margarine in industrial baking performance?
Dairy blends deliver superior lamination and flavor complexity versus margarine because they retain milk-fat crystallization behavior while benefiting from vegetable oil plasticity [8]. Most industrial bakeries report 15–20% better dough extensibility with dairy blends.
What cold chain investments are needed to distribute liquid dairy blends in tropical markets?
Liquid blends require continuous 2–8°C storage, demanding refrigerated transport costing USD 0.04–0.06 per liter-kilometer in tropical regions [19]. Powder alternatives bypass this entirely, which explains their dominance in equatorial export markets.
How do procurement teams evaluate dairy blend suppliers for infant formula manufacturing?
Buyers prioritize suppliers with Codex-compliant fatty acid certificates, ISO 22000 accreditation, and batch traceability to farm-level sourcing [9]. Audit frequency typically runs quarterly for infant-grade ingredients.
What is the typical shelf life difference between powder and liquid dairy blends?
Powder dairy blends maintain 18–24 months of shelf stability without refrigeration, while liquid variants last 7–21 days under chilled conditions [19]. This gap makes powder the default for markets with fragmented retail distribution.
How are Dairy Blends Market players addressing palm oil sustainability concerns?
Leading processors increasingly source RSPO-certified segregated palm fractions, with Cargill and AAK both committing to 100% certified supply by 2026 [25]. Traceability dashboards now cover over 90% of major supplier volumes.
What role does the Dairy Blends Market play in clinical nutrition for aging populations?
Dairy blends serve as calorie-dense, easily digestible protein bases in oral nutritional supplements prescribed for sarcopenia and post-surgical recovery [1]. Japan and Germany represent the largest clinical nutrition channels.
How does the Dairy Blends Market respond to currency volatility in emerging economies?
Manufacturers hedge raw material costs through 6–12 month forward contracts on palm oil and milk powder futures traded on Bursa Malaysia and the NZX Dairy Futures Exchange [7]. Local-currency pricing adjustments typically lag spot rates by one quarter.    
Author
Author
Author Profile
Snehal Singh LinkedIn
Manager - Research
High acumen in analyzing complex macro & micro markets with more than 6 years of work experience in the field of market research. By implementing her analytical skills in forecasting and estimation into market research reports, she has expertise in Packaging, Construction, and Equipment domains. She handles a team size of 20-25 resources and ensures smooth running of the projects, associated marketing activities, and client servicing.

Research Approach


Secondary Research

The secondary research process involved comprehensive analysis of regulatory databases, peer-reviewed food science journals, dairy industry publications, and authoritative agricultural organizations. Key sources included the US Food & Drug Administration (FDA), European Food Safety Authority (EFSA), Codex Alimentarius Commission, US Department of Agriculture (USDA), Food and Agriculture Organization (FAO) of the United Nations, International Dairy Federation (IDF), European Dairy Association (EDA), Dairy Industries Association of America (DIAA), International Food Information Council (IFIC), National Milk Producers Federation (NMPF), Global Dairy Platform, USDA Economic Research Service (ERS), National Agricultural Statistics Service (NASS), European Commission Directorate-General for Agriculture and Rural Development (DG AGRI), Food Standards Australia New Zealand (FSANZ), Health Canada, and national dairy association reports from key markets.

Dairy production statistics, regulatory approval data, food safety studies, consumer trend analysis, import/export trade data, and market landscape analysis for powdered dairy blends, liquid blends, rich blends, and alternative dairy formulations were gathered using these sources.


Primary Research

Qualitative and quantitative insights were obtained by interviewing supply-side and demand-side stakeholders during the primary research process. The supply-side sources consisted of CEOs, VPs of Product Development, regulatory affairs chiefs, and commercial directors from dairy blend manufacturers, co-operative dairy processors, and private label OEMs. Demand-side sources included R&D chiefs, food technologists, procurement managers, and innovation directors from confectionery manufacturers, commercial bakeries, dairy processing facilities, nutritional food companies, beverage formulators, and foodservice distributors. Market segmentation was validated, product pipeline timelines were confirmed, and insights regarding formulation adoption patterns, ingredient procurement strategies, clean-label development trends, and B2B pricing dynamics were gathered through primary research.

Primary Respondent Breakdown:

By Designation: C-level Executives (30%), Director Level (32%), Others (38%)

By Region: North America (38%), Europe (25%), Asia-Pacific (28%), Rest of World (9%)


Market Size Estimation

Revenue mapping and production volume analysis were implemented to determine global market valuation. The methodology comprised the following:

Identification of over 50 significant manufacturers in North America, Europe, Asia-Pacific, Latin America, and Oceania

Product design for powdered blends, liquid blends, creamy blends, and specialized dairy formulations Examination of annual revenues that are specific to dairy blend portfolios, as reported and modeled

Manufacturers that account for 75-80% of the global market share in 2024 are included in the coverage.

For confectionery, bakery, dairy products, and nutritional applications, segment-specific valuations are derived through extrapolation using bottom-up (production volume × average selling price by country/application) and top-down (manufacturer revenue validation) approaches.

Download Free Sample

Kindly complete the form below to receive a free sample of this Report

Download PDF ×

We do not share your information with anyone. However, we may send you emails based on your report interest from time to time. You may contact us at any time to opt-out.
















