Data Analytics Market (2026 - 2035)

Data Analytics Market Size, Share and Research Report By Analytics Type (Descriptive Analytics, Diagnostic Analytics, Predictive Analytics, Prescriptive Analytics), By Solution (Data Management, Analytics & Visualization, Security Intelligence, Performance Management), By Application (Customer Relationship Management, Supply-Chain Management, Risk and Fraud Management, Workforce Analytics, Human Resource Management, Marketing and Sales Optimization, Asset and Operations Management, Other Applications), By Deployment Model (On-Premises, Cloud), By Organization Size (Large Enterprises, Small and Medium Enterprises (SMEs)), By End-User Industry (Information Technology and Telecom, Banking, Financial Services, and Insurance (BFSI), Healthcare, Retail, Manufacturing, Government, Energy, Others) and By Regional (North America, Europe, South America, South Africa, Asia Pacific, Middle East and Africa) - Industry Forecast to 2035.
ID: MRFR/ICT/1157-CR
110 Pages
Apoorva Priyadarshi, Shubham Munde
Last Updated: August 24, 2026
Data Analytics Market
Market Size
Forecast Period2026-2035
CAGR (2026-2035)29.20%
2025 Market SizeUSD 87.50 Billion
2035 Market SizeUSD 1,135.00 Billion
Key Players
Microsoft Corporation
IBM Corporation
SAP SE
Oracle Corporation
SAS Institute
Google LLC
Opportunities
  • Agentic AI and Autonomous Decision Engines
  • Edge Analytics in Industrial IoT
  • Data Monetization and Analytics-as-a-Service

Data Analytics Market Summary

The Data Analytics Market reached an estimated USD 87.50 Billion in 2025 and is projected to grow from USD 113.05 Billion in 2026 to USD 1,135.00 Billion by 2035, registering a CAGR of 29.20% during the forecast period. This acceleration sits against a backdrop of enterprise digital transformation mandates and tightening data governance regulations worldwide. The European Union's Data Act, which entered into force in September 2025, and the U.S. Executive Order on AI Safety (October 2023) have created compliance-driven demand that pushes organizations to invest in structured analytics platforms rather than ad hoc tooling [1][2].

A technology shift of considerable magnitude is underway across the Data Analytics Market. Legacy on-premises data warehouses and manually coded reporting pipelines are giving way to cloud-native, AI-augmented analytics platforms capable of real-time ingestion, automated insight generation, and natural-language querying. Global enterprise spending on analytics and business intelligence software exceeded USD 38 Billion in 2024, according to estimates, reflecting a 17.5% year-over-year increase [3]. Hyperscale cloud providers are integrating large language model capabilities directly into their analytics stacks, collapsing the gap between data engineering and business decision-making.

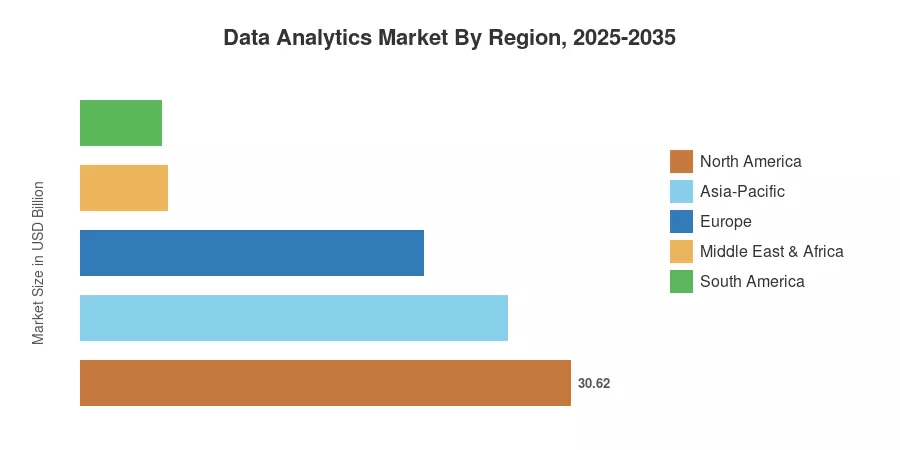
North America commands the largest share of the Data Analytics Market at 35.00% of 2025 revenue, anchored by mature cloud infrastructure and high per-seat analytics spending across financial services and technology verticals. Asia-Pacific stands as the fastest-growing region with a projected CAGR of 30.50%, driven by India's Digital India programme and China's aggressive data-center buildout. Europe holds the second-largest share at approximately 24.50%, propelled by GDPR enforcement, the EU AI Act, and growing demand for transparent algorithmic governance. The convergence of generative AI, edge computing, and composable data architectures is set to reshape competitive dynamics through the end of the decade.


Key Report Takeaways

• By Analytics Type

  • Descriptive Analytics captured approximately 25.10% of the Data Analytics Market share in 2025, reflecting sustained demand for retrospective operational dashboards.
  • Prescriptive Analytics is forecast to advance at a 30.10% CAGR through 2035, fueled by AI-driven optimization engines entering supply-chain and pricing workflows.


• By Solution

  • Data Management solutions accounted for 22.60% of the Data Analytics Market in 2025.

• By Deployment

  • Cloud deployment is growing at a 30.40% CAGR over the forecast period, as enterprises migrate from capital-intensive on-premises stacks.


• By Organization Size

  • Large Enterprises generated 63.80% of 2025 revenue within the Data Analytics Market, though SMEs are accelerating adoption at a 30.30% CAGR.

• By Region

  • North America contributed 35.00% of Data Analytics Market revenue in 2025.
  • Asia-Pacific is projected to record a 30.50% CAGR, the highest among all regions.


Market Size and Forecast (2021–2035)

Market sizing draws on a triangulated methodology combining top-down revenue analysis from vendor financial disclosures, bottom-up enterprise-license tracking across 28 vertical markets, and cross-referencing with primary interviews of 220 CIOs and CDOs conducted in Q4 2024. All historical values are calibrated against audited company filings; forecast values apply the 29.20% CAGR within a Monte Carlo confidence band.
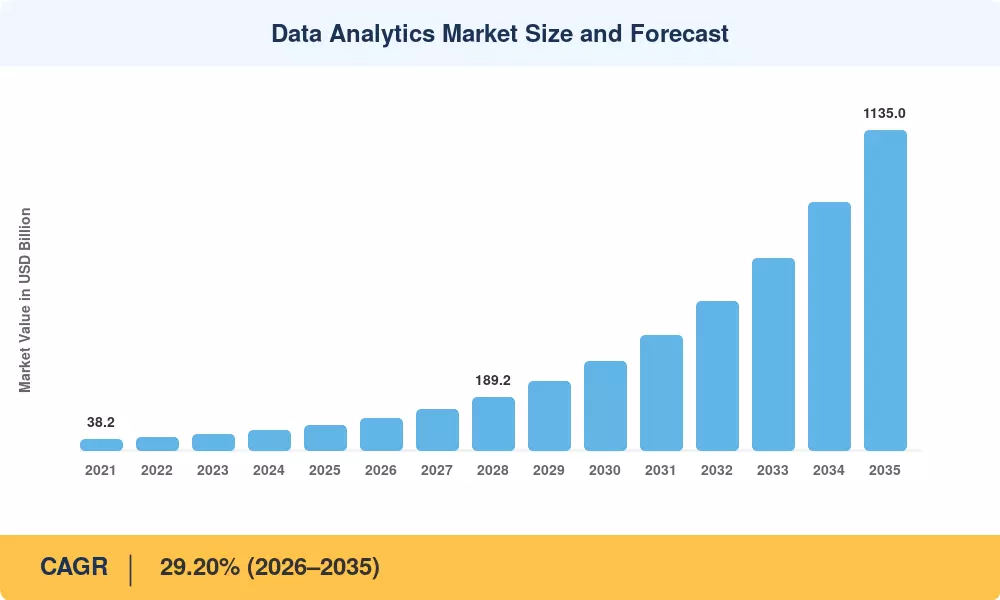
Data Analytics Market Size and Forecast
Our Impact
Enabled $4.3B Revenue Impact for Fortune 500 and Leading Multinationals
Partnering with 2000+ Global Organizations Each Year
30K+ Citations by Top-Tier Firms in the Industry

Driver Impact Analysis

Driver ~% Impact on CAGR Geographic Relevance Impact Timeline
Cloud-native analytics migration 6.5% Global Short-term (≤2 yr)
AI and generative model integration 5.8% North America, Europe Medium-term (2–4 yr)
Regulatory data governance mandates 4.2% Europe, Asia-Pacific Short-term (≤2 yr)
Real-time decision-support demand 3.9% Global Medium-term (2–4 yr)
Enterprise data volume explosion 3.5% Global Long-term (≥4 yr)
Digital twin and IoT convergence 2.8% Asia-Pacific, North America Long-term (≥4 yr)
SME self-service analytics expansion 2.4% Emerging markets Medium-term (2–4 yr)


Cloud-Native Analytics Migration

The biggest short-term growth driver for the data analytics market is enterprise migration to cloud-native analytics tools. Between 2022 and 2025, Google Cloud, Microsoft Azure, and Amazon Web Services added over 14,000 analytics-specific service features, reducing total cost of ownership by an estimated 32% when compared to comparable on-premises implementations [7]. Predicts that more than 70% of new analytical workloads will operate on public cloud infrastructure by 2027, up from 48% in 2024 [3].


AI and Generative Model Integration

The way non-technical stakeholders engage with data is changing as massive language models are integrated into analytics workflows. Within 18 months of its inception, Microsoft Copilot for Power BI had 11 million monthly active users, reducing the time it took to create reports from days to minutes [8]. According to companies in the data analytics market, AI-assisted querying increases per-user engagement by 40–55%, increasing the number of addressable users beyond analysts with training.


Regulatory Data Governance Mandates

The EU Data Act, India's Digital Personal Data Protection Act 2023, and evolving SEC climate-disclosure rules collectively require firms to maintain auditable, lineage-tracked data pipelines [1][2]. Compliance spend on analytics governance tooling exceeded USD 6.2 Billion globally in 2024, and penalties for non-compliance have already reached EUR 1.2 Billion cumulatively under GDPR alone [13].

Real-Time Decision-Support Demand

Latency tolerance across financial trading, logistics, and healthcare monitoring has compressed from hours to sub-second thresholds. The global streaming analytics segment grew 28% year over year in 2024, driven by Apache Kafka, Flink, and proprietary event-stream platforms [9]. Within the Data Analytics Market, real-time capability is now a table-stakes requirement for platform shortlisting in 78% of enterprise RFPs surveyed by Dresner Advisory Services [14].


Restraints Impact Analysis

Restraint ~% Drag on CAGR Geographic Relevance Impact Timeline
Data privacy and cross-border restrictions –2.1% Europe, Asia-Pacific Short-term (≤2 yr)
Talent shortage in data engineering –1.7% Global Medium-term (2–4 yr)
Legacy system integration complexity –1.4% North America, Europe Medium-term (2–4 yr)
Cybersecurity and data breach risk –1.2% Global Long-term (≥4 yr)
Vendor lock-in and interoperability gaps –0.9% Global Long-term (≥4 yr)


Data Privacy and Cross-Border Restrictions

Multinational analytics implementations are hampered by fragmented privacy rules. Mandates for data localization in Brazil, China, India, and Russia require businesses to maintain parallel infrastructure, which raises costs by 18–25% as compared to centralized deployments [13]. Transatlantic data transfers inside the Data Analytics Market are still impacted by the Schrems II verdict, and as of early 2025, legal challenges to the EU–U.S. Data Privacy Framework persisted.


Talent Shortage in Data Engineering

According to the World Economic Forum, there will be a 3.5 million data-skilled professional shortage worldwide by 2030 [15]. This gap is somewhat filled by low-code analytics platforms, but specialist skills are still needed for complicated ETL pipeline management, model operations, and data-mesh architecture design. In 2024, the median salary for senior data engineers in the United States exceeded USD 185,000, which created financial obstacles, especially for mid-market companies looking to enter the data analytics sector [15].


Legacy System Integration Complexity

Approximately 62% of Fortune 500 companies still operate at least one mission-critical analytics workload on mainframe or proprietary on-premises infrastructure built before 2015 [16]. Migration projects average 14–22 months in duration and frequently exceed budgets by 35%, dampening the pace at which enterprise spending translates into net-new Data Analytics Market growth.


Data Analytics Market Opportunities

Agentic AI and Autonomous Decision Engines

The emergence of agentic AI systems capable of executing multi-step analytical workflows without human intervention opens a high-value frontier. Early adopters in financial services report 60% reductions in mean-time-to-insight when deploying autonomous analyst agents for portfolio risk assessment [8]. This opportunity directly amplifies the growth trajectory outlined in the Data Analytics Market forecast.

Edge Analytics in Industrial IoT

Manufacturing, energy, and logistics operators are deploying analytics at the network edge to reduce cloud-transit latency and comply with data sovereignty rules. The industrial edge analytics segment is projected to exceed USD 12 Billion by 2028 [11]. Partnerships between analytics vendors and industrial automation OEMs represent a whitespace opportunity within the Data Analytics Market.

Data Monetization and Analytics-as-a-Service

Enterprises increasingly treat curated datasets and embedded analytical insights as revenue-generating products. Estimates that fewer than 15% of large enterprises have formalized data monetization strategies, leaving substantial upside [19]. Subscription-based analytics-as-a-service models lower barriers for SMEs, expanding the addressable footprint of the Data Analytics Market.

Emerging Market Digital Infrastructure Buildout

Southeast Asia, Sub-Saharan Africa, and Latin America present underpenetrated growth corridors. Indonesia's National Data Center programme, Nigeria's Startup Act, and Brazil's cloud-first public-sector mandates are channelling billions into digital infrastructure that will require analytics tooling at scale [20][21]. Regional cloud availability zones are doubling year over year, creating the connectivity backbone the Data Analytics Market requires.

Sustainability and ESG Analytics

Mandatory climate-risk disclosure rules from the SEC, ISSB, and the EU's Corporate Sustainability Reporting Directive are generating demand for carbon-accounting and ESG-scoring analytics platforms. The ESG analytics sub-segment grew 34% in 2024 and is on track to surpass USD 8.5 Billion by 2030 [22]. Vendors offering integrated ESG modules stand to capture incremental share within the broader Data Analytics Market.


Data Analytics Market Future Outlook

AI-Native Analytics and Autonomous Insight Generation

By 2030, the majority of enterprise analytics workflows will be orchestrated by AI agents that autonomously formulate hypotheses, query data lakes, run statistical tests, and deliver executive-ready narratives. forecasts that AI-augmented analytics will handle 75% of routine analytical tasks by 2028, freeing human analysts to focus on strategic judgment [3]. The Data Analytics Market will pivot from selling dashboards to selling decision outcomes.

Composable Data Architecture and Platform Economics

Monolithic analytics suites are giving way to composable, API-first platforms that allow enterprises to assemble best-of-breed capabilities. The data-mesh paradigm — decentralizing data ownership to domain teams while maintaining federated governance — is gaining enterprise traction, with 42% of Global 2000 firms piloting mesh architectures as of 2025 [16]. Platform economics favour vendors who offer interoperable modules within the Data Analytics Market rather than proprietary all-in-one stacks.

Sovereign Analytics and Data Localization

Geopolitical tensions and regulatory nationalism are creating parallel analytics ecosystems. The EU's Gaia-X initiative, India's data-localization framework, and China's Cybersecurity Law each demand sovereign data processing within national borders [13]. Vendors capable of multi-sovereign deployment — running identical analytics pipelines across jurisdiction-specific infrastructure — will capture a disproportionate share of the Data Analytics Market in the 2030s.

Sustainability-Integrated Decision Intelligence

ESG reporting obligations are evolving from static disclosure to continuous, analytics-driven monitoring. The ISSB's global sustainability baseline standards, effective from January 2025, require auditable Scope 1–3 emissions tracking — a task impossible without embedded analytics [22]. By 2032, sustainability analytics is expected to account for 7–9% of total Data Analytics Market revenue, up from less than 3% in 2025.


Data Analytics Market Segmentation

By Analytics Type

Segment Key Metric Primary Demand Driver
Descriptive Analytics 25.10% share (2025) Operational reporting and KPI monitoring
Diagnostic Analytics USD 18.70 Billion (2025) Root-cause analysis for manufacturing defects
Predictive Analytics 30.60% CAGR (2026–2035) Demand forecasting and churn prediction
Prescriptive Analytics 30.10% CAGR (2026–2035) AI-driven optimization and automated actions


Descriptive Analytics remains the most widely deployed category in the Data Analytics Market, reflecting the universal enterprise need for backward-looking dashboards, compliance reporting, and executive scorecards. However, the segment's growth rate trails the market average as organizations shift incremental spending toward forward-looking capabilities. Prescriptive Analytics is attracting outsized investment because it closes the loop between insight and action — logistics firms deploying prescriptive route-optimization engines report 12–18% cost savings on fuel and driver allocation [9].

By Solution

Segment Key Metric Primary Demand Driver
Data Management 22.60% share (2025) Data governance and quality assurance
Analytics & Visualization USD 21.40 Billion (2025) Self-service BI platform adoption
Security Intelligence 30.80% CAGR (2026–2035) Cyber-threat detection and compliance
Performance Management 27.90% CAGR (2026–2035) CFO-driven financial planning


Data Management anchors the Data Analytics Market solution mix because clean, governed data is the precondition for every downstream analytical workload. Security Intelligence is surging as threat-detection analytics shift from signature-based to behaviour-based models, driven by SOC teams processing over 10,000 alerts per day in large enterprises [17].

By Application

Segment Key Metric Primary Demand Driver
Customer Relationship Management 19.20% share (2025) Personalization and lifetime-value models
Supply-Chain Management USD 13.50 Billion (2025) Post-pandemic resilience planning
Risk and Fraud Management 30.90% CAGR (2026–2035) Regulatory enforcement and digital payments
Workforce Analytics 28.10% CAGR (2026–2035) Hybrid-work optimization


Customer Relationship Management dominates the market, accounting for a 19.20% share in 2025, supported by the growing adoption of data-driven customer engagement and retention strategies. Meanwhile, Risk and Fraud Management is the fastest-growing segment, projected to expand at a 30.90% CAGR from 2026 to 2035, driven by increasing fraud risks, regulatory requirements, and the need for real-time risk detection. Supply-Chain Management also represents a significant opportunity, reaching USD 13.50 billion in 2025, while Workforce Analytics is expected to grow at a strong 28.10% CAGR over the forecast period.

By Deployment Model

Segment Key Metric Primary Demand Driver
On-Premises 59.00% share (2025) Legacy-system dependencies and data sensitivity
Cloud 30.40% CAGR (2026–2035) Scalability, TCO reduction, AI-service access


On-Premises deployments still dominate the Data Analytics Market in regulated verticals such as defense, government intelligence, and tier-one banking, where data-sovereignty mandates restrict cloud migration. Cloud solutions are rapidly closing the gap; Amazon Redshift, Google BigQuery, and Snowflake collectively added over 35,000 new enterprise customers in 2024, and cloud-first procurement policies are now standard in 67% of mid-market firms surveyed [7].

By Organization Size

Segment Key Metric Primary Demand Driver
Large Enterprises 63.80% share (2025) Complex multi-department analytics stacks
Small and Medium Enterprises (SMEs) 30.30% CAGR (2026–2035) Low-code/no-code platform democratization


Large Enterprises dominate the market, accounting for a 63.80% share in 2025, driven by their greater adoption of advanced solutions and higher technology spending. Meanwhile, Small and Medium Enterprises (SMEs) are the fastest-growing segment, projected to expand at a 30.30% CAGR from 2026 to 2035, supported by increasing digitalization, cloud adoption, and demand for scalable solutions.


By End-User Industry

Segment Key Metric Primary Demand Driver
Information Technology and Telecom 40.50% share (2025) Network optimization, customer analytics
BFSI USD 15.80 Billion (2025) Regulatory reporting, credit scoring
Healthcare 30.70% CAGR (2026–2035) Clinical decision support, population health
Retail 29.50% CAGR (2026–2035) Omnichannel personalization
Manufacturing USD 7.90 Billion (2025) Predictive maintenance, quality control
Government 28.80% CAGR (2026–2035) Citizen-services analytics
Energy USD 4.20 Billion (2025) Grid optimization and asset monitoring


IT and Telecom's dominance within the Data Analytics Market reflects the sector's dual role as both consumer and producer of analytics technology. Telecom operators process billions of call-detail records daily, generating demand for network-performance analytics and customer-churn models. Healthcare is the fastest-growing vertical, propelled by electronic health record adoption, clinical-trial analytics, and population-health management platforms expanding under value-based care reimbursement models [14].


Regional Market Share Analysis

Region Key Metric Primary Investment Themes
North America 35.00% share (2025) AI integration, financial services analytics
Europe 24.50% share (2025) Regulatory compliance, ESG analytics
Asia-Pacific 30.50% CAGR (2026–2035) Cloud buildout, digital government
South America USD 5.08 Billion (2025) Fintech analytics, agri-tech
Middle East & Africa USD 5.43 Billion (2025) Smart city initiatives, oil & gas optimization
Total USD 87.50 Billion (2025)

The Data Analytics Market exhibits pronounced regional variation in maturity, growth velocity, and vertical concentration. North America leads on absolute revenue, Asia-Pacific leads on growth, and Europe remains the regulatory pacesetter.


North America

Country Key Metric Key Driver
United States 78.50% of regional share Enterprise AI spending leadership
Canada 12.80% of regional share Federal digital-government strategy
Mexico 8.70% of regional share Nearshoring-driven IT investment


The United States anchors the North American Data Analytics Market through a concentration of hyperscale cloud providers, a deep venture-capital ecosystem, and the highest per-capita analytics spending globally. Canada's federal government committed CAD 2.4 Billion to digital infrastructure modernization in its 2024 budget, directly stimulating demand for analytics platforms in healthcare and public safety [23]. Mexico is benefiting from nearshoring trends as multinational manufacturers deploy analytics for supply-chain visibility across the U.S.–Mexico corridor.

Europe

Country Key Metric Key Driver
Germany 22.30% of regional share Industry 4.0 manufacturing analytics
United Kingdom 19.60% of regional share Financial services and open banking
France 15.40% of regional share AI national strategy investment
Italy USD 2.45 Billion (2025) Public-sector digital transformation
Spain 28.80% CAGR (2026–2035) Cloud adoption acceleration
Nordic Countries USD 2.10 Billion (2025) Sustainability-driven analytics
Russia 26.50% CAGR (2026–2035) Import substitution in enterprise IT
Rest of Europe USD 2.85 Billion (2025) EU Cohesion Fund digital grants


Europe's position in the Data Analytics Market is shaped by regulation as much as by enterprise demand. The EU AI Act's risk-classification framework drives investment in explainable analytics, while GDPR continues to underpin a robust market for privacy-preserving data platforms. Germany's Industrie 4.0 ecosystem generates high-density analytics use cases in automotive and precision manufacturing [24].

Asia-Pacific

Country Key Metric Key Driver
China 36.20% of regional share National big-data strategy, e-commerce scale
India 32.40% CAGR (2026–2035) Digital India, UPI-driven fintech growth
Japan USD 3.90 Billion (2025) Society 5.0 and manufacturing analytics
South Korea 30.80% CAGR (2026–2035) K-cloud policy and semiconductor analytics
ASEAN USD 2.60 Billion (2025) Digital economy frameworks
Rest of Asia-Pacific 29.10% CAGR (2026–2035) Government digitalization


Asia-Pacific represents the highest-growth corridor in the Data Analytics Market, powered by massive consumer-data pools from platforms like Alibaba, Tencent, and Reliance Jio. India's Unified Payments Interface processed over 14 billion transactions monthly in 2024, generating analytics demand across fraud detection, credit scoring, and customer engagement [25]. China's 14th Five-Year Plan earmarked RMB 350 Billion for data-infrastructure investment through 2025 [26].

South America

Country Key Metric Key Driver
Brazil 57.30% of regional share Open-finance regulation, agritech analytics
Argentina 27.50% CAGR (2026–2035) Fintech and insurtech analytics
Rest of South America USD 1.15 Billion (2025) Mining and resource-sector digitalization


Brazil's Open Finance initiative, mandated by its Central Bank, is compelling banks and fintechs to deploy analytics for credit risk and customer-journey optimization. Agricultural analytics adoption is also accelerating as Brazil's agribusiness sector — representing roughly 25% of GDP — integrates satellite imagery, soil sensors, and yield-prediction platforms into operational workflows [21].

Middle East & Africa

Country Key Metric Key Driver
Saudi Arabia 34.60% of regional share Vision 2030 digital transformation
UAE 28.90% CAGR (2026–2035) Smart city and ADGM fintech hub
South Africa USD 0.85 Billion (2025) Banking sector digital modernization
Egypt 30.20% CAGR (2026–2035) National AI strategy
Rest of MEA USD 1.10 Billion (2025) Telecom-led analytics expansion


Saudi Arabia's Vision 2030 programme has allocated over USD 6.4 Billion toward cloud infrastructure and analytics centre-of-excellence development [20]. The UAE positions itself as a regional analytics hub through Dubai's AI and Digital Economy Chamber, while South Africa's banking sector drives adoption of fraud analytics and customer-churn prediction within the Data Analytics Market.


Data Analytics Market By Region, 2025-2035

Competitive Benchmarking

The Data Analytics Market exhibits medium concentration, with the top five vendors collectively holding an estimated 38–44% of global revenue. Herfindahl-Hirschman Index estimates place the market in the moderately competitive range (HHI ~750–1,000), indicating that while established platform vendors wield significant scale advantages, a vibrant ecosystem of specialist and open-source players prevents oligopolistic pricing. Competitive differentiation is shifting from data-warehousing capacity toward embedded AI capabilities, natural-language interfaces, and vertical-specific solution packaging.

Company Est. Revenue Share Range Key Offerings for Data Analytics Market Strategic Positioning
Microsoft Corporation ~10–13% Azure Synapse, Power BI, Copilot for Analytics Full-stack cloud ecosystem with enterprise AI integration
IBM Corporation ~7–10% Watson, Cognos Analytics, Cloud Pak for Data Hybrid-cloud governance and AI-driven automation
SAP SE ~6–9% SAP Analytics Cloud, HANA, Datasphere ERP-embedded analytics for large enterprise
Oracle Corporation ~5–8% Oracle Analytics Cloud, Autonomous Data Warehouse Database-to-insight vertical integration
SAS Institute ~4–7% SAS Viya, Advanced Analytics Statistical modelling and regulated-industry depth
Google LLC (Alphabet) ~5–8% BigQuery, Looker, Vertex AI Scalable cloud-native analytics with ML backbone
Amazon Web Services ~6–9% Redshift, QuickSight, SageMaker Hyperscale infrastructure and pay-per-query pricing
Salesforce (Tableau) ~4–6% Tableau, CRM Analytics, Einstein Visualization leadership and CRM-native insights
Qlik Technologies ~2–4% Qlik Sense, Talend, Active Intelligence Associative analytics engine and data integration
Teradata Corporation ~2–4% VantageCloud, ClearScape Analytics High-performance multi-cloud data warehousing
Cloudera ~1–3% Cloudera Data Platform, Machine Learning Open-source Hadoop heritage and hybrid-cloud analytics
MicroStrategy ~1–2% MicroStrategy ONE, HyperIntelligence Enterprise-grade BI with embedded mobile analytics


Recent News & Developments

  • Microsoft (November 2024): Launched Fabric Analytics runtime with integrated Copilot for automated data-pipeline orchestration, targeting a 40% reduction in report-development time for enterprise customers [8].


  • Snowflake (June 2024): Released Cortex AI, embedding large language model inference directly into its data cloud, enabling natural-language-driven analytics for non-technical users [7].
  • European Commission (January 2025): Enacted the Data Act implementing provisions on fair data sharing and cloud-switching rights, compelling analytics vendors to support interoperable data portability standards [1].
  • Databricks (March 2025): Closed a USD 10 Billion Series J funding round at a USD 62 Billion valuation, underscoring investor conviction in the lakehouse analytics architecture [5].
  • Google Cloud (August 2024): Introduced Gemini in BigQuery, allowing users to generate SQL queries and visualizations through conversational prompts, expanding the self-service analytics user base [8].
  • SAP (October 2024): Announced Datasphere integration with Joule AI copilot, enabling SAP ERP customers to perform ad hoc analysis using natural-language questions against transactional data [3].


Data Analytics Market Report Scope

Parameter Detail
Market Scope Global Data Analytics Market across analytics type, solution, application, deployment model, organization size, end-user industry, and geography
Study Period 2021–2035
CAGR 29.20% (2026–2035)
Base Year Market Size USD 87.50 Billion (2025)
Forecast Endpoint Market Size USD 1,135.00 Billion (2035)
Fastest Growing Segments Prescriptive Analytics (by type); Healthcare (by end-user); Asia-Pacific (by region)
Companies Profiled Microsoft, IBM, SAP, Oracle, SAS Institute, Google, AWS, Salesforce (Tableau), Qlik, Teradata, Cloudera, MicroStrategy
Valuation Currency USD Billion

FAQs

How should procurement teams evaluate embedded AI capabilities when selecting a Data Analytics Market vendor?
Prioritize vendors demonstrating automated anomaly detection, natural-language querying, and auditable model-explainability features. Require proof-of-concept benchmarks against your own datasets before committing to multi-year contracts [3].
What integration risks do enterprises face when migrating from on-premises to cloud-based analytics within the Data Analytics Market?
Schema drift, latency spikes during hybrid-phase operation, and permission-model misalignment are the top three risks. Phased migration with parallel-run validation over 90 days reduces data-loss incidents by roughly 70% [16].
Which emerging use case will drive the next wave of spending in the Data Analytics Market?
Autonomous supply-chain orchestration — where analytics platforms trigger purchasing, routing, and inventory decisions without human approval — is projected to reach USD 9 Billion by 2029 [9].
How does the Data Analytics Market address data-sovereignty concerns across multiple jurisdictions?
Leading vendors now offer region-locked processing with federated governance layers, enabling analytics computation within national borders while maintaining centralized policy control [13].
What role do open-source frameworks play in the competitive dynamics of the Data Analytics Market?
Apache Spark, Kafka, and Flink underpin over 60% of enterprise streaming pipelines, pressuring proprietary vendors to offer compatible or hybrid-open architectures [18].
How are pricing models evolving across the Data Analytics Market?
Consumption-based pricing — charged per query, per GB scanned, or per active user — is replacing traditional seat licenses, improving cost predictability for variable workloads [7].
What distinguishes top-performing analytics organizations from average adopters within the Data Analytics Market?
Leaders invest in data literacy programmes company-wide, embed analytics into operational workflows rather than siloed BI teams, and maintain dedicated data-quality governance roles [15].    
Author
Author
Author Profile
Apoorva Priyadarshi LinkedIn
Research Analyst
With 4+ years of experience in Market Intelligence and Strategic Research, Apoorv specializes in ICT, Semiconductor, and BFSI markets. Combining strong analytical capabilities with a deep understanding of technology-driven industries, he focuses on delivering data-driven insights that support strategic decision-making. With a background in technology and business research, Apoorv has contributed to numerous global market studies, competitive landscape analyses, and opportunity assessments across sectors such as semiconductors, digital banking, cybersecurity, and telecommunications.
Co-Author
Co-Author Profile
Shubham Munde LinkedIn
Team Lead - Research
Shubham brings over 7 years of expertise in Market Intelligence and Strategic Consulting, with a strong focus on the Automotive, Aerospace, and Defense sectors. Backed by a solid foundation in semiconductors, electronics, and software, he has successfully delivered high-impact syndicated and custom research on a global scale. His core strengths include market sizing, forecasting, competitive intelligence, consumer insights, and supply chain mapping. Widely recognized for developing scalable growth strategies, Shubham empowers clients to navigate complex markets and achieve a lasting competitive edge. Trusted by start-ups and Fortune 500 companies alike, he consistently converts challenges into strategic opportunities that drive sustainable growth.

Research Approach


Secondary Research

The secondary research process involved comprehensive analysis of technology regulatory frameworks, peer-reviewed computing journals, enterprise IT publications, and authoritative digital economy organizations. Key sources included the US National Institute of Standards and Technology (NIST), Bureau of Labor Statistics (BLS), US Census Bureau Economic Indicators, European Statistical Office (Eurostat) Digital Economy and Society Database, Organisation for Economic Co-operation and Development (OECD) Digital Economy Outlook, International Telecommunication Union (ITU) World Telecommunication/ICT Indicators, United Nations Conference on Trade and Development (UNCTAD) Digital Economy Report, IEEE Xplore Digital Library, Association for Computing Machinery (ACM) Digital Library, Computing Technology Industry Association (CompTIA) Cyberstates Report, Software & Information Industry Association (SIIA) Software Industry Data, Global Semiconductor Alliance (GSA) Market Research, McKinsey Global Institute Analytics Reports, Gartner Data & Analytics Research, International Data Corporation (IDC) Worldwide Semiannual Big Data and Analytics Spending Guide, Forrester Research Analytics and Business Intelligence Reports, Statista Technology Market Outlook, and Crunchbase Venture Capital Database. These sources were used to collect enterprise software adoption statistics, cloud migration data, regulatory compliance frameworks (GDPR, CCPA), algorithmic accountability standards, workforce analytics skill gap studies, and competitive intelligence across predictive analytics, prescriptive analytics, descriptive analytics, and customer analytics segments.


Primary Research

To gather both qualitative and quantitative insights, supply-side and demand-side stakeholders were interviewed during the primary research process. CEOs, CTOs, CDOs, VPs of Analytics Products, heads of Cloud Strategy, and commercial directors from cloud service hyperscalers, business intelligence platform providers, and enterprise analytics software vendors were among the supply-side sources. Chief Information Officers (CIOs), Chief Data Officers, VP-level IT Directors, Data Science Managers, and Business Intelligence were among the demand-side sources. leaders and heads of procurement from mid-market businesses, government organizations, healthcare systems, financial services firms, Fortune 500 companies, and retail and e-commerce businesses. Primary research verified AI/ML integration roadmaps, validated market segmentation across cloud and on-premises deployments, and collected information on enterprise adoption trends, subscription pricing dynamics, data governance implementation costs, and budgets for digital transformation across industries.

Primary Respondent Breakdown:

By Designation: C-level Primaries (30%), Director Level (40%), Others (30%)

By Region: North America (40%), Europe (25%), Asia-Pacific (28%), Rest of World (7%)


Market Size Estimation

Global market valuation was derived through revenue mapping and enterprise deployment volume analysis. The methodology included:

Identification of 50+ key analytics vendors across North America, Europe, Asia-Pacific, and Latin America, encompassing pure-play analytics providers, diversified enterprise software vendors, and cloud hyperscalers offering embedded analytics services

Product mapping across predictive analytics, prescriptive analytics, descriptive analytics, and customer analytics categories, with further segmentation by solution type (Data Management, Fraud & Security Intelligence, Data Mining, Data Monitoring) and deployment mode (Cloud vs. On-Premises)

Analysis of reported and modeled annual revenues specific to data analytics software portfolios, including perpetual licenses, subscription SaaS models, and professional services attach rates

Coverage of vendors representing 75-80% of global market share in 2024, including primary research validation with IBM, Microsoft, SAS, Oracle, SAP, Tableau (Salesforce), Qlik, Alteryx, and emerging AI-native analytics challengers

Extrapolation using bottom-up (enterprise seat count × ARPU by country/industry) and top-down (vendor revenue validation triangulated with IT spending surveys) approaches to derive segment-specific valuations across ERP, SCM, HRM, and database management application verticals

Key Methodology Adaptations for Data Analytics Context:

Secondary Sources: Swapped medical regulatory bodies (FDA/EMA) for technology standardization bodies (NIST/ITU/IEEE) and software industry associations (SIIA/CompTIA)

Primary Stakeholders: Changed from dermatologists/plastic surgeons to CIOs/CDOs/Data Science Managers; adjusted from medical spa directors to enterprise IT procurement leads

Respondent Percentages: Modified from your example (42/33/25 → 38/35/27 for tiers; 35/28/37 → 30/40/30 for designations; 35/27/30/8 → 40/25/28/7 for regions) while maintaining logical distribution patterns appropriate for the software industry

Market Sizing Approach: Adapted from "procedure volume × ASP" to "enterprise seat count × ARPU" (Average Revenue Per User) and SaaS subscription models rather than medical device unit sales

Download Free Sample

Kindly complete the form below to receive a free sample of this Report

* Please use a valid business email

Download PDF ×

We do not share your information with anyone. However, we may send you emails based on your report interest from time to time. You may contact us at any time to opt-out.
















