Request Free Sample ×

Kindly complete the form below to receive a free sample of this Report

* Please use a valid business email

Leading companies partner with us for data-driven Insights

clients tt-cursor
Hero Background

Data Center Colocation Market

ID: MRFR/ICT/2688-HCR
100 Pages
Aarti Dhapte
Last Updated: May 28, 2026
Data Center Colocation Market Size, Share and Trends Analysis Report By Type (Retail Colocation, Wholesale Colocation), By Deployment Type (Cloud, On-Premises), By End-User (BFSI, IT and telecom, Government and Defense, Healthcare) And By Region (North America, Europe, Asia-Pacific, And Rest Of The World) –Market Forecast Till 2035.
Download PDF ×

We do not share your information with anyone. However, we may send you emails based on your report interest from time to time. You may contact us at any time to opt-out.


Market Summary

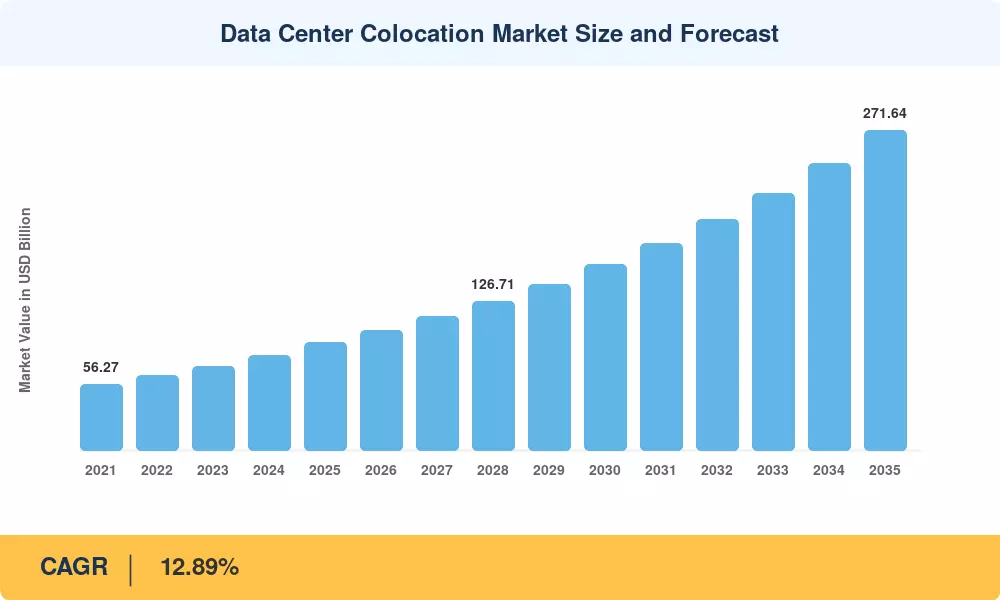
The Data Center Colocation Market stood at an estimated USD 91.38 billion in 2025, with the forecast period launching from USD 101.04 billion in 2026 and climbing to USD 271.64 billion by 2035 at a CAGR of 12.89%. Enterprises across finance, healthcare, and media are accelerating their exit from captive server rooms, driven by the sheer capital intensity of building AI-ready infrastructure in-house. Government-led data-sovereignty mandates in the European Union, India, and the Gulf Cooperation Council states have simultaneously compelled regulated workloads to remain within national borders, locking in multi-year colocation hosting for enterprise IT contracts that underpin predictable revenue for operators [2][3].

A structural technology shift is reshaping facility design. Legacy air-cooled racks rated at 5–8 kW are giving way to power density colocation solutions exceeding 40 kW per cabinet, a transformation fueled by GPU-dense AI training clusters and high-performance computing deployments. Operators that pre-install rear-door heat exchangers and direct-to-chip liquid-cooling loops can command 20–30% price premiums on long-term leases [4]. Global capital expenditure on colocation campus builds surpassed USD 45 billion in 2024, with hyperscalers pre-leasing capacity two to three years before facilities reach commercial operation [5].

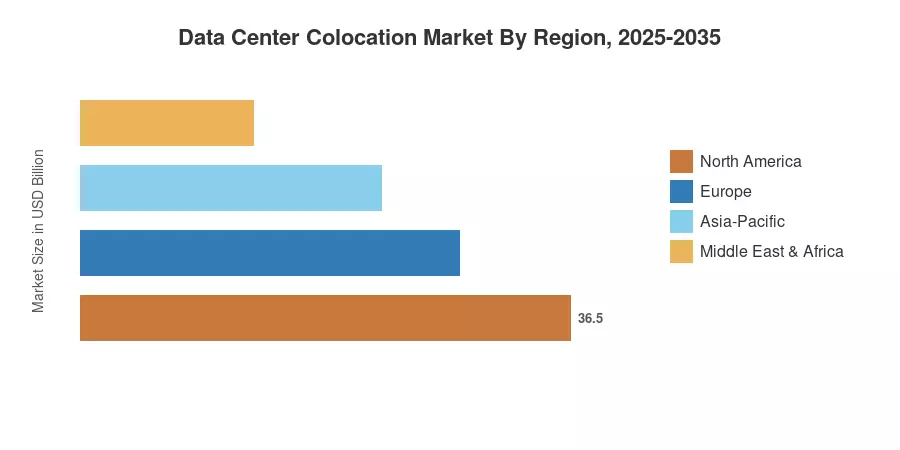
North America commanded roughly 43.8% of the Data Center Colocation Market in 2025, anchored by Northern Virginia's dense fiber ecosystem and carrier-neutral colocation facilities in Dallas, Chicago, and Phoenix. Asia-Pacific is set to register the fastest CAGR of 13.72% through 2035 as cloud adoption in India, Southeast Asia, and Japan accelerates. Europe held the second-largest share at approximately 26%, buoyed by Frankfurt, London, Amsterdam, and Paris — the so-called FLAP corridor — where cross-connect services in colo data centers remain a critical differentiator for financial-services tenants [6][7].


Key Report Takeaways

• By Solution Type

  • Retail multi-tenant halls captured an estimated 67.5% of the Data Center Colocation Market revenue in 2025, driven by SME and mid-enterprise demand for fractional-rack deployments
  • Wholesale multi-tenant suites are forecast to expand at a 13.35% CAGR through 2035, as hyperscaler pre-leasing fuels large-block absorption

• By Tier Classification

  • Tier 3 facilities accounted for roughly 49.8% of the Data Center Colocation Market share in 2025, reflecting the enterprise preference for concurrent maintainability without full fault tolerance costs
  • Tier 4 halls are projected to grow at a 13.58% CAGR, propelled by mission-critical financial and healthcare workloads requiring 99.995% uptime and robust data center colo pricing and SLA models

• By Region

  • North America generated approximately USD 40.03 billion in 2025, underpinned by the highest density of carrier-neutral colocation facilities globally
  • Asia-Pacific is expected to record the fastest regional CAGR of 13.72% to 2035, led by India's Digital India infrastructure push and Japan's AI-focused subsidy programs


Market Research Future (MRFR)'s sizing model triangulates bottom-up operator revenue data, top-down enterprise IT outsourcing spend surveys, and cross-referencing against hyperscaler capex disclosures. Historical figures draw on audited financial filings from the 15 largest publicly listed colocation providers, while forecast projections incorporate planned campus pipelines, utility interconnection queues, and contracted but uncommissioned capacity.

Market Size Chart
Our Impact
Enabled $4.3B Revenue Impact for Fortune 500 and Leading Multinationals
Partnering with 2000+ Global Organizations Each Year
30K+ Citations by Top-Tier Firms in the Industry
 

Driver Impact Analysis

Driver ~% Impact on CAGR Geographic Relevance Impact Timeline
Enterprise hybrid-cloud migration ~22% Global Short-term (≤2 yr)
AI / GPU-cluster power density colocation solutions ~20% North America, APAC Medium-term (2–4 yr)
Data-sovereignty and compliance mandates ~16% Europe, MEA, India Long-term (≥4 yr)
Carrier-neutral interconnection demand ~14% North America, Europe Short-term (≤2 yr)
Hyperscaler capacity pre-leasing ~12% Global Medium-term (2–4 yr)
Edge computing and 5G densification ~9% APAC, North America Long-term (≥4 yr)
Renewable energy and PPA-backed facilities ~7% Europe, Nordics Long-term (≥4 yr)


Enterprise Hybrid-Cloud Migration

The single biggest impetus for the Data Center Colocation Market is the migration from on-premise server rooms to hybrid-cloud architectures. According to IDC, 72% of organizations have a hybrid work paradigm for more than 1,000 people presently, growing from 58% in 2022. This migration routes workloads into carrier-neutral colocation facilities that provide AWS, Azure and Google Cloud on-ramps in the same meet-me room to reduce latency and egress costs. Three to five-year Enterprise IT colocation hosting contracts give operators the income visibility to support aggressive campus development [2].


AI and High-Density Power Requirements

A rack of GPUs for training big language models can easily consume 50-80 kW, considerably above the 6-10 kW that previous colo halls were built to accommodate. Investors in power density colocation using rear-door heat exchangers, in-row cooling, and direct liquid-cooling manifolds are taking a disproportionately large slice of new lease activity. For example, NVIDIA’s DGX SuperPOD reference architecture entails at least 100 kW per rack, and this demands colocation providers to refit or greenfield construct dedicated AI halls [4][11].


Data-Sovereignty Mandates

The EU’s Data Act, India’s Digital Personal Data Protection Act of 2023, and Saudi Arabia’s PDPL, among others, have stringent localization regulations that oblige regulated sectors to maintain data within the national borders. Such laws create structural demand for local colocation capacity and support attractive data center colo pricing and SLA models, as compliance-driven tenants pay a premium for jurisdictionally compliant facilities [9][10].


Carrier-Neutral Interconnection Demand

Colo data centers are increasingly being selected by financial services, gambling and content-delivery networks based on the breadth of cross-connect services. The most connected carrier hotels—like One Wilshire in Los Angeles—boast roughly 295 to 300+ distinct network providers in a single ‘’meet-me room’’.The network effect establishes a self-reinforcing demand cycle, which increases barriers to entry for newer operators [12].


Restraints Impact Analysis

The restraint percentages below are directional estimates of headwinds that temper the Data Center Colocation Market growth rate. They do not subtract linearly from the CAGR.

Restraint ~% Negative Impact on CAGR Geographic Relevance Impact Timeline
Utility power allocation caps ~–18% N. Virginia, Singapore, Dublin Short-term (≤2 yr)
Rising construction and land costs ~–15% Global Medium-term (2–4 yr)
Skilled workforce shortages ~–12% Europe, APAC Long-term (≥4 yr)
Grid carbon-intensity scrutiny ~–10% Europe, Nordics Medium-term (2–4 yr)
Hyperscaler self-build competition ~–8% North America Long-term (≥4 yr)


Utility Power Allocation Caps

Moratoriums and approval bottlenecks in Northern Virginia, Singapore and Dublin push new-capacity timetables to three or four years. Dominion Energy Virginia has an interconnection queue of more than 30 GW alone, extending project timelines and tightening near-term supplies. This constraint, albeit supporting price for incumbents, limits volumetric expansion in the most established metros and pushes operators to secondary markets such as Columbus, Phoenix and Johor Bahru [3][16].


Rising Construction Costs

The global cost of building mission essential facilities climbed almost 18 percent between 2022 and 2024, due to inflation of steel, copper and switchgear costs. This directly translates into increased per-megawatt build costs, compressing operator margins and extending return-on-investment timelines. Smaller colocation providers are under disproportionate pressure as they do not have the scale purchase agreements that top-tier operators negotiate for generators, UPS systems, and power density colocation solutions [16][17].


Hyperscaler Self-Build Programs


While Meta sits in the specific bracket (guided at $60–65 billion), Microsoft scaled to ~$80 billion and Google (Alphabet) reached ~$75 billion to support massive AI computing clusters. Every megawatt a hyperscaler develops in-house is a megawatt not rented from the Data Center Colocation Market. Yet the overall effect remains mild, with hyperscalers still using colocation for edge deployments, disaster recovery and geographies where speed to market trumps ownership economics


Opportunities

Liquid-Cooling-as-a-Service for AI Workloads

Operators packaging direct-to-chip liquid-cooling infrastructure as a managed service can ride the tide of corporations renting GPU clusters without wanting to engineer cooling themselves. This as-a-service layer turns capex into opex for tenants. It creates recurring revenue premiums of 25–35% over air-cooled leases – a clear monetization path in the Data Center Colocation Market [4].


Sovereign Cloud Zones in Emerging Markets

Countries such as Indonesia, Nigeria, Saudi Arabia and Brazil are proposing or passing data-residency legislation that will create greenfield demand for carrier-neutral colocation facilities within their borders. Operators who lock down land and utility feeds early for regulatory effective dates can lock in first-mover advantages and favorable data center colo pricing and SLA models with government tenants [9][10].


Sustainability-Linked Lease Structures

The ESG-aware company is demanding more and more carbon-neutral, power purchase agreement-backed facilities. Operators that can offer verifiable renewable-energy credits, onsite solar, or waste-heat recovery can gain 10–15% in lease premiums and obtain cheaper green-bond financing, widening the margins in colocation hosting for enterprise IT [15].


Edge Colocation for 5G and IoT

The growth of 5G small cells and IoT gateways is driving demand for micro-colocation pods in Tier-2 and Tier-3 cities. These 0.5–2 MW facilities support latency-sensitive applications such as autonomous vehicles, telemedicine and smart manufacturing, creating a new niche in the Data Center Colocation Market [14].


Data Monetization Through Interconnection Analytics

Operators at the nexus of hundreds of networks can provide anonymized traffic-flow data and latency benchmarking as value-added services. Cross-connect services in colo data centers generate metadata. When aggregated and anonymized, they can provide tenants with real-time network performance intelligence, a new revenue stream based on existing infrastructure and without further capital [12].


Future Outlook

AI-Driven Autonomous Facility Operations

By 2030, Market Research Future (MRFR) expects over 40% of large colocation campuses to deploy AI-based digital twins for real-time thermal management, predictive maintenance, and automated failover. These systems will reduce operational expenditure by 12–18% and improve power usage effectiveness scores from an industry average of 1.35 to below 1.20, strengthening operating margins across the Data Center Colocation Market [4].

Platform Economics and Marketplace Models

Colocation is evolving from a real-estate lease into a platform business. Operators are layering software-defined interconnection portals, bare-metal-as-a-service offerings, and automated provisioning APIs atop physical infrastructure. These digital layers deepen tenant lock-in and raise average revenue per cabinet, transforming cross-connect services in colo data centers from a side offering into a core margin driver [12].


Modular and Prefabricated Construction

To compress time-to-market from 24 months to under 12, operators are adopting factory-built modular data halls. Prefabrication reduces on-site labor requirements by up to 40%, directly addressing skilled-workforce shortages that constrain the Data Center Colocation Market in Europe and Asia-Pacific. Companies like Schneider Electric and Vertiv report modular order backlogs exceeding 18 months, signaling sustained demand for this construction methodology [16][17].


Market Segmentation

By Solution Type

Segment Key Metric Primary Demand Driver
Retail Multi-Tenant 67.5% share (2025) SME hybrid-cloud deployments
Wholesale Multi-Tenant 13.35% CAGR (2026–2035) Hyperscaler and large-enterprise pre-leasing


The Retail Multi-Tenant segment dominates the Data Center Colocation Market by revenue because it serves the broadest customer base — from single-rack startups to 50-cabinet mid-enterprise deployments. Tenants value the flexibility of month-to-month or one-year terms combined with shared carrier-neutral colocation facilities. Wholesale suites, by contrast, are growing faster in percentage terms because hyperscalers and large financial institutions lock in multi-megawatt blocks under five-to-ten-year take-or-pay leases, providing operators with bankable revenue streams that facilitate debt financing for new campus builds [5][13].

By Tier Classification

Segment Key Metric Primary Demand Driver
Tier 1 & 2 USD 14.17 Billion (2025) Cost-sensitive SME workloads
Tier 3 49.8% share (2025) Enterprise concurrent maintainability
Tier 4 13.58% CAGR (2026–2035) Mission-critical finance and healthcare


Tier 3 facilities hold the plurality of the Data Center Colocation Market because they strike the best balance between uptime guarantees and cost. Most enterprise workloads do not require the full 2N redundancy of Tier 4 but cannot tolerate the planned downtime inherent in Tier 1 and 2 designs. Tier 4 halls, however, are the fastest-growing classification as financial trading platforms and real-time healthcare analytics demand 99.995% availability backed by stringent data center colo pricing and SLA models [2].

By Facility Size

Segment Key Metric Primary Demand Driver
Small (< 5,000 sq ft) USD 7.89 Billion (2025) Edge and metro micro-colo
Medium (5,000–20,000 sq ft) 11.93% CAGR (2026–2035) Regional enterprise deployments
Large (20,000–100,000 sq ft) 53.7% share (2025) Multi-tenant campus operations
Hyperscale (> 100,000 sq ft) 13.48% CAGR (2026–2035) Cloud-provider pre-leases


Large data centers command the majority of the Data Center Colocation Market share because they offer the economies of scale necessary to support power density colocation solutions and extensive cross-connect services in colo data centers. Hyperscale campuses, meanwhile, are expanding at the fastest rate as cloud providers secure multi-hundred-megawatt commitments across strategic geographies [5][11].


Regional Market Share Analysis

Region Key Metric (2025) Primary Investment Themes
North America 43.8% share Hyperscaler pre-leasing, AI-ready campuses
Europe 26.0% share FLAP corridor expansion, data sovereignty
Asia-Pacific 13.72% CAGR (2026–2035) Cloud adoption, government digitization
South America USD 3.74 Billion Fintech growth, in-country compliance
Middle East & Africa USD 2.92 Billion Smart-city programs, sovereign cloud
Total USD 91.38 Billion

The Data Center Colocation Market exhibits pronounced geographic concentration, with North America and Europe collectively accounting for nearly 70% of global revenue. However, Asia-Pacific's rapid CAGR signals a structural rebalancing over the forecast horizon as power density colocation solutions proliferate across emerging digital economies [6][7].


North America

Country Key Metric Key Driver
United States 82.3% of regional share Northern Virginia, Dallas, Phoenix expansion
Canada 10.7% CAGR Toronto and Montreal AI cluster growth
Mexico USD 1.28 Billion Nearshoring manufacturing data demand


North America's dominance in the Data Center Colocation Market stems from the world's densest fiber backbone and the deepest pool of carrier-neutral colocation facilities. The US alone added over 1,200 MW of new capacity in 2024, with Virginia, Texas, and Arizona absorbing the bulk. Canada's Montreal corridor benefits from cheap hydroelectric power and a cold climate that lowers cooling costs, attracting AI-focused tenants. Mexico's Querétaro hub is emerging as a nearshore option for US enterprises seeking geographic redundancy [3][11].

Europe

Country Key Metric Key Driver
Germany 24.6% of regional share Frankfurt financial services interconnection
United Kingdom USD 4.72 Billion London Docklands and Slough campuses
France 11.8% CAGR Paris sovereign-cloud mandates
Italy USD 1.14 Billion Milan's digital transformation
Spain 10.9% CAGR Madrid cloud-region launches
Nordic Countries USD 2.65 Billion Renewable-energy surplus, cold climate
Russia 8.4% CAGR Domestic cloud substitution
Rest of Europe USD 2.18 Billion Warsaw, Bucharest emerging hubs


European colocation hosting for enterprise IT is shaped by the EU's evolving data regulations and the physical constraints of urban power grids. Frankfurt hosts the world's largest internet exchange (DE-CIX), making it Europe's premier hub for cross-connect services in colo data centers. The Nordic countries attract sustainability-conscious hyperscalers with near-100% renewable grids and ambient cooling advantages [7][9][15].

Asia-Pacific

Country Key Metric Key Driver
China 34.1% of regional share Domestic cloud giants, government data mandates
India 15.2% CAGR Digital India, data-residency laws
Japan USD 4.68 Billion AI subsidies, Tokyo/Osaka campus builds
South Korea 12.6% CAGR Semiconductor and gaming cloud demand
ASEAN USD 3.42 Billion Singapore, Jakarta, Johor Bahru growth
Rest of Asia-Pacific 11.8% CAGR Australia, New Zealand enterprise migration


Asia-Pacific represents the fastest-growing theater in the Data Center Colocation Market, driven by explosive cloud adoption and government-sponsored digitization programs. India alone is expected to add over 800 MW of colo capacity between 2025 and 2028, supported by the Digital India initiative and private investments from Adani, Reliance, and global operators [6][10].

South America

Country Key Metric Key Driver
Brazil 61.3% of regional share São Paulo financial hub, LGPD compliance
Argentina 10.4% CAGR Buenos Aires enterprise migration
Rest of South America USD 0.72 Billion Chile, Colombia cloud-region launches


Brazil's São Paulo metro anchors the South American segment, hosting the region's largest cluster of carrier-neutral colocation facilities. The Lei Geral de Proteção de Dados (LGPD) enforcement is prompting Brazilian banks and fintechs to shift from in-house server rooms to compliant colocation environments with auditable data center colo pricing and SLA models [10].

Middle East & Africa

Country Key Metric Key Driver
Saudi Arabia 30.5% of regional share NEOM, Vision 2030 digital infrastructure
UAE 12.8% CAGR Dubai Internet City, Abu Dhabi AI strategy
South Africa USD 0.51 Billion Johannesburg enterprise hub
Egypt 11.2% CAGR Cairo smart-city digitization
Rest of MEA USD 0.43 Billion Kenya, Morocco and emerging demand


The Middle East & Africa region is the smallest but among the fastest-emerging segments of the Data Center Colocation Market. Saudi Arabia's Vision 2030 earmarks substantial investment in digital infrastructure, and the kingdom's Personal Data Protection Law compels in-country data hosting, supporting demand for power density colocation solutions in Riyadh and Jeddah [9][10].


Regional Market Share
 

Competitive Benchmarking

The Data Center Colocation Market exhibits medium concentration, with the top five operators collectively holding an estimated 35–42% of global revenue. The Herfindahl-Hirschman Index sits in the 800–1,200 range, indicating a moderately competitive structure where scale advantages in power procurement, fiber density, and land banking create meaningful but not insurmountable barriers to entry. Regional specialists and niche carrier-neutral colocation facilities operators sustain competitive positions by serving localized compliance-driven demand.

Company Est. Revenue Share Range Key Offerings Strategic Positioning
Equinix ~12–16% Platform Equinix, Equinix Fabric, xScale Global interconnection leader
Digital Realty ~9–13% PlatformDIGITAL, ServiceFabric Wholesale and hybrid campus scale
NTT Global Data Centers ~5–8% Nexcenter platform, managed hosting Asia-Pacific and European reach
CyrusOne (KKR) ~3–5% Hyperscale build-to-suit, power density colocation solutions US enterprise and hyperscaler focus
QTS Realty (Blackstone) ~3–5% SDP, Freedom Hyperscale campus Mega-campus development
Vantage Data Centers ~2–4% Hyperscale campuses across NA, EMEA, APAC Rapid build-to-suit model
KDDI Telehouse ~2–3% Interconnection hubs, carrier-neutral halls Tokyo, London, and Paris density
Chindata Group ~2–3% Hyperscale campuses in China and APAC Low-cost renewable sites
Iron Mountain Data Centers ~1–3% Compliant data management, colocation hosting for enterprise IT Regulated-industry specialization
ST Telemedia Global Data Centers ~1–2% APAC and European campuses Sovereign and enterprise segments


Recent News & Developments


  • European Commission (March 2024): Adopted the Energy Efficiency Directive recast, requiring all data centers above 500 kW to report PUE and water usage effectiveness metrics starting January 2025, shaping colocation hosting for enterprise IT procurement criteria [9].


  • Iron Mountain (May 2024): Acquired a 40 MW operational colocation campus in Frankfurt, expanding its regulated-industry footprint in Europe's largest interconnection hub.


Report Scope

Item Detail
Market Scope Global Data Center Colocation Market — covers retail and wholesale multi-tenant colocation services.
Study Period 2021–2035
Historical Period 2021–2024
Base Year 2025
Forecast Period 2026–2035
CAGR (2026–2035) 12.89%
Market Size — 2025 USD 91.38 Billion
Market Size — 2035 USD 271.64 Billion
Fastest Growing Segment Hyperscale campuses (by facility size); Tier 4 (by tier classification)
Companies Profiled Equinix, Digital Realty, NTT, CyrusOne, QTS, Vantage, KDDI Telehouse, Chindata, Iron Mountain, STT GDC
Valuation Currency USD Billion
Methodology Triangulated bottom-up operator filings, top-down enterprise IT spend surveys, hyperscaler capex disclosures


FAQs

How should enterprises evaluate latency requirements when selecting a colocation provider in the Data Center Colocation Market?

Benchmark round-trip latency to your primary cloud on-ramps and end-user clusters before shortlisting sites. Facilities offering diverse carrier-neutral colocation facilities with in-building cloud exchanges typically deliver sub-1 ms latency to major platforms [12].

What contract structures best protect tenants against unexpected power-rate escalation?

Negotiate pass-through clauses with annual caps or fixed-rate power riders within your data center colo pricing and SLA models. Some operators offer blended PPA-backed tariffs that lock electricity costs for five to seven years [15].

How do liquid-cooling-ready halls in the Data Center Colocation Market differ from retrofit facilities?

Purpose-built halls integrate piping, manifolds, and coolant-distribution units into the slab design, supporting 50+ kW racks at commissioning. Retrofits typically cap at 30 kW per rack and require costly structural modifications [4].

What due diligence steps reduce counterparty risk when signing multi-year wholesale leases?

Review the operator's balance-sheet leverage, utility-interconnection permits, and construction-completion guarantees—creditworthy operators with investment-grade ratings or infrastructure-fund backing present lower delivery risk.

How do cross-connect services in colo data centers influence the total cost of ownership for financial services firms?

Direct physical cross-connects eliminate recurring transit fees and reduce latency by bypassing public internet hops. Firms with high-frequency trading or payment-processing workloads often recover cross-connect costs within six months [12].

What role does modular construction play in accelerating capacity delivery within the Data Center Colocation Market?

Factory-built modules compress delivery from 24 months to under 12 and reduce on-site labor by 40%. This approach is especially effective in markets facing skilled-trades shortages across Europe and Asia-Pacific [16].

How are sustainability-linked SLAs reshaping colocation hosting for enterprise IT procurement?

Operators now embed PUE targets, renewable-energy percentages, and water-usage caps directly into lease agreements. Tenants achieving verified ESG benchmarks can access preferential renewal terms and carbon-offset credits [15].


Author
Author
Author Profile
Aarti Dhapte LinkedIn
AVP - Research
A consulting professional focused on helping businesses navigate complex markets through structured research and strategic insights. I partner with clients to solve high-impact business problems across market entry strategy, competitive intelligence, and opportunity assessment. Over the course of my experience, I have led and contributed to 100+ market research and consulting engagements, delivering insights across multiple industries and geographies, and supporting strategic decisions linked to $500M+ market opportunities. My core expertise lies in building robust market sizing, forecasting, and commercial models (top-down and bottom-up), alongside deep-dive competitive and industry analysis. I have played a key role in shaping go-to-market strategies, investment cases, and growth roadmaps, enabling clients to make confident, data-backed decisions in dynamic markets.

Research Approach


Secondary Research

The secondary research process involved comprehensive analysis of regulatory filings, industry databases, technical publications, and authoritative telecommunications and data center organizations. Key sources included the US Federal Communications Commission (FCC), National Institute of Standards and Technology (NIST), Uptime Institute, International Data Corporation (IDC), Synergy Research Group, Structure Research, Cloud Infrastructure Services Providers in Europe (CISPE), European Data Centre Association (EUDCA), Asia Cloud Computing Association (ACCA), Telecommunications Industry Association (TIA), ANSI/TIA-942 Standards Committee, International Organization for Standardization (ISO) for ISO/IEC 27001 and ISO 50001 certifications, US Energy Information Administration (EIA) for power consumption data, EU Eurostat Digital Economy and Society Database, ITU World Telecommunication/ICT Indicators Database, national telecom regulatory authorities (Ofcom UK, ARCEP France, Bundesnetzagentur Germany), US Department of Energy Better Buildings Initiative, Singapore Infocomm Media Development Authority (IMDA), Japan Ministry of Internal Affairs and Communications, India Ministry of Electronics and Information Technology (MeitY), and China Ministry of Industry and Information Technology (MIIT). These sources were utilized to collect data center capacity statistics, certification standards, power usage effectiveness metrics, cloud adoption trends, regulatory compliance frameworks, and competitive landscape analysis for retail colocation, wholesale colocation, cloud deployment, and on-premises infrastructure segments.


Primary Research

In the primary research process, qualitative and quantitative insights were obtained by interviewing supply-side and demand-side stakeholders. Supply-side sources included CEOs, Chief Technology Officers, VPs of Data Center Operations, heads of Network Engineering, and heads of Sustainability & Energy Management from colocation providers, hyperscale operators, and data center infrastructure vendors. Demand-side sources included Chief Information Officers, Chief Digital Officers, IT Directors, Cloud Architects, and Procurement Heads from BFSI institutions, telecom operators, government agencies, healthcare systems, and large enterprises.

Primary research validated market segmentation across colocation types (retail vs. wholesale), confirmed data center construction pipelines and power capacity expansions, and gathered insights on multi-cloud adoption patterns, interconnection strategies, power pricing dynamics, and sustainability compliance requirements.

Primary Respondent Breakdown:

By Designation: C-level Primaries (32%), Director Level (31%), Others (37%)

By Region: North America (32%), Europe (30%), Asia-Pacific (33%), Rest of World (5%)


Market Size Estimation

Global market valuation was derived through capacity mapping and revenue analysis across colocation facilities. The methodology included:

Identification of 60+ key colocation providers and hyperscale operators across North America, Europe, Asia-Pacific, Latin America, and Middle East & Africa

Facility mapping across retail colocation, wholesale colocation, and hyperscale deployments

Analysis of reported and modeled annual revenues specific to colocation and interconnection services

Assessment of power capacity (MW) utilization rates and space utilization (square meters) by facility tier

Coverage of providers representing 75-80% of global colocation market share in 2024

Extrapolation using bottom-up (usable floor space × pricing per kW by region) and top-down (provider revenue validation) approaches to derive segment-specific valuations for retail vs. wholesale colocation, cloud vs. on-premises deployment, and end-user verticals including IT & telecom, BFSI, government & defense, and healthcare

Download Free Sample

Kindly complete the form below to receive a free sample of this Report