Segmentation Quick Reference
| Dimension | Sub-Segments | Dominant Segment (2025) | Fastest Growing Segment (2026–2035) |
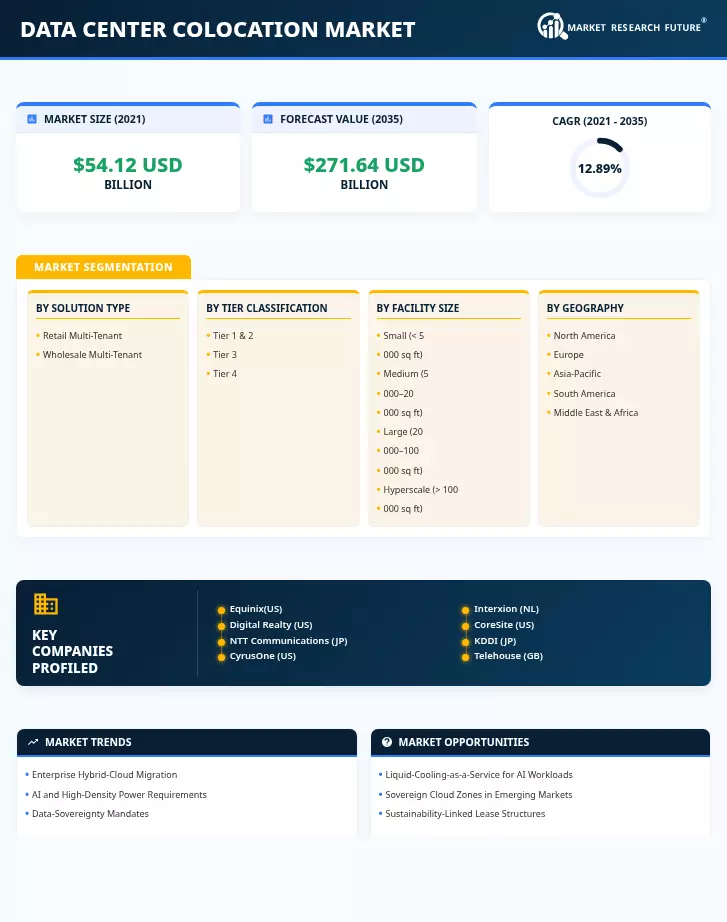
| By Solution Type | Retail Multi-Tenant; Wholesale Multi-Tenant | Retail Multi-Tenant | Wholesale Multi-Tenant |
| By Tier Classification | Tier 1 & 2; Tier 3; Tier 4 | Tier 3 | Tier 4 |
| By Facility Size | Small (< 5,000 sq ft); Medium (5,000–20,000 sq ft); Large (20,000–100,000 sq ft); Hyperscale (> 100,000 sq ft) | Large | Hyperscale |
| By Geography | North America; Europe; Asia-Pacific; South America; Middle East & Africa | North America | Asia-Pacific |
Market Segmentation Overview
By Solution Type
| Sub-Segment | Key Trend |
| Retail Multi-Tenant | Growing demand from SMEs and mid-enterprise hybrid-cloud deployments seeking flexible, short-term colocation hosting for enterprise IT contracts with fractional-rack options |
| Wholesale Multi-Tenant | Hyperscaler pre-leasing of multi-megawatt suites under long-term take-or-pay agreements is driving carrier-neutral colocation facilities expansion. |
Retail multi-tenant halls remain the revenue backbone of the Data Center Colocation Market, serving the widest customer spectrum from single-rack startups to 50-cabinet enterprise deployments. Wholesale suites are gaining momentum as hyperscalers and large financial institutions commit to five-to-ten-year leases that provide operators with bankable cash flows to finance greenfield campus developments and power density colocation solutions upgrades.
By Tier Classification
| Sub-Segment | Key Trend |
| Tier 1 & 2 | Budget-conscious SME workloads and non-critical backup environments tolerating planned maintenance windows |
| Tier 3 | Enterprise-grade concurrent maintainability balancing uptime guarantees with cost-efficient data center colo pricing and SLA models |
| Tier 4 | Mission-critical finance, healthcare, and AI inference workloads demanding 99.995% uptime with full 2N redundancy. |
Tier 3 facilities dominate the Data Center Colocation Market because most enterprise workloads require concurrent maintainability without the premium cost of full fault tolerance. Tier 4 halls are expanding fastest as financial trading platforms, real-time healthcare analytics, and AI inference engines demand uninterrupted availability, reinforcing demand for cross-connect services in colo data centers with the highest reliability standards.
By Facility Size
| Sub-Segment | Key Trend |
| Small (< 5,000 sq ft) | Edge and metro micro-colocation pods supporting latency-sensitive 5G and IoT applications |
| Medium (5,000–20,000 sq ft) | Regional enterprise deployments in Tier-2 cities, balancing proximity with cost optimization |
| Large (20,000–100,000 sq ft) | Multi-tenant campus operations leveraging economies of scale for power density colocation solutions. |
| Hyperscale (> 100,000 sq ft) | Data Center Colocation Market-provider pre-leases of multi-hundred-megawatt campuses anchoring long-term colocation hosting for enterprise IT demand |
Large facilities hold the majority share of the Data Center Colocation Market thanks to their ability to support dense interconnection ecosystems, extensive cross-connect services in colo data centers, and cost-efficient power procurement at scale. Hyperscale campuses represent the fastest-growing category as global cloud providers secure capacity in strategic geographies years ahead of commercial operation, supported by favorable data center colo pricing and SLA models negotiated at scale.