Demand Response Management System Market Summary
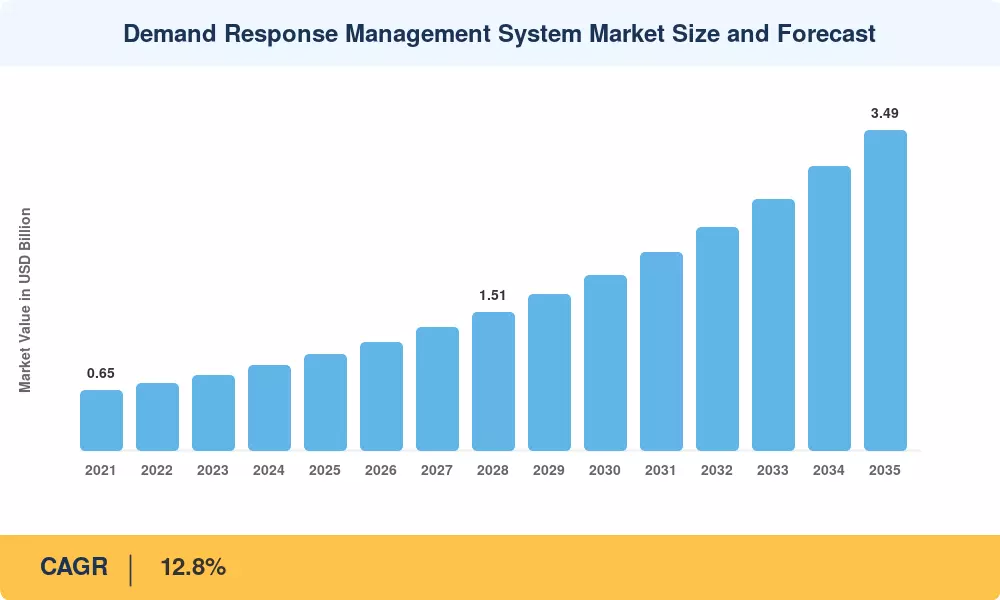
The Demand Response Management System Market reached an estimated USD 1.05 billion in 2025 and is projected to grow from USD 1.18 billion in 2026 to USD 3.49 billion by 2035, registering a CAGR of 12.8% during the 2026–2035 forecast window. Two forces are pulling this trajectory upward: FERC Order 2222, which opened wholesale electricity markets to distributed energy resource aggregations in the United States [1], and the European Union's revised Electricity Market Design Directive adopted in 2024, which mandates member states to integrate demand-side flexibility into capacity mechanisms by 2028 [2]. Grid operators now treat load curtailment not as a last resort but as a monetizable grid asset, and that philosophical shift is reshaping procurement budgets worldwide.
Legacy pager-based and manual curtailment programs are giving way to cloud-native platforms that orchestrate millions of endpoints — smart thermostats, industrial chillers, EV chargers, and battery storage — through real-time price and grid-condition signals. The U.S. Department of Energy allocated USD 3.46 billion under the Grid Resilience and Innovation Partnerships (GRIP) program between 2023 and 2025, a significant slice of which targets advanced demand-side management infrastructure [3]. Utility spending on the Demand Response Management System Market is accelerating as software vendors shift to SaaS subscription models that lower upfront capital requirements.
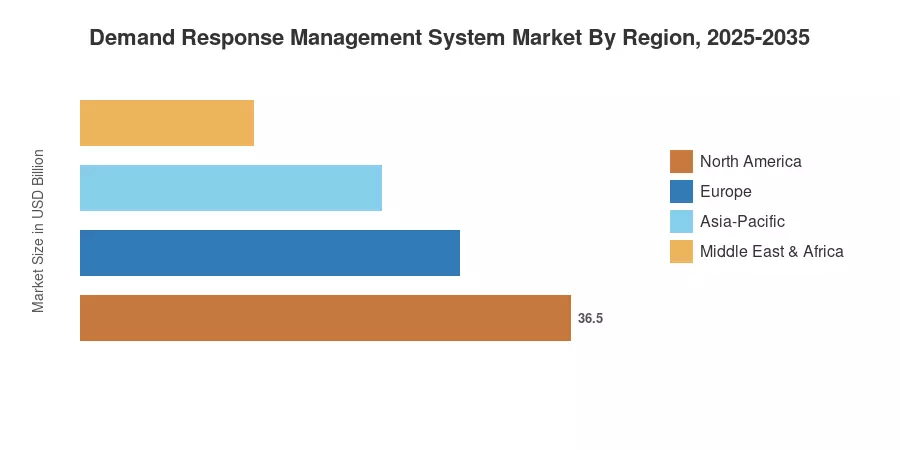
North America commands roughly 38% of the Demand Response Management System Market, driven by PJM Interconnection's capacity market payments and California's aggressive flex-alert programs. Asia-Pacific is the fastest-growing region at a projected CAGR of 15.1%, fueled by smart-grid investments in China, South Korea, and Australia. Europe holds the second-largest share at approximately 27%, anchored by the UK's Capacity Market and France's NEBEF mechanism. By 2035, the convergence of electrification, intermittent renewables, and real-time grid balancing will cement demand response management platforms as critical grid infrastructure.
Key Report Takeaways
• By Component
- Software platforms account for roughly 52% of the Demand Response Management System Market, reflecting utilities' preference for scalable cloud-native orchestration layers over hardware-centric deployments.
- Services — including system integration, consulting, and managed DR operations — represent the fastest-growing component at a CAGR of 14.6% through 2035, as utilities outsource program complexity to specialized vendors.
- Hardware (load-control switches, smart relays, gateways) generated approximately USD 210 million in 2025.
• By Application
- Commercial and industrial (C&I) facilities dominate the Demand Response Management System Market with a combined 64% share, driven by large curtailable loads and direct capacity-market revenue.
- Residential applications are expanding at a CAGR of 14.9%, accelerated by connected-thermostat penetration exceeding 55 million units in North America alone.
• By Region
- North America leads the Demand Response Management System Market at approximately USD 0.40 billion in 2025.
- Asia-Pacific is forecast to reach USD 1.02 billion by 2035, reflecting the highest regional CAGR of 15.1%.
- Europe's Demand Response Management System Market benefits from aggressive policy frameworks, holding a 27% share in 2025.
Market Size and Forecast (2021–2035)
Market Research Future's sizing methodology blends bottom-up utility DR program spending data with top-down TAM estimates derived from grid-connected endpoint counts, capacity-market clearing prices, and SaaS license fee benchmarks. Historical figures (2021–2024) rely on utility annual reports, FERC filings, and national grid operator disclosures; forecast projections (2026–2035) incorporate macro demand curves tied to renewable penetration and electrification rates [4].





















.webp?v=1787579624)
