Demand Response Management System Market (2025 - 2035)

ID: MRFR/EnP/5231-HCR
100 Pages
Priya Nagrale
Last Updated: July 02, 2026
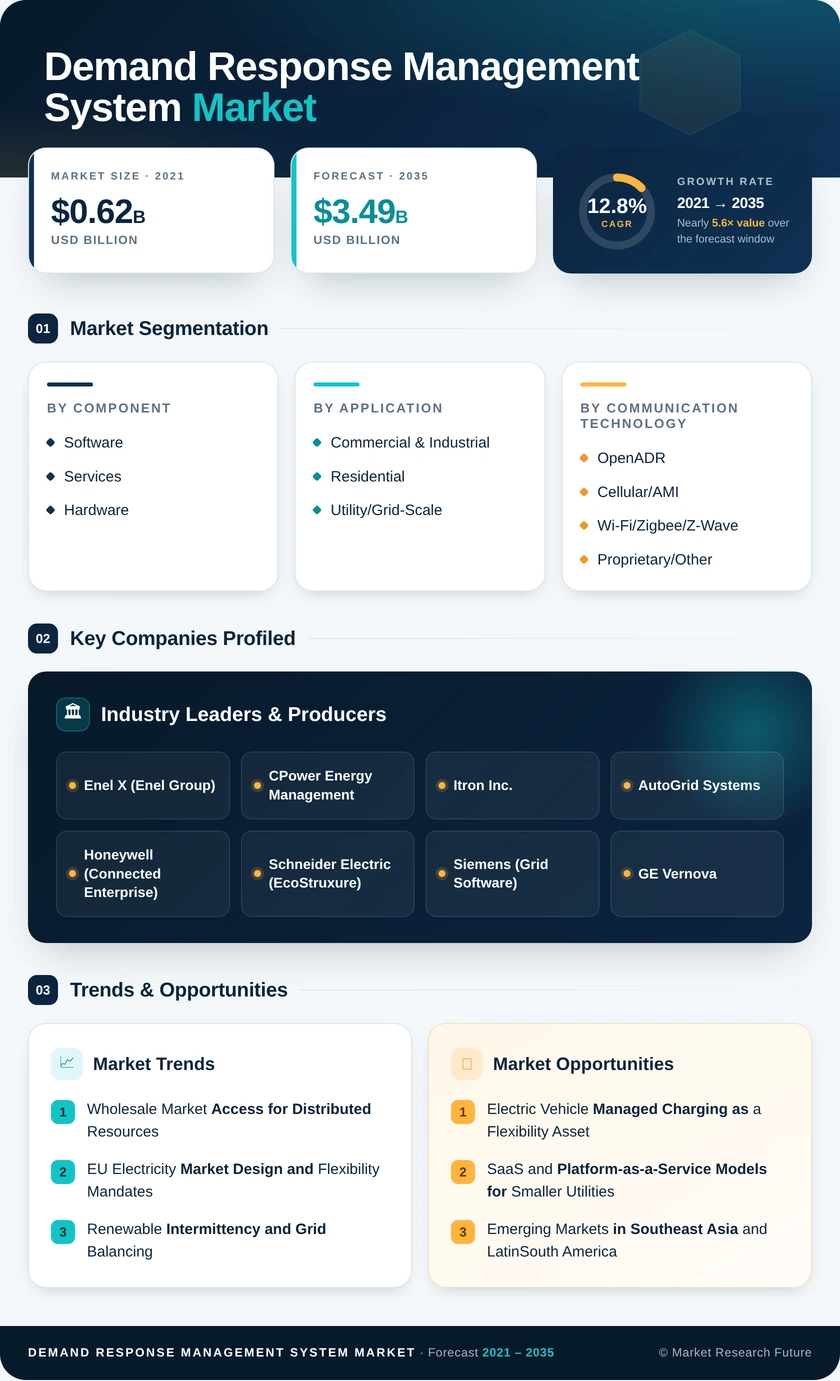
Demand Response Management System Market Size, Share & Growth Analysis Report By Component (Software, Services, Hardware), By Application (Commercial & Industrial, Residential, Utility/Grid-Scale), By Communication Technology (OpenADR, Cellular/AMI, Wi-Fi/Zigbee/Z-Wave, Proprietary/Other) and By Regional (North America, Europe, South America, Asia Pacific, Middle East and Africa) - Trends & Industry Forecast to 2035
Demand Response Management System Market
Market Size
Forecast Period2025-2035
CAGR (2025-2035)12.8%
2025 Market SizeUSD 1.05 Billion
2035 Market SizeUSD 3.49 Billion
Key Players
Enel X
CPower Energy Management
Itron Inc.
AutoGrid Systems
Honeywell
Schneider Electric
Opportunities
  • Electric Vehicle Managed Charging as a Flexibility Asset
  • SaaS and Platform-as-a-Service Models for Smaller Utilities
  • Emerging Markets in Southeast Asia and South America
  1. 1 Market Overview |
    1. 1.1 Study Assumptions & Market Definition |
    2. 1.2 Scope of the Study |
    3. 1.3 Research Methodology
  2. 2 Market Summary & Key Takeaways
  3. 3 Market Dynamics |
    1. 3.1 Market Drivers Analysis | |
      1. 3.1.1 Wholesale Market Access for Distributed Resources (FERC 2222) | |
      2. 3.1.2 EU Electricity Market Design and Flexibility Mandates | |
      3. 3.1.3 Renewable Intermittency and Grid Balancing | |
      4. 3.1.4 Smart-Thermostat and IoT Endpoint Growth | |
      5. 3.1.5 EV Fleet Charging Flexibility | |
      6. 3.1.6 Cloud/SaaS Platform Migration | |
      7. 3.1.7 Extreme Weather Frequency and Grid Stress Events |
    2. 3.2 Market Restraints Analysis | |
      1. 3.2.1 Customer Enrollment and Engagement Fatigue | |
      2. 3.2.2 Regulatory Fragmentation Across Jurisdictions | |
      3. 3.2.3 Cybersecurity and Data-Privacy Risks | |
      4. 3.2.4 Legacy Utility IT Stack Integration Complexity | |
      5. 3.2.5 Baseline-Measurement and M&V Disputes |
    3. 3.3 Market Opportunity Analysis | |
      1. 3.3.1 Electric Vehicle Managed Charging as a Flexibility Asset | |
      2. 3.3.2 SaaS and Platform-as-a-Service Models for Smaller Utilities | |
      3. 3.3.3 Emerging Markets in Southeast Asia and South America | |
      4. 3.3.4 Data Monetization and Grid-Edge Analytics | |
      5. 3.3.5 Integration with Battery Storage and Hybrid Flexibility |
    4. 3.4 Industry Value Chain Analysis |
    5. 3.5 Porter's Five Forces Analysis
  4. 4 Global Demand Response Management System Market Size & Forecast (2021–2035) |
    1. 4.1 Historical Market Size (2021–2025) |
    2. 4.2 Current & Forecast Market Size (2026–2035) |
    3. 4.3 Market Size by Revenue (USD Billion) |
    4. 4.4 Year-over-Year Growth Analysis
  5. 5 Segmentation Analysis |
    1. 5.1 By Component | |
      1. 5.1.1 Software | |
      2. 5.1.2 Services | |
      3. 5.1.3 Hardware |
    2. 5.2 By Application | |
      1. 5.2.1 Commercial & Industrial | |
      2. 5.2.2 Residential | |
      3. 5.2.3 Utility/Grid-Scale |
    3. 5.3 By Communication Technology | |
      1. 5.3.1 OpenADR | |
      2. 5.3.2 Cellular/AMI | |
      3. 5.3.3 Wi-Fi/Zigbee/Z-Wave | |
      4. 5.3.4 Proprietary/Other
  6. 6 Regional Analysis |
    1. 6.1 North America | |
      1. 6.1.1 United States | |
      2. 6.1.2 Canada | |
      3. 6.1.3 Mexico |
    2. 6.2 Europe | |
      1. 6.2.1 United Kingdom | |
      2. 6.2.2 Germany | |
      3. 6.2.3 France | |
      4. 6.2.4 Nordics | |
      5. 6.2.5 Rest of Europe |
    3. 6.3 Asia-Pacific | |
      1. 6.3.1 China | |
      2. 6.3.2 Australia | |
      3. 6.3.3 South Korea | |
      4. 6.3.4 Japan | |
      5. 6.3.5 Rest of Asia-Pacific |
    4. 6.4 South America | |
      1. 6.4.1 Brazil | |
      2. 6.4.2 Chile | |
      3. 6.4.3 Rest of South America |
    5. 6.5 Middle East & Africa | |
      1. 6.5.1 UAE | |
      2. 6.5.2 Saudi Arabia | |
      3. 6.5.3 South Africa | |
      4. 6.5.4 Rest of Middle East & Africa
  7. 7 Competitive Landscape |
    1. 7.1 Market Share Analysis (2025) |
    2. 7.2 Competitive Benchmarking Matrix |
    3. 7.3 Company Profiles | |
      1. 7.3.1 Enel X (Enel Group) | |
      2. 7.3.2 CPower Energy Management | |
      3. 7.3.3 Itron Inc. | |
      4. 7.3.4 AutoGrid Systems | |
      5. 7.3.5 Honeywell (Connected Enterprise) | |
      6. 7.3.6 Schneider Electric (EcoStruxure) | |
      7. 7.3.7 Siemens (Grid Software) | |
      8. 7.3.8 GE Vernova | |
      9. 7.3.9 Oracle Utilities (Opower) | |
      10. 7.3.10 Voltus Inc.
  8. 8 Future Outlook & Strategic Recommendations (2026–2035) |
    1. 8.1 AI-Driven Autonomous Dispatch |
    2. 8.2 Platform Consolidation and Ecosystem Economics |
    3. 8.3 Electrification Supercycle and Peak-Demand Escalation |
    4. 8.4 ESG Reporting and Carbon-Aligned Flexibility
  9. 9 Recent Developments & News
  10. 10 Frequently Asked Questions (FAQs)
  11. 11 Report Scope & Methodology |
    1. 11.1 Study Period & Base Year |
    2. 11.2 Data Sources & Citations |
    3. 11.3 Abbreviations
  12. 12 LIST OF TABLES |
  13. TABLE 1 Global Demand Response Management System Market Size & Forecast, by Revenue (USD Billion), 2021–2035 |
  14. TABLE 2 Global Demand Response Management System Market — Year-over-Year Growth Analysis, 2021–2035 |
  15. TABLE 3 Global Demand Response Management System Market — Driver Impact Analysis, 2026–2035 |
  16. TABLE 4 Global Demand Response Management System Market — Restraints Impact Analysis, 2026–2035 |
  17. TABLE 5 Global Demand Response Management System Market Size, by Component, 2021–2035 (USD Billion) |
  18. TABLE 6 Global Demand Response Management System Market Size, by Application, 2021–2035 (USD Billion) |
  19. TABLE 7 Global Demand Response Management System Market Size, by Communication Technology, 2021–2035 (USD Billion) |
  20. TABLE 8 Global Demand Response Management System Market Size, by Region, 2021–2035 (USD Billion) |
  21. TABLE 9 North America Demand Response Management System Market Size, by Country, 2021–2035 (USD Billion) |
  22. TABLE 10 Europe Demand Response Management System Market Size, by Country, 2021–2035 (USD Billion) |
  23. TABLE 11 Asia-Pacific Demand Response Management System Market Size, by Country, 2021–2035 (USD Billion) |
  24. TABLE 12 South America Demand Response Management System Market Size, by Country, 2021–2035 (USD Billion) |
  25. TABLE 13 Middle East & Africa Demand Response Management System Market Size, by Country, 2021–2035 (USD Billion) |
  26. TABLE 14 North America Demand Response Management System Market Size, by Component, 2021–2035 (USD Billion) |
  27. TABLE 15 North America Demand Response Management System Market Size, by Application, 2021–2035 (USD Billion) |
  28. TABLE 16 North America Demand Response Management System Market Size, by Communication Technology, 2021–2035 (USD Billion) |
  29. TABLE 17 Europe Demand Response Management System Market Size, by Component, 2021–2035 (USD Billion) |
  30. TABLE 18 Europe Demand Response Management System Market Size, by Application, 2021–2035 (USD Billion) |
  31. TABLE 19 Europe Demand Response Management System Market Size, by Communication Technology, 2021–2035 (USD Billion) |
  32. TABLE 20 Asia-Pacific Demand Response Management System Market Size, by Component, 2021–2035 (USD Billion) |
  33. TABLE 21 Asia-Pacific Demand Response Management System Market Size, by Application, 2021–2035 (USD Billion) |
  34. TABLE 22 Asia-Pacific Demand Response Management System Market Size, by Communication Technology, 2021–2035 (USD Billion) |
  35. TABLE 23 South America Demand Response Management System Market Size, by Component, 2021–2035 (USD Billion) |
  36. TABLE 24 South America Demand Response Management System Market Size, by Application, 2021–2035 (USD Billion) |
  37. TABLE 25 South America Demand Response Management System Market Size, by Communication Technology, 2021–2035 (USD Billion) |
  38. TABLE 26 Middle East & Africa Demand Response Management System Market Size, by Component, 2021–2035 (USD Billion) |
  39. TABLE 27 Middle East & Africa Demand Response Management System Market Size, by Application, 2021–2035 (USD Billion) |
  40. TABLE 28 Middle East & Africa Demand Response Management System Market Size, by Communication Technology, 2021–2035 (USD Billion) |
  41. TABLE 29 Competitive Benchmarking Matrix — Global Demand Response Management System Market, 2025 |
  42. TABLE 30 Company Profiles — Key Players, Global Demand Response Management System Market |
  43. TABLE 31 Recent Developments & Strategic Announcements, 2023–2025 |
  44. TABLE 32 United States Demand Response Management System Market Size, by Component, 2021–2035 (USD Billion) |
  45. TABLE 33 United States Demand Response Management System Market Size, by Application, 2021–2035 (USD Billion) |
  46. TABLE 34 United States Demand Response Management System Market Size, by Communication Technology, 2021–2035 (USD Billion) |
  47. TABLE 35 Canada Demand Response Management System Market Size, by Component, 2021–2035 (USD Billion) |
  48. TABLE 36 Canada Demand Response Management System Market Size, by Application, 2021–2035 (USD Billion) |
  49. TABLE 37 Canada Demand Response Management System Market Size, by Communication Technology, 2021–2035 (USD Billion) |
  50. TABLE 38 Mexico Demand Response Management System Market Size, by Component, 2021–2035 (USD Billion) |
  51. TABLE 39 Mexico Demand Response Management System Market Size, by Application, 2021–2035 (USD Billion) |
  52. TABLE 40 Mexico Demand Response Management System Market Size, by Communication Technology, 2021–2035 (USD Billion) |
  53. TABLE 41 United Kingdom Demand Response Management System Market Size, by Component, 2021–2035 (USD Billion) |
  54. TABLE 42 United Kingdom Demand Response Management System Market Size, by Application, 2021–2035 (USD Billion) |
  55. TABLE 43 United Kingdom Demand Response Management System Market Size, by Communication Technology, 2021–2035 (USD Billion) |
  56. TABLE 44 Germany Demand Response Management System Market Size, by Component, 2021–2035 (USD Billion) |
  57. TABLE 45 Germany Demand Response Management System Market Size, by Application, 2021–2035 (USD Billion) |
  58. TABLE 46 Germany Demand Response Management System Market Size, by Communication Technology, 2021–2035 (USD Billion) |
  59. TABLE 47 France Demand Response Management System Market Size, by Component, 2021–2035 (USD Billion) |
  60. TABLE 48 France Demand Response Management System Market Size, by Application, 2021–2035 (USD Billion) |
  61. TABLE 49 France Demand Response Management System Market Size, by Communication Technology, 2021–2035 (USD Billion) |
  62. TABLE 50 China Demand Response Management System Market Size, by Component, 2021–2035 (USD Billion) |
  63. TABLE 51 China Demand Response Management System Market Size, by Application, 2021–2035 (USD Billion) |
  64. TABLE 52 China Demand Response Management System Market Size, by Communication Technology, 2021–2035 (USD Billion) |
  65. TABLE 53 Australia Demand Response Management System Market Size, by Component, 2021–2035 (USD Billion) |
  66. TABLE 54 Australia Demand Response Management System Market Size, by Application, 2021–2035 (USD Billion) |
  67. TABLE 55 Australia Demand Response Management System Market Size, by Communication Technology, 2021–2035 (USD Billion) |
  68. TABLE 56 South Korea Demand Response Management System Market Size, by Component, 2021–2035 (USD Billion) |
  69. TABLE 57 South Korea Demand Response Management System Market Size, by Application, 2021–2035 (USD Billion) |
  70. TABLE 58 South Korea Demand Response Management System Market Size, by Communication Technology, 2021–2035 (USD Billion) |
  71. TABLE 59 Japan Demand Response Management System Market Size, by Component, 2021–2035 (USD Billion) |
  72. TABLE 60 Japan Demand Response Management System Market Size, by Application, 2021–2035 (USD Billion) |
  73. TABLE 61 Japan Demand Response Management System Market Size, by Communication Technology, 2021–2035 (USD Billion) |
  74. TABLE 62 Brazil Demand Response Management System Market Size, by Component, 2021–2035 (USD Billion) |
  75. TABLE 63 Brazil Demand Response Management System Market Size, by Application, 2021–2035 (USD Billion) |
  76. TABLE 64 Brazil Demand Response Management System Market Size, by Communication Technology, 2021–2035 (USD Billion) |
  77. TABLE 65 UAE Demand Response Management System Market Size, by Component, 2021–2035 (USD Billion) |
  78. TABLE 66 UAE Demand Response Management System Market Size, by Application, 2021–2035 (USD Billion) |
  79. TABLE 67 UAE Demand Response Management System Market Size, by Communication Technology, 2021–2035 (USD Billion) |
  80. TABLE 68 Saudi Arabia Demand Response Management System Market Size, by Component, 2021–2035 (USD Billion) |
  81. TABLE 69 Saudi Arabia Demand Response Management System Market Size, by Application, 2021–2035 (USD Billion) |
  82. TABLE 70 Saudi Arabia Demand Response Management System Market Size, by Communication Technology, 2021–2035 (USD Billion)
  83. 13 LIST OF FIGURES |
  84. FIGURE 1 Global Demand Response Management System Market Dynamics — Drivers, Restraints, Opportunities |
  85. FIGURE 2 Industry Value Chain Analysis — Demand Response Management System Market |
  86. FIGURE 3 Porter's Five Forces Analysis — Demand Response Management System Market |
  87. FIGURE 4 Global Demand Response Management System Market Size Trend & Forecast (USD Billion), 2021–2035 |
  88. FIGURE 5 Global Demand Response Management System Market Share, by Component (%), 2025 |
  89. FIGURE 6 Global Demand Response Management System Market Share, by Application (%), 2025 |
  90. FIGURE 7 Global Demand Response Management System Market Share, by Communication Technology (%), 2025 |
  91. FIGURE 8 Global Demand Response Management System Market Share, by Region (%), 2025 |
  92. FIGURE 9 North America Demand Response Management System Market Size Trend (USD Billion), 2021–2035 |
  93. FIGURE 10 Europe Demand Response Management System Market Size Trend (USD Billion), 2021–2035 |
  94. FIGURE 11 Asia-Pacific Demand Response Management System Market Size Trend (USD Billion), 2021–2035 |
  95. FIGURE 12 South America Demand Response Management System Market Size Trend (USD Billion), 2021–2035 |
  96. FIGURE 13 Middle East & Africa Demand Response Management System Market Size Trend (USD Billion), 2021–2035 |
  97. FIGURE 14 Competitive Landscape Heat Map — Demand Response Management System Market, 2025 |
  98. FIGURE 15 Market Share of Top 10 Players — Demand Response Management System Market (%), 2025

Segmentation Quick Reference

DimensionSub-SegmentsDominant SegmentFastest Growing Segment
By ComponentSoftware, Services, HardwareSoftware (~52% share)Services (CAGR 14.6%)
By ApplicationCommercial & Industrial, Residential, Utility/Grid-ScaleCommercial & Industrial (~64% share)Residential (CAGR 14.9%)
By Communication Demand Response Management System MarketOpenADR, Cellular/AMI, Wi-Fi/Zigbee/Z-Wave, Proprietary/OtherOpenADR (~38% share)Cellular/AMI (CAGR 14.2%)


Market Segmentation Overview

By Component

Sub-SegmentKey Trend
SoftwareMigration from on-premise DRMS to multi-tenant cloud-native SaaS platforms with API-first architectures
ServicesGrowth in managed DR operations and turnkey program design outsourced by utilities to specialized aggregators
HardwareDecline in legacy load-control switches offset by next-gen IoT gateways and edge controllers


Software remains the revenue backbone, driven by recurring SaaS license fees and expanding analytics modules. Services are gaining share as utilities prioritize speed-to-market over in-house capability development. Hardware spending is shifting from proprietary switches toward standards-based IoT gateways that support multiple communication protocols.

By Application

Sub-SegmentKey Trend
Commercial & IndustrialData-center and cold-storage flexibility emerging as high-value curtailment sources alongside traditional HVAC loads
ResidentialBring-your-own-thermostat and water-heater programs scaling through utility-app integrations
Utility/Grid-ScaleTransmission-level load balancing and ancillary-services participation growing as ISO markets open to DR


C&I applications retain dominance due to large per-site curtailment capacity and direct capacity-market revenue streams. Residential programs are the fastest-growing segment, propelled by smart-thermostat installed bases exceeding 55 million units in North America and growing penetration in Europe and Australia.

By Communication Demand Response Management System Market

Sub-SegmentKey Trend
OpenADRContinued adoption as the de facto open standard for utility-to-aggregator demand response signaling
Cellular/AMIUtilities leveraging existing AMI networks for DR dispatch, reducing incremental communication costs
Wi-Fi/Zigbee/Z-WaveEmbedded in residential smart-home ecosystems, enabling consumer-facing DR program enrollment
Proprietary/OtherLegacy protocols in industrial settings being gradually replaced by standards-based alternatives


OpenADR holds the largest share due to regulatory mandates in key U.S. markets and growing international adoption. Cellular/AMI-based communication is the fastest-growing technology as smart-meter rollouts in Europe and Asia-Pacific create ready-made pathways for DR signal delivery without dedicated hardware installations.


Download PDF ×

We do not share your information with anyone. However, we may send you emails based on your report interest from time to time. You may contact us at any time to opt-out.