Dental Prosthetics Market (2025 - 2035)

Dental Prosthetics Market Research Report By Type (Denture, Crown, Bridges, Veneer, Abutment and Inlays), By Type of Material (Porcelain-Fused-to-Metal, All-Ceramic and Others), By End User (Dental Hospitals & Clinics and Dental Research Laboratories), and By Region (North America, Europe, Asia-Pacific, And Rest Of The World) - Growth & Industry Forecast 2025 To 2035
ID: MRFR/MED/2129-CR
106 Pages
Satyendra Maurya, Rahul Gotadki
Last Updated: June 30, 2026
Dental Prosthetics Market
Market Size
Forecast Period2025-2035
CAGR (2025-2035)7.55%
2025 Market SizeUSD 10.25 Billion
2035 Market SizeUSD 21.22 Billion
Key Players
Dentsply Sirona
Ivoclar
Straumann Group
Zimmer Biomet
3M Oral Care
Envista Holdings
Opportunities
  • AI-Powered Design Automation
  • Emerging-Market Dental Tourism Clusters
  • 3D-Printed Prosthetic Frameworks

Dental Prosthetics Market Summary

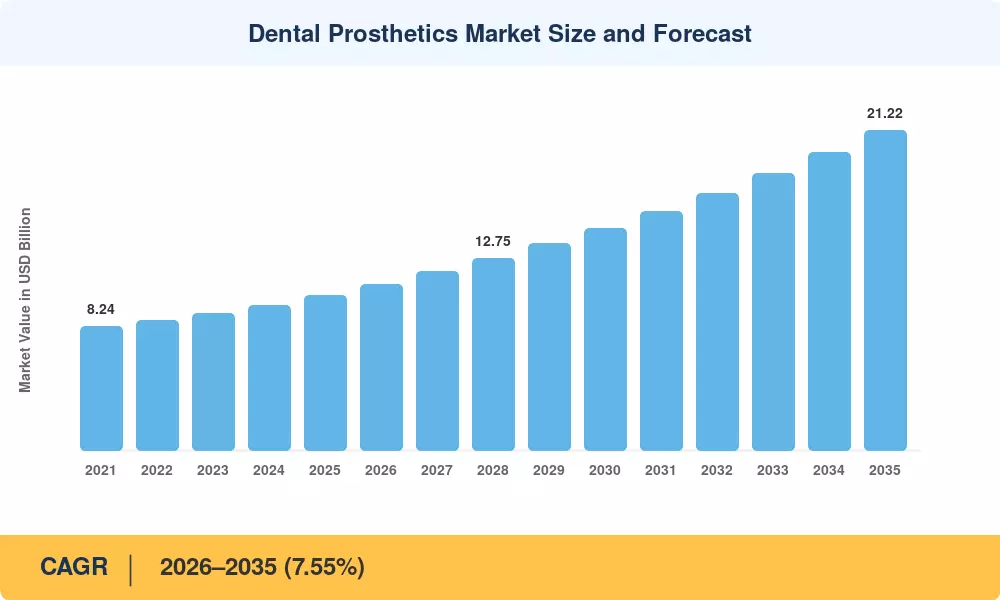
The Global Dental Prosthetics Market size was valued at USD 10.25 Billion in 2025, and the market is projected to grow from USD 11.02 Billion in 2026 to USD 21.22 Billion by 2035, registering a CAGR of 7.55% during the forecast period 2026โ€“2035.ย Structural healthcare reforms across Asia-Pacific and expanded dental-insurance mandates in the Middle East are pulling millions of previously uninsured adults into the restorative care funnel, creating sustained volume demand for crowns, bridges, and full-arch prosthetic solutions. The United States' 2025 tariff on Chinese dental imports has simultaneously catalyzed nearshoring of prosthetic manufacturing to Mexico and Canada, reshaping procurement patterns for hospital networks and group dental practices alike [1].

Digital workflows are rewriting how prosthetics move from design to chairside delivery. Laboratories that once relied on manual wax-up techniques are migrating to integrated scan-to-mill platforms, with an estimated USD 1.8 Billion invested globally in dental digitization infrastructure between 2023 and 2025 [2]. This transition cuts turnaround from five days to under 48 hours for single-unit restorations, a compression that directly lifts case acceptance rates among cost-conscious patients.

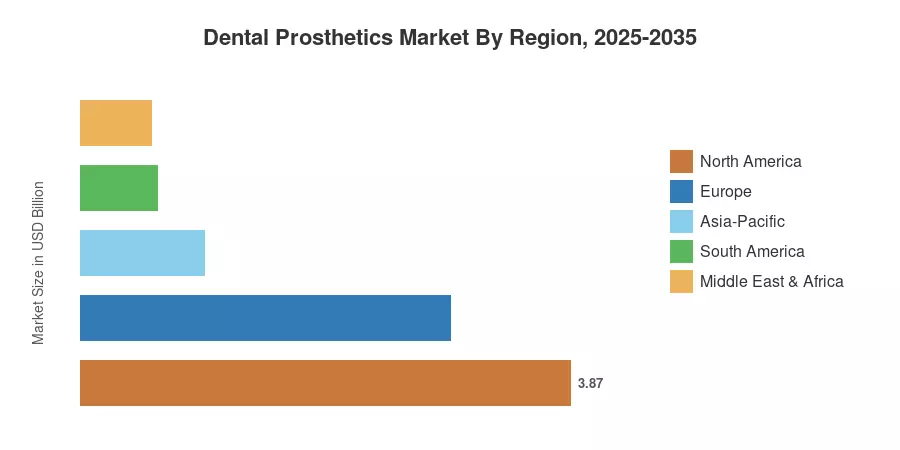
North America held roughly 37.8% of the Dental Prosthetics Market in 2025, anchored by high per-capita dental spending and mature payer networks. Asia-Pacific stands as the fastest-growing region at a projected 9.58% CAGR through 2035, driven by India's Ayushman Bharat dental-coverage expansion and Japan's aging demographics. Europe captured the second-largest share at approximately 28.5%, supported by Germany's statutory insurance model and France's "100% Santรฉ" zero-copay crown program [3]. As aesthetic preferences reshape consumer expectations across generations, the Dental Prosthetics Market is poised for a decade of accelerating growth.

ย 

Key Report Takeaways โ€” Dental Prosthetics Market

By Product Type

  • Crowns captured 46.1% of the Dental Prosthetics Market in 2025, driven by single-visit chairside milling adoption across North America and Europe.
  • The dentures segment is advancing at a 7.38% CAGR through 2035, fueled by geriatric population growth and removable full-arch demand in emerging economies.

By Material

  • Ceramic and zirconia materials accounted for 51.8% of the Dental Prosthetics Market in 2025.
  • Hybrid and composite materials are growing at a 10.12% CAGR through 2035 as cost-sensitive laboratories adopt them for posterior restorations.

By Region

  • North America generated 37.8% of global revenue in 2025.
  • Asia-Pacific is forecast to expand at a 9.58% CAGR between 2026 and 2035, with India and China driving volume.

ย 

Dental Prosthetics Market Size and Forecast (2021โ€“2035)

Market Research Future's proprietary estimation framework integrates bottom-up laboratory output data, dental insurance claims databases across 32 countries, trade-flow analysis for zirconia and cobalt-chromium feedstock, and validated interviews with 150+ dental laboratory operators and prosthodontists. Historical figures (2021โ€“2024) are derived from audited revenue disclosures and import/export customs data; forecast values (2026โ€“2035) reflect scenario-weighted modeling anchored to demographic, regulatory, and technology-adoption variables.
Dental Prosthetics Market Size and Forecast
Our Impact
Enabled $4.3B Revenue Impact for Fortune 500 and Leading Multinationals
Partnering with 2000+ Global Organizations Each Year
30K+ Citations by Top-Tier Firms in the Industry

Driver Impact Analysis

Driver ~% Impact on CAGR Geographic Relevance Impact Timeline
Digital scan-to-mill workflow adoption +1.4% Global Short-term (โ‰ค2 yr)
Dental insurance coverage expansion +1.2% Asia-Pacific, MEA Medium-term (2โ€“4 yr)
Aging population and edentulism rates +1.1% Japan, Europe Long-term (โ‰ฅ4 yr)
Aesthetic demand among millennials +0.9% North America, Europe Short-term (โ‰ค2 yr)
Tariff-driven supply-chain nearshoring +0.7% North America Short-term (โ‰ค2 yr)
Bioactive and hybrid material innovation +0.6% Global Medium-term (2โ€“4 yr)
Tele-dentistry and remote case planning +0.4% Emerging markets Long-term (โ‰ฅ4 yr)

ย 

Digital Scan-to-Mill Workflow Adoption

By the end of 2024, intraoral scanner penetration in North American general dentistry clinics had surpassed 38%, up from 22% in 2021 [2]. Each scanner location provides a downstream draw for prosthetics blanks that are compatible for use in the mills. Integrated chairside units enable same-day crown supply without laboratory intervention. The ADA Health Policy Institute found that practices that offer same-day restorations have a 27% increase in case acceptance for elective posterior crowns, directly increasing per-practice prosthetic revenue [5].

ย 

Dental Insurance Coverage Expansion

Saudi Arabia's Vision 2030 health reforms mandate prosthetic coverage under compulsory employer-sponsored insurance, a policy that added roughly USD 180 Million in addressable demand between 2023 and 2025. These structural coverage gains convert latent need into billable procedures across the Dental Prosthetics Market.

Aging Population and Rising Edentulism

WHO estimates that by 2030, 1.4 billion individuals will be 60 years of age or older, and the prevalence of edentulism in this group would be more than 25% in Southern and Eastern Europe [8]. In Japan, the worldโ€™s most super-aged country, the per-capita denture consumption is already the greatest. In Germany, statutory insurance compensates up to 60% of fixed prosthetic costs for patients over 65. This demographic tailwind means thereโ€™s sustainable base demand regardless of aesthetic or elective trends.

ย 

Aesthetic Demand Among Younger Adults

Millennials and Generation X are more and more seeing anterior restorations as a professional investment more than a therapeutic need. A survey by the American Academy of Cosmetic Dentistry in 2024 showed that 68% of respondents between the ages of 30-45 would pay more for translucent zirconia than metal-ceramic [9]. This propensity to upgrade widens the revenue-per-unit opportunity across the Dental Prosthetics Market.

ย 

ย 

Restraints Impact Analysis

Restraint ~% Impact on CAGR Geographic Relevance Impact Timeline
Raw-material price volatility (zirconia, Co-Cr) โˆ’0.6% Global Short-term (โ‰ค2 yr)
Reimbursement compression in mature markets โˆ’0.5% North America, Europe Medium-term (2โ€“4 yr)
Skilled dental technician shortage โˆ’0.4% Europe, Japan Long-term (โ‰ฅ4 yr)
Regulatory approval timelines for novel materials โˆ’0.3% Global Medium-term (2โ€“4 yr)
Patient affordability barriers in LMICs โˆ’0.3% South America, Africa Long-term (โ‰ฅ4 yr)

ย 

Raw-Material Price Volatility

Zirconia powder prices surged 18% between Q2 2023 and Q4 2024, driven by Chinese export controls on critical mineral feedstock and logistics bottlenecks in Australian mining corridors [11]. Cobalt-chromium alloy, the backbone of removable partial denture frameworks, experienced a 14% year-over-year cost increase through 2024. These input spikes compress laboratory margins and, when passed through to patients, depress elective case volumes โ€” particularly in price-sensitive markets across South America and Southeast Asia.

Reimbursement Compression in Mature Markets

In 2024, U.S. commercial payers cut average authorized amounts for PFM crowns by 3.2%, continuing a five-year trend of fee schedule erosion that constrains practice profitability [12]. Since 2022, NHS Band 3 in the UK has halted reimbursement for prosthetic procedures, resulting in a private-pay scenario for dentists and patients alike, and a limited pool of patients. The payer dynamics establish a structural cap on volume growth in the markets that generate the most revenue per unit now.

ย 

Skilled Dental Technician Shortage

Germanyโ€™s dental laboratory organization estimates a 12% vacancy rate for certified technicians in 2024, while the Japanese technician workforce is shrinking at a rate of 2% per year as retirements exceed new recruits [13]. Automation provides partial relief for this shortfall, but the skill set needed to finish complex full-arch and implant-bar cases is still not fully automatable and has the potential to cause bottlenecks in the production of high-value segments of the Dental Prosthetics Market.

ย 

ย 

Dental Prosthetics Market Opportunities

AI-Powered Design Automation

Machine-learning algorithms trained on millions of crown preparations can now generate anatomically optimized prosthetic designs in under 90 seconds, reducing laboratory design labor by up to 40% [5]. Companies that embed AI into their scan-to-mill pipelines gain a dual advantage: faster throughput and more consistent marginal fit, which lowers remake rates and strengthens customer loyalty among referring dentists.

Emerging-Market Dental Tourism Clusters

Countries such as Turkey, Thailand, and Mexico have cultivated dental-tourism ecosystems that channel international patients toward full-arch implant restorations priced 50โ€“70% below U.S. and European benchmarks [14]. This cross-border demand creates outsized volume for local laboratories and incentivizes investment in advanced milling infrastructure, expanding the addressable footprint of the Dental Prosthetics Market in regions that were historically supply-constrained.

3D-Printed Prosthetic Frameworks

Selective laser melting now produce cobalt-chromium and resin frameworks with accuracy rivaling traditional casting [6]. As printer throughput scales and biocompatible resin portfolios expand, 3D printing could capture 15โ€“20% of laboratory framework production by 2030, particularly for removable partial dentures and temporary restorations.

Subscription and Warranty Business Models

Several large dental service organizations (DSOs) are piloting prosthetic subscription plans that bundle crown replacement warranties with annual memberships, converting one-time transactions into recurring revenue streams [15]. These models improve patient retention and create predictable demand forecasts for partner laboratories, representing a structural business-model opportunity across the Dental Prosthetics Market.

Bioactive and Regenerative Material Platforms

Bioactive glass-ceramic composites that promote remineralization at the tooth-restoration interface are progressing through FDA and CE review [6]. Successful commercialization would open a premium restoration category with superior longevity claims, enabling laboratories and clinicians to capture value beyond today's commodity zirconia pricing.

ย 

Dental Prosthetics Market Future Outlook

AI Integration Across the Prosthetic Value Chain

Artificial intelligence will move beyond design automation into quality-control, shade-matching, and predictive maintenance for milling equipment by the late 2020s [5]. Laboratories deploying AI-assisted inspection systems can expect remake rates to fall below 2%, compared with today's industry average of 5โ€“7%, unlocking margin improvement that sustains investment in further digital infrastructure across the Dental Prosthetics Market.

Platform Economics and Laboratory Consolidation

Cloud-based case-management platforms are creating network effects that favor scale, connecting dentists to vetted laboratory partners through digital marketplaces [15]. By 2030, the top 20 dental laboratory groups could account for 35% of global prosthetic output, up from an estimated 18% today, as smaller operators either join platform ecosystems or exit the market.

Sustainability and Circular Material Flows

Zirconia scrap recycling programs are gaining traction in Europe, where laboratory waste-management directives now incentivize material recovery [19]. A recent report estimates that closed-loop zirconia recycling could reduce raw-material costs by 12โ€“15% for compliant laboratories by 2032, simultaneously addressing ESG reporting requirements imposed by institutional dental-group buyers.

Personalized Prosthetics Through Genomic and Biometric Data

Emerging research links salivary biomarkers and occlusal-force patterns to long-term restoration survival, opening the door to prosthetic prescriptions tailored to individual biology rather than population averages [20]. While still largely academic, early pilot programs at university clinics in Sweden and South Korea suggest that biometrically guided material selection could reduce five-year failure rates by 30%, a proposition that would reshape product-mix decisions across the Dental Prosthetics Market.

ย 

Dental Prosthetics Market Segmentation

The Dental Prosthetics Market segments along four primary dimensions: product type, material, fixation type, and end user. Each dimension reflects distinct clinical, economic, and technological demand drivers.

By Product Type

Segment Key Metric Primary Demand Driver
Crowns 46.1% share (2025) Single-visit chairside milling, aesthetic demand
Bridges USD 1.87 Billion (2025) Multi-unit span replacement in aging populations
Dentures 7.38% CAGR (2026โ€“2035) Geriatric edentulism, emerging-market access
Abutments 8.45% CAGR (2026โ€“2035) Implant procedure volume growth
Inlays/Onlays/Veneers 9.3% share (2025) Conservative aesthetic restorations
Other Prosthetics USD 0.43 Billion (2025) Specialty and temporary restorations

ย 

Crowns dominate the Dental Prosthetics Market by product type, supported by universal clinical applicability across anterior and posterior indications and rapid adoption of chairside milling systems that compress delivery to a single appointment. The dentures segment, while mature, is experiencing a growth resurgence as emerging-market insurance reforms bring edentulous populations into the treatment funnel for the first time.

By Material

Segment Key Metric Primary Demand Driver
Ceramic/Zirconia 51.8% share (2025) Aesthetic superiority, biocompatibility
Metal Alloys USD 2.15 Billion (2025) Cost efficiency for posterior load-bearing cases
Hybrid/Composite 10.12% CAGR (2026โ€“2035) Cost reduction, posterior versatility
Acrylic/Resin 6.8% share (2025) Temporary restorations, removable denture bases

ย 

Ceramic and zirconia materials command the largest share, driven by patient preference for tooth-colored restorations and clinician confidence in monolithic zirconia's mechanical properties. Hybrid composites represent the fastest-growing material category as laboratories seek alternatives that balance aesthetics with cost containment, particularly for large-volume insurance-reimbursed cases.

By Fixation Type

Segment Key Metric Primary Demand Driver
Fixed 58.6% share (2025) Patient preference for permanent solutions
Removable USD 2.72 Billion (2025) Affordability in cost-sensitive segments
Fixed-Removable Hybrid 11.78% CAGR (2026โ€“2035) Implant-overdenture protocols, All-on-4 growth

ย 

Fixed restorations account for the majority of revenue because patients and clinicians overwhelmingly prefer permanent prosthetics that replicate natural tooth function. The fixed-removable hybrid segment is surging as All-on-4 and All-on-6 implant protocols gain mainstream clinical adoption, offering edentulous patients a middle path between conventional dentures and fully fixed implant bridges.

By End User

Segment Key Metric Primary Demand Driver
Dental Clinics 68.3% share (2025) Chairside restoration, direct patient access
Dental Laboratories 9.63% CAGR (2026โ€“2035) Complex multi-unit and implant cases
Hospitals & Academic Centers USD 0.58 Billion (2025) Trauma, oncology reconstruction

ย 

Dental clinics dominate end-user revenue because the vast majority of prosthetic cases originate and are delivered in private-practice settings. Dental laboratories are the fastest-growing end-user channel as complex implant-supported and full-arch cases โ€” which require specialized milling, sintering, and finishing equipment โ€” flow to centralized production facilities rather than chairside workflows.

ย 

Regional Market Share Analysis

Region Key Metric Primary Investment Themes
North America 37.8% share (2025) Digital chairside workflows, DSO consolidation
Europe 28.5% share (2025) Statutory reimbursement reform, ceramic preference
Asia-Pacific 9.58% CAGR (2026โ€“2035) Insurance expansion, dental-tourism infrastructure
South America USD 0.61 Billion (2025) Private-pay growth, cross-border prosthetic trade
Middle East & Africa 5.5% share (2025) Vision 2030 mandates, diaspora-driven demand
Total USD 10.25 Billion (2025) โ€”

The Dental Prosthetics Market exhibits pronounced regional asymmetry, with mature payer systems in North America and Europe generating disproportionate per-capita revenue, while volume growth concentrates in Asia-Pacific and the Middle East.

ย 

North America

Country Key Metric Key Driver
United States 78.2% of regional revenue DSO expansion and payer network scale
Canada 13.5% of regional revenue Public dental-care program (2024 launch)
Mexico 8.22% CAGR (2026โ€“2035) Nearshoring of prosthetic manufacturing

ย 

The United States drives nearly four-fifths of North American demand, with DSO chains such as Aspen Dental and Heartland accelerating prosthetic case volumes through centralized laboratory partnerships and patient financing programs. Canada's new federal dental-care plan, launched in mid-2024, extends prosthetic coverage to low-income adults and seniors, adding an estimated 4.5 million eligible beneficiaries [16]. Mexico benefits from U.S. tariff-driven supply-chain realignment, with Monterrey and Guadalajara emerging as laboratory outsourcing hubs for American dental groups.

Europe

Country Key Metric Key Driver
Germany 26.3% of regional revenue Statutory insurer reimbursement model
United Kingdom 7.62% CAGR (2026โ€“2035) Private-pay growth amid NHS constraints
France 18.8% of regional revenue "100% Santรฉ" zero-copay crown program
Italy 12.4% of regional revenue Aesthetic-driven private practice demand
Spain 7.15% CAGR (2026โ€“2035) Dental-tourism inflows from Northern Europe
Nordic Countries 8.1% of regional revenue High per-capita spend, aging demographics
Russia 5.88% CAGR (2026โ€“2035) Import substitution policies
Rest of Europe 9.2% of regional revenue Mixed public-private systems

ย 

Germany anchors the European Dental Prosthetics Market through a statutory insurance framework that reimburses 60% of prosthetic costs, with bonus incentives for patients maintaining continuous dental records [3]. France's "100% Santรฉ" reform eliminated patient copays for a defined basket of crowns and bridges in 2020, lifting procedure volumes by an estimated 22% through 2024. The UK's NHS funding freeze has paradoxically stimulated private-sector prosthetic spending, as patients unwilling to wait for NHS appointments turn to private clinics offering same-day digital restorations.

Asia-Pacific

Country Key Metric Key Driver
China 31.4% of regional revenue Urban middle-class dental spend
India 10.85% CAGR (2026โ€“2035) Ayushman Bharat prosthetic coverage
Japan 24.6% of regional revenue Super-aged population, high denture demand
South Korea 13.8% of regional revenue Aesthetic crown preference, K-beauty influence
ASEAN 9.92% CAGR (2026โ€“2035) Dental-tourism hubs (Thailand, Vietnam)
Rest of Asia-Pacific 7.3% of regional revenue Varied insurance penetration

ย 

China's urban dental-clinic chainsโ€”led by players such as Arrail Dental and Bybo Dentalโ€”have expanded prosthetic offerings beyond traditional metal-ceramic crowns into premium translucent zirconia, reflecting middle-class willingness to pay for aesthetics [17]. India's public-sector coverage expansion and rapid growth of corporate dental chains position it as the fastest-growing national market within Asia-Pacific, while Japan's per-capita denture consumption remains the highest globally.

South America

Country Key Metric Key Driver
Brazil 62.5% of regional revenue Largest private dental network in South America
Argentina 7.85% CAGR (2026โ€“2035) Currency stabilization lifting imports
Rest of South America 18.3% of regional revenue Mixed public-private coverage models

ย 

Brazil's "Brasil Sorridente" public oral-health program serves as a primary-care gateway that channels patients toward prosthetic treatment in both public and private settings. The country's dense network of independent dental laboratoriesโ€”estimated at over 14,000 facilitiesโ€”creates a fragmented but high-volume production base for crowns and removable prosthetics [14].

Middle East & Africa

Country Key Metric Key Driver
Saudi Arabia 28.7% of regional revenue Vision 2030 employer-mandated insurance
UAE 9.15% CAGR (2026โ€“2035) Medical-tourism positioning, premium aesthetics
South Africa 18.6% of regional revenue Private healthcare network concentration
Egypt 8.72% CAGR (2026โ€“2035) Young population, rising disposable income
Rest of MEA 24.5% of regional revenue NGO-supported prosthetic programs

ย 

Saudi Arabia's compulsory employer-sponsored dental insurance now covers prosthetic restorations, adding an estimated 6 million newly insured workers since 2022 [18]. The UAE positions itself as a regional hub for premium dental aesthetics, attracting patients from across the Gulf Cooperation Council for full-mouth rehabilitation procedures.

ย 

Dental Prosthetics Market By Region, 2025-2035

Competitive Benchmarking

The Dental Prosthetics Market exhibits medium concentration, with the top five players estimated to hold 38โ€“44% of global revenue collectively. The Herfindahl-Hirschman Index sits in the moderate range (~800โ€“1,200), reflecting a landscape where large multinationals compete alongside thousands of regional and independent dental laboratories. Strategic differentiation centers on digital ecosystem integration, material science portfolios, and geographic distribution networks.

Company Est. Revenue Share Range Key Offerings Strategic Positioning
Dentsply Sirona ~10โ€“13% Cercon zirconia, Celtra press ceramics, CEREC chairside system Vertically integrated digital-to-restoration platform
Ivoclar ~7โ€“10% IPS e.max lithium disilicate, PrograMill, Ivotion denture system Premium aesthetic materials and automated denture production
Straumann Group ~6โ€“9% CARES prosthetics, BLX implant-abutment system Implant-prosthetic synergy across premium and value tiers
Zimmer Biomet (ZimVie) ~5โ€“8% Encode abutments, BioHorizons prosthetic platform Strong U.S. implant-prosthetic installed base
3M Oral Care ~4โ€“7% Lava zirconia, RelyX cements, Filtek restoratives Broad material science portfolio, global distribution
Envista Holdings (Nobel Biocare) ~4โ€“6% NobelProcera, All-on-4 prosthetic components Pioneer in implant-supported full-arch prosthetics
GC Corporation ~3โ€“5% Gradia, Initial ceramic systems Strong Asia-Pacific presence, ceramic specialization
Shofu Inc. ~2โ€“4% HC Block zirconia, Vintage Halo ceramics Cost-competitive milling blanks for mid-market labs
VITA Zahnfabrik ~2โ€“4% VITA ENAMIC, VITA YZ zirconia Shade-system standardization and material reliability
Amann Girrbach ~2โ€“3% Ceramill milling systems, Zolid zirconia End-to-end digital laboratory workflow integration

ย 

ย 

Recent News & Developments

  • Dentsply Sirona (September 2024): Launched the DS Core Connect open-architecture platform enabling laboratories to integrate third-party intraoral scanner data into its Primemill workflow, expanding its digital ecosystem beyond proprietary hardware [2].

ย 

ย 

  • U.S. Trade Representative (January 2025): Finalized 25% tariffs on Chinese-manufactured dental prosthetic components, accelerating nearshoring of crown and bridge production to North American facilities [1].

ย 

  • GC Corporation (January 2023): Formally introduced its next-generation GC Initial Zirconia Disk Multilayer Elite system across international laboratory networks, applying advanced multi-layered raw material coloration engineering to mimic real tooth enamel translucency and optimize strength thresholds without needing labor-intensive hand-staining steps.
  • 3M Oral Care (April 2024): Successfully finalized the comprehensive, tax-free corporate spin-off of its multi-billion dollar healthcare segment into the independent public entity Solventum Corporation, transferring its core clinical oral care portfolioโ€”including RelyX resin cements and Filtek restorativesโ€”under Solventum's structural command.

ย 

Dental Prosthetics Market Report Scope

Parameter Detail
Market Scope Global Dental Prosthetics Market โ€” crowns, bridges, dentures, abutments, inlays/onlays/veneers, other prosthetics
Study Period 2021โ€“2035
CAGR (2026โ€“2035) 7.55%
Base Year 2025 USD 10.25 Billion
Forecast Endpoint 2035 USD 21.22 Billion
Fastest Growing Segment Fixed-Removable Hybrid by fixation; Hybrid/Composite by material
Companies Profiled 10 (Dentsply Sirona, Ivoclar, Straumann, Zimmer Biomet, 3M, Envista/Nobel Biocare, GC Corporation, Shofu, VITA Zahnfabrik, Amann Girrbach)
Valuation Currency USD Billion

ย 

ย 

FAQs

How does chairside milling compare with laboratory-fabricated prosthetics in clinical outcomes?
Chairside-milled single crowns demonstrate five-year survival rates of 95โ€“97%, comparable to laboratory-fabricated restorations [5]. The primary trade-off is reduced shade-layering options in monolithic chairside blocks versus hand-finished laboratory work.
What procurement factors should dental groups prioritize when selecting a prosthetic supplier?
Prioritize digital-file compatibility, turnaround guarantees, and remake-rate transparency over unit price alone [15]. Supplier integration with the practice's intraoral scanner ecosystem reduces friction and rework costs.
How are tariff changes affecting prosthetic sourcing strategies for U.S. dental practices?
The 2025 tariffs pushed landed costs of Chinese-sourced crowns up by approximately 25%, prompting many U.S. buyers to shift orders to Mexican and Canadian laboratories [1]. Practices should audit supply-chain concentration risk quarterly.
What is the typical ROI timeline for a dental laboratory investing in a five-axis milling unit?
Most laboratories recover their milling-unit investment within 18โ€“24 months at volumes exceeding 80 units per month [2]. Throughput utilization above 70% is critical to achieving positive cash flow within that window.
How do fixed-removable hybrid prosthetics differ from conventional implant bridges in patient selection?
Hybrid designs suit patients with moderate bone resorption who need prosthetic lip support that fixed bridges cannot provide [7]. They also allow easier hygiene access, which benefits elderly patients with limited dexterity.
What regulatory pathway do bioactive prosthetic materials follow in the United States?
Bioactive ceramics typically require a 510(k) submission with bench-testing data for biocompatibility, flexural strength, and wear resistance [6]. Clinical trial data is not generally required unless the material introduces a novel mechanism of action.
How should smaller independent laboratories position against large consolidated lab groups?
Independent laboratories should focus on complex case specialization โ€” implant bars, combination cases, and aesthetic layering โ€” where artisan skill commands premium pricing [13]. Digital marketplace integration extends their reach beyond local referral networks. ย  ย 
Author
Author
Author Profile
Satyendra Maurya LinkedIn
Research Analyst
An accomplished research analyst with high proficiency in market forecasting, data visualization, competitive benchmarking, and others. He holds a pronounced track record in research and consulting projects for sectors such as life sciences, medical devices, and healthcare IT. His capabilities in qualitative and quantitative analysis have resulted in positive client outcomes. Working on niche market trends, opportunities, sales, and forecasted value is part of his skill set.
Co-Author
Co-Author Profile
Rahul Gotadki LinkedIn
Research Manager
He holds an experience of about 9+ years in Market Research and Business Consulting, working under the spectrum of Life Sciences and Healthcare domains. Rahul conceptualizes and implements a scalable business strategy and provides strategic leadership to the clients. His expertise lies in market estimation, competitive intelligence, pipeline analysis, customer assessment, etc.

Research Approach

ย 

Secondary Research

The secondary research process involved comprehensive analysis of regulatory databases, peer-reviewed dental journals, clinical prosthodontic publications, and authoritative oral health organizations. Key sources included the US Food & Drug Administration (FDA) Center for Devices and Radiological Health (CDRH), European Medicines Agency (EMA) Medical Device Regulations, International Organization for Standardization (ISO/TC 106 Dentistry), American Dental Association (ADA) Health Policy Institute, FDI World Dental Federation, National Institute of Dental and Craniofacial Research (NIDCR/NIH), National Center for Biotechnology Information (NCBI/PubMed), Centers for Disease Control and Prevention (CDC) Division of Oral Health, World Health Organization (WHO) Oral Health Programme, EU Eurostat Healthcare Database, American College of Prosthodontists (ACP), Academy of General Dentistry (AGD), and national dental ministry reports from key markets.

The following sources were employed to compile procedure statistics for crown and bridge placements, implant volumes, regulatory 510(k) and PMA approval data, clinical safety studies on titanium and zirconium materials, demographic trends in edentulism, and market landscape analysis for fixed and removable dental prosthetics.

ย 

Primary Research

Qualitative and quantitative insights were obtained by interviewing supply-side and demand-side stakeholders during the primary research process. The supply-side sources consist of CEOs, VPs of Product Development, regulatory affairs chiefs, and commercial directors from dental prosthetic manufacturers, implant system providers, and dental laboratory equipment OEMs. Board-certified prosthodontists, oral and maxillofacial surgeons, dental laboratory directors, and procurement leads from dental clinics, hospital dental departments, and multispecialty dental service organizations (DSOs) constituted demand-side sources. Primary research has confirmed the timelines for the adoption of CAD/CAM technology, validated market segmentation for crowns, bridges, dentures, and abutments, and collected insights on clinical material preferences for titanium versus zirconium, digital dentistry workflows, pricing strategies, and reimbursement dynamics for restorative procedures.

Primary Respondent Breakdown:

By Designation: C-level Primaries (32%), Director Level (33%), Others (35%)

By Region: North America (32%), Europe (30%), Asia-Pacific (28%), Rest of World (10%)

ย 

Market Size Estimation

Revenue mapping and procedure volume analysis were implemented to determine global market valuation. The methodology comprised the following:

The identification of over 50 significant manufacturers in North America, Europe, Asia-Pacific, and Latin America who specialize in dental implants, crowns, bridges, and removable prosthetics.

Product mapping for abutments, crowns, bridges, and complete/partial dentures in the categories of titanium, zirconium, ceramic, and composite materials

Examination of annual revenues that are reported and modeled for dental prosthetic portfolios, which include CAD/CAM-manufactured restorations

The 2024 global market share will be represented by a variety of manufacturers, such as Institut Straumann AG, Dentsply Sirona Inc., Zimmer Biomet Holdings Inc., and Ivoclar Vivadent AG, with a coverage of 70-75%.

Segment-specific valuations for fixed and removable prosthetic segments are derived through extrapolation using bottom-up (procedure volume ร— ASP by country for implant placements, crown preparations, and denture fittings) and top-down (manufacturer revenue validation) approaches.

Download Free Sample

Kindly complete the form below to receive a free sample of this Report

Download PDF ×

We do not share your information with anyone. However, we may send you emails based on your report interest from time to time. You may contact us at any time to opt-out.
















