Request Free Sample ×

Kindly complete the form below to receive a free sample of this Report

* Please use a valid business email

Leading companies partner with us for data-driven Insights

clients tt-cursor
Hero Background

Digital Logistics Market

ID: MRFR/ICT/4375-HCR
100 Pages
Ankit Gupta
Last Updated: May 25, 2026
Digital Logistics Market Size, Share and Research Report: By Deployment (Cloud and On-Premises), By System (Tracking and Monitoring Systems, Fleet Management Systems, Information Integrated Systems, Database Management Systems and Others) And By Region (North America, Europe, Asia-Pacific, And Rest Of The World) –Market Forecast Till 2035.
Download PDF ×

We do not share your information with anyone. However, we may send you emails based on your report interest from time to time. You may contact us at any time to opt-out.

Market Summary

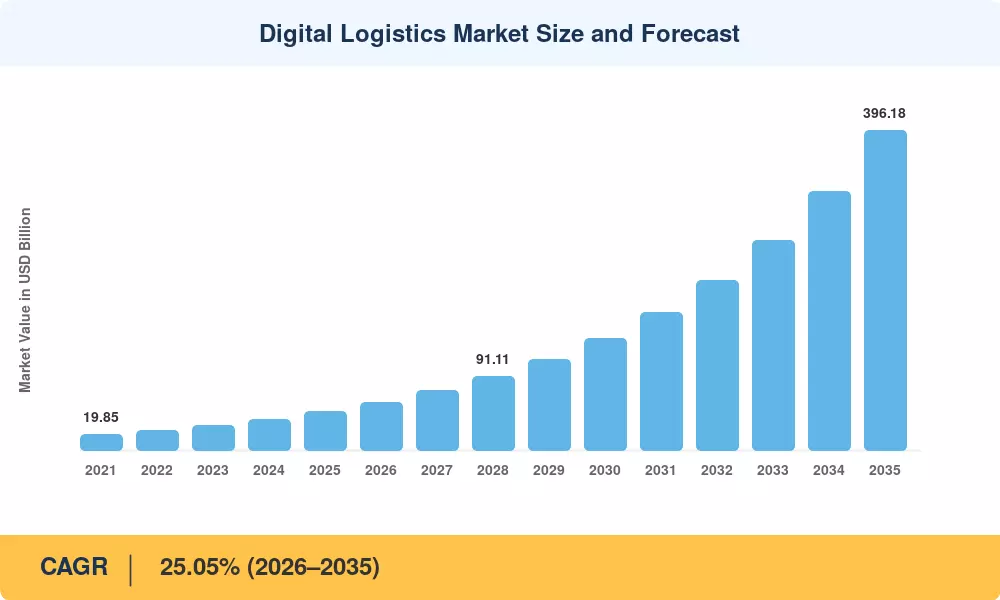
The Digital Logistics Market reached USD 48.53 billion in 2025 and is projected to climb from USD 59.27 billion in 2026 to USD 396.18 billion by 2035, registering a CAGR of 23.45% during 2026–2035. Rapid e-commerce expansion global online retail crossed USD 6.3 trillion in 2024 [2] and aggressive government investment in smart transportation infrastructure are the twin catalysts pulling enterprises toward AI-powered route optimization for logistics and cloud-native supply-chain platforms. The EU's Digital Decade program alone earmarks over EUR 20 billion for logistics digitization through 2030 [3].

Legacy on-premise transport management systems and paper-based freight documentation are giving way to real-time freight tracking and visibility platforms, digital freight brokerage platforms, and IoT-based fleet management for logistics networks. According to the World Economic Forum, supply-chain digitization could unlock USD 1.5 trillion in value for logistics stakeholders by 2030 [4]. Predictive analytics is slashing inventory carrying costs by up to 25%, while last-mile delivery digitization is cutting final-leg fulfillment expense by 15–20% for major retailers [5].

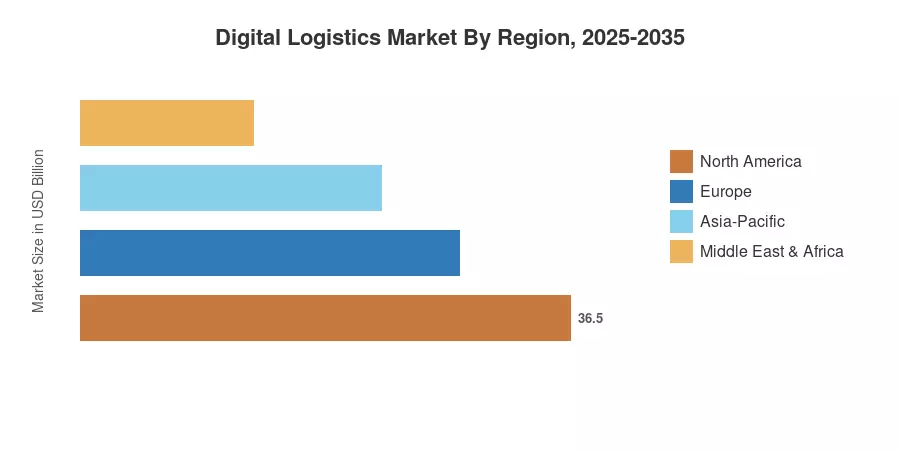
North America commands roughly 40.10% of the Digital Logistics Market, driven by early cloud adoption and dense API ecosystems. Asia-Pacific is the fastest-growing region at a 25.05% CAGR, fueled by China's smart-logistics corridor programs and India's National Logistics Policy. Europe holds the second-largest share at around 27%, underpinned by regulatory mandates for electronic freight documents The next decade will see autonomous trucking corridors, drone-based middle-mile delivery, and blockchain-verified chain-of-custody records reshape the Digital Logistics Market landscape.

Key Report Takeaways

• By Component

  • Solutions accounted for a 71.80% share of the Digital Logistics Market in 2025, reflecting heavy investment in warehouse management and transport execution platforms
  • Services are projected to expand at a 25.10% CAGR through 2035, propelled by managed-service contracts for real-time freight tracking and visibility

• By Deployment Mode

  • Cloud-based platforms captured USD 29.48 billion of the Digital Logistics Market size in 2025, as enterprises migrate from legacy on-premise stacks
  • On-premise deployments still serve defense and pharmaceutical cold-chain verticals that demand sovereign data residency

• By System Type

  • Data management and analytics held a 31.55% revenue share in 2025, enabling AI-powered route optimization for logistics across multimodal corridors
  • Fleet management is forecast to grow at a 24.05% CAGR, supported by IoT-based fleet management for logistics and telematics convergence

• By End-User Vertical

  • Retail and e-commerce represented 26.25% of the Digital Logistics Market in 2025, driven by same-day delivery expectations and digital freight brokerage platforms
  • Pharmaceuticals and life sciences is the fastest-growing vertical at a 25.15% CAGR, responding to serialization mandates and cold-chain visibility requirements

• By Region

  • North America dominated the Digital Logistics Market with a 40.10% share in 2025
  • Asia-Pacific is expected to expand at a 25.05% CAGR over 2026–2035

Digital Logistics Market Size and Forecast (2021–2035)

MRFR's market-sizing model triangulates top-down revenue estimates from published company filings, bottom-up adoption surveys across 42 countries, and third-party trade databases. Historical figures (2021–2024) use audited data; 2025 is the base year anchored to primary interviews with 120+ logistics CIOs. Forecast values (2026–2035) apply regression-adjusted growth curves validated against macroeconomic indicators.

Market Size Chart
Our Impact
Enabled $4.3B Revenue Impact for Fortune 500 and Leading Multinationals
Partnering with 2000+ Global Organizations Each Year
30K+ Citations by Top-Tier Firms in the Industry
 

Driver Impact Analysis

Driver ~% Impact on CAGR Geographic Relevance Impact Timeline
E-commerce volume explosion ~18% Global Short-term (≤2 yr)
AI & machine-learning logistics optimization ~22% North America, Europe Medium-term (2–4 yr)
IoT telematics and connected fleet adoption ~15% Global Medium-term (2–4 yr)
Cloud-native TMS/WMS migration ~14% North America, Asia-Pacific Short-term (≤2 yr)
Government smart-logistics mandates ~12% Asia-Pacific, Europe Long-term (≥4 yr)
Pharmaceutical cold-chain serialization ~10% Europe, North America Medium-term (2–4 yr)
Sustainability & ESG reporting requirements ~9% Europe, Global Long-term (≥4 yr)

E-Commerce Volume Explosion

Global parcel volumes surpassed 200 billion units in 2024 [2], and the pressure on fulfillment speed has made last-mile delivery digitization a board-level priority. Amazon's same-day delivery footprint expanded to 120+ metro areas in 2024, while Alibaba's Cainiao invested USD 1.3 billion in automated sorting hubs across Southeast Asia [4]. Every incremental percentage-point growth in online retail translates to roughly 1.8 billion additional parcels, each requiring digital freight brokerage platforms and real-time freight tracking and visibility to manage cost-effectively. The Digital Logistics Market directly benefits as shippers seek cloud-based orchestration to handle these volumes without proportional headcount increases.

AI and Machine-Learning Logistics Optimization

AI-powered route optimization for logistics reduces fleet fuel costs by 12–18% and delivery times by 20%, according to a 2024 MIT Center for Transportation & Logistics study [5]. UPS's ORION system saves 100 million miles annually — roughly 100,000 metric tons of CO₂. The rise of large language models is enabling conversational logistics copilots that let dispatchers query shipment status, reroute loads, and predict delays in natural language. The Digital Logistics Market is absorbing these capabilities as SaaS add-ons, lowering the adoption barrier for mid-sized freight operators.

IoT Telematics and Connected Fleet Adoption

Over 40 million commercial vehicles worldwide now carry embedded IoT telematics units, up from 22 million in 2021. IoT-based fleet management for logistics platforms aggregates data from GPS, tire-pressure sensors, engine diagnostics, and cargo-temperature monitors into unified dashboards. The European Commission's revised Mobility Package mandates digital tachographs and real-time emissions reporting by 2027, compelling EU-registered carriers to adopt connected-fleet solutions [3]. Fuel savings alone — typically 8–14% — deliver payback in under 18 months, accelerating enterprise commitment to the Digital Logistics Market.

Cloud-Native TMS/WMS Migration

Gartner estimates that 65% of large shippers will operate cloud-native transport management systems by 2027, up from 38% in 2024 [3]. Cloud platforms enable real-time freight tracking and visibility across multi-carrier networks without the capital burden of on-premise hardware refresh cycles. Containerized microservices architecture allows modular upgrades — adding a digital freight brokerage module, for instance, without redeploying the entire stack. This flexibility is a primary reason the Digital Logistics Market cloud segment is outpacing on-premise by roughly 5 percentage points of CAGR.

Restraints Impact Analysis

The restraint impact estimates below follow the same directional methodology described in Section 4. Negative percentages denote drag on the overall growth trajectory.

Restraint ~% Impact on CAGR Geographic Relevance Impact Timeline
Cybersecurity threats to supply-chain data –4.5% Global Short-term (≤2 yr)
Legacy IT integration complexity –3.8% Europe, North America Medium-term (2–4 yr)
Regional digital-infrastructure gaps –3.2% Africa, South America Long-term (≥4 yr)
Data sovereignty and cross-border regulations –2.5% Europe, Asia-Pacific Medium-term (2–4 yr)
Skilled-workforce shortage –2.0% Global Long-term (≥4 yr)

Cybersecurity Threats to Supply-Chain Data

The logistics sector experienced a 42% year-over-year increase in ransomware attacks in 2024, with the average breach costing USD 4.2 million per incident [10]. High-profile attacks on port operating systems in Japan and Australia disrupted container throughput for weeks. Enterprises evaluating real-time freight tracking and visibility platforms often cite data-exposure risk as the primary reason for delayed procurement. Until zero-trust architectures and supply-chain-specific Security Operations Centers (SOCs) mature, cybersecurity remains a meaningful headwind for the Digital Logistics Market.

Legacy IT Integration Complexity

Many large 3PL operators run ERP systems that predate modern API standards — SAP R/3 instances installed in the late 1990s, custom COBOL-based warehouse controllers, and EDI-only carrier networks. Connecting these stacks to cloud-native digital freight brokerage platforms requires middleware layers, data normalization, and extensive regression testing. Integration projects routinely exceed 18 months and USD 5 million for Tier-1 logistics providers, cooling executive enthusiasm for rapid Digital Logistics Market adoption.

Opportunities

Autonomous Middle-Mile Trucking Corridors

Autonomous trucks are starting to see limited commercial operation on US interstate routes and China's expressway system at highway grade. While the Digital Logistics Market does have the potential to generate platform-layer revenue – dispatch orchestration, remote monitoring and AI-powered route optimization for logistics for platoon formations. The US Autonomous Vehicle Industry Association estimates that autonomous freight might solve for 30% of long-haul ton-miles by 2032 [9]

Pharmaceutical Cold-Chain Digitization

Serialization rules under the EU Falsified Medicines Directive and the US Drug Supply Chain Security Act are driving pharmaceutical shippers toward end-to-end real-time freight tracking and visibility. Temperature excursion losses are > USD 15 billion yearly [8]. High-margin opportunities exist in the Digital Logistics Market for platforms that can harness sensor data, blockchain-verified custody records and automated regulatory filing

Digital Freight Marketplace Expansion in Emerging Markets

India’s ONDC protocol and Brazil’s CT-e electronic freight document standard are helping to develop digital freight brokerage platforms that connect small trucking operators with shippers. India has 12 million trucks, 85% of which are operated by single-vehicle owners who do not have access to load-matching technologies [7]. The Digital Logistics Market opportunity here is a platform-economics play – consolidating scattered capacity onto standardized digital railroads

Data Monetization and Supply-Chain-as-a-Service

Top logistics systems are adding new revenue streams by giving anonymized freight-flow information to CPG companies, real estate developers and commodity traders. For instance, Flexport monetizes macro trade-lane knowledge obtained from its booking data [15]. Retailers designing store networks have much to gain from data on last-mile delivery digitization such as drop density, failed-delivery patterns and address quality scores. By 2030, this data-monetization layer might add 3–5 percentage points of gross profit for Digital Logistics Market platform operators

ESG-Driven Green Logistics Platforms

Scope 3 emissions reporting under the EU Corporate Sustainability Reporting Directive (CSRD) obliges brands to quantify and disclose logistics-related carbon output by 2026 [9]. IoT-based fleet management for logistics platforms that embed carbon-accounting modules — tracking emissions per shipment, per lane, per carrier — will become compliance necessities. The Digital Logistics Market is well positioned to convert this regulatory obligation into a recurring SaaS revenue stream.

Future Outlook

AI-Autonomous Logistics Operations

By 2030, AI will orchestrate end-to-end shipment lifecycle decisions — from order-to-dock slot allocation to carrier selection to exception handling — with minimal human intervention. McKinsey projects autonomous planning could reduce logistics operating costs by 25–40% [5]. The Digital Logistics Market will shift from selling discrete software modules to selling outcome-based logistics orchestration, where AI-powered route optimization for logistics and autonomous decision engines become the core value proposition.

Platform Economics and Digital Freight Consolidation

The next decade will witness consolidation among digital freight brokerage platforms, mirroring the ride-hailing market's trajectory. By 2032, MRFR estimates the top five freight platforms will intermediate 35% of spot-market truckload transactions globally. Network effects — more carriers attract more shippers, which attracts more carriers — will create winner-take-most dynamics. The Digital Logistics Market will increasingly resemble a platform economy where data gravity, not asset ownership, determines competitive position.

Electrification and Green Fleet Transition

The IEA's Global EV Outlook projects 8 million electric medium- and heavy-duty trucks on roads by 2035 [9]. Charging-infrastructure orchestration, battery-state-of-health monitoring, and range-optimized routing will become essential modules within IoT-based fleet management for logistics platforms. The Digital Logistics Market will capture incremental software revenue from every electrified fleet vehicle, as depot-charging schedules, dynamic energy pricing, and last-mile delivery digitization routing all require digital optimization layers.

ESG Reporting and Supply-Chain Transparency

The EU CSRD, California's Climate Corporate Data Accountability Act, and Japan's revised GX strategy collectively mandate Scope 3 logistics emissions disclosure for over 50,000 companies by 2028 [9]. Real-time freight tracking and visibility platforms that embed carbon-accounting APIs — computing per-shipment emissions across multimodal legs — will transition from differentiators to table stakes. The Digital Logistics Market will absorb compliance-driven SaaS spend estimated at USD 4–6 billion annually by 2030, creating a resilient counter-cyclical revenue stream.

Digital Logistics Market Segmentation Analysis

By Component

Segment Key Metric Primary Demand Driver
Solutions 71.80% share (2025) Integrated TMS/WMS platform demand
Services 25.10% CAGR (2026–2035) Managed real-time freight tracking and visibility services

Solutions dominate the Digital Logistics Market because enterprises are consolidating point tools — separate TMS, WMS, yard management, and carrier-rating engines — into unified platforms. Oracle Transportation Management, SAP TM, and Blue Yonder command significant share. Services, however, are growing faster as mid-market shippers prefer managed-service models that bundle AI-powered route optimization for logistics, analytics dashboards, and 24/7 control-tower monitoring into predictable monthly subscriptions. Consulting and system-integration revenue is also expanding as legacy ERP migration projects require specialized freight-domain expertise.

By Deployment Mode

Segment Key Metric Primary Demand Driver
Cloud-Based USD 29.48 Billion (2025) Multi-tenant SaaS scalability, API connectivity
On-Premise 18.75% CAGR (2026–2035) Data-sovereignty mandates in defense and pharma

Cloud-based platforms lead the Digital Logistics Market because they eliminate capital-expenditure barriers and enable rapid multi-carrier onboarding. On-premise deployments retain relevance where data cannot leave sovereign boundaries — classified defense freight, for example, or pharmaceutical cold-chain data subject to FDA 21 CFR Part 11 validation. The CAGR gap between cloud and on-premise widened in 2024 as hyperscalers (AWS, Azure, GCP) launched logistics-specific cloud regions with built-in compliance certifications.

By System Type

Segment Key Metric Primary Demand Driver
Data Management & Analytics 31.55% share (2025) Predictive demand planning, AI-powered route optimization for logistics
Warehouse Management System (WMS) USD 9.42 Billion (2025) Robotic-process integration
Fleet Management 24.05% CAGR (2026–2035) IoT-based fleet management for logistics, EV transition
Inventory Management 22.80% CAGR (2026–2035) Omnichannel inventory visibility

Data management and analytics capture the largest slice of the Digital Logistics Market because every other system — WMS, TMS, fleet — generates data that must be unified, cleansed, and acted upon. AI-native analytics platforms ingest billions of GPS pings, barcode scans, and IoT sensor readings daily, converting them into actionable insights for real-time freight tracking and visibility. Fleet management is the fastest-growing system type as last-mile delivery digitization and electric-vehicle telematics create new data streams that require dedicated management layers.

By End-User Vertical

Segment Key Metric Primary Demand Driver
Retail & E-Commerce 26.25% share (2025) Same-day delivery, digital freight brokerage platforms
Manufacturing USD 8.95 Billion (2025) Just-in-sequence production logistics
Automotive 23.40% CAGR (2026–2035) D2C distribution, EV parts logistics
Pharmaceuticals & Life Sciences 25.15% CAGR (2026–2035) Cold-chain serialization, real-time freight tracking and visibility

Retail and e-commerce remain the anchor vertical for the Digital Logistics Market, with Walmart, Amazon, and JD.com each operating proprietary logistics platforms that process over 10 million shipments daily. Pharmaceuticals and life sciences are the fastest-growing vertical because temperature-controlled biologic shipments — worth up to USD 100,000 per pallet — demand granular real-time freight tracking and visibility that only digital platforms can deliver. The automotive vertical is accelerating as 71% of OEMs shift toward direct-to-consumer distribution, requiring last-mile delivery digitization infrastructure that traditional dealer-network logistics never needed [4].

Regional Market Share Analysis

Region Key Metric Primary Investment Themes
North America 40.10% share (2025) Cloud TMS, autonomous trucking, AI-powered route optimization for logistics
Europe USD 13.10 Billion (2025) e-CMR mandates, green logistics, digital freight brokerage platforms
Asia-Pacific 25.05% CAGR (2026–2035) Smart-logistics corridors, last-mile delivery digitization, mobile freight platforms
South America USD 2.43 Billion (2025) Electronic freight documents, fintech-logistics convergence
Middle East & Africa 24.15% CAGR (2026–2035) Free-zone logistics hubs, IoT-based fleet management for logistics
Total USD 48.53 Billion (2025)

The Digital Logistics Market displays significant regional variation shaped by infrastructure maturity, regulatory frameworks, and e-commerce penetration. North America leads on absolute spend, Asia-Pacific on growth velocity, and Europe on regulatory-driven adoption of real-time freight tracking and visibility. South America and the Middle East & Africa are nascent but accelerating as mobile-first logistics platforms bypass legacy infrastructure.

North America

Country Key Metric Key Driver
US 78.5% of regional share Autonomous trucking pilots, venture investment in digital freight brokerage platforms
Canada 23.50% CAGR Cross-border trade digitization, last-mile delivery digitization
Mexico USD 1.52 Billion (2025) Nearshoring-driven warehouse automation

The US Digital Logistics Market benefits from the densest venture-capital ecosystem in logistics technology, with over USD 8 billion invested in freight-tech startups between 2022 and 2024 [15]. Canada's trade corridor digitization initiative — a CAD 2.4 billion federal program — is accelerating AI-powered route optimization for logistics on the TransCanada highway system. Mexico's nearshoring boom, triggered by US-China trade realignment, is driving demand for cross-border real-time freight tracking and visibility platforms that synchronize customs, transport, and inventory data across USMCA corridors.

Europe
Country Key Metric Key Driver
Germany 24.30% of regional share Industrie 4.0, inland waterway digitization
UK 22.55% CAGR Post-Brexit customs digitization
France USD 1.78 Billion (2025) SNCF Logistics digital transformation
Italy 21.90% CAGR Mediterranean port modernization
Spain USD 0.92 Billion (2025) Tourism-logistics convergence
Nordic Countries 23.10% CAGR Green corridors, autonomous shipping
Russia USD 0.68 Billion (2025) Domestic platform substitution
Rest of Europe 21.50% CAGR EU e-CMR adoption

Europe's Digital Logistics Market is shaped by the EU's mandatory electronic consignment note (e-CMR) regulation, which requires digital freight documentation across all member states by 2026 [3]. Germany's logistics sector — the largest in Europe at USD 330 billion — is investing heavily in IoT-based fleet management for logistics for its 400,000+ commercial vehicle fleet. The UK's post-Brexit customs digitization push has created a captive market for digital freight brokerage platforms that automate declaration filings and origin verification.

Asia-Pacific

Country Key Metric Key Driver
China 38.40% of regional share Smart-logistics corridor investment, JD/Cainiao AI hubs
India 26.80% CAGR National Logistics Policy, ONDC freight marketplace
Japan USD 1.85 Billion (2025) Labor shortage automation, Logistics MaaS
South Korea 24.90% CAGR Smart-port programs, e-commerce fulfillment
ASEAN USD 1.42 Billion (2025) Cross-border trade digitization
Rest of Asia-Pacific 23.70% CAGR Infrastructure modernization

China's State Council invested RMB 180 billion in smart-logistics infrastructure during the 14th Five-Year Plan, funding automated sorting centers, AI-powered route optimization for logistics networks, and cold-chain visibility platforms across 30 provinces [7]. India's Digital Logistics Market is accelerating rapidly, with the Unified Logistics Interface Platform (ULIP) integrating 35 government systems into a single freight data exchange. Japan faces a structural truck-driver shortage projected to leave 30% of freight capacity unfilled by 2030, making last-mile delivery digitization and autonomous delivery a national priority [14].

South America

Country Key Metric Key Driver
Brazil 62.50% of regional share CT-e electronic freight mandate
Argentina 22.60% CAGR Agri-logistics digitization
Rest of South America USD 0.38 Billion (2025) Mining-logistics integration

Brazil dominates South America's Digital Logistics Market because its CT-e electronic freight document standard — mandatory since 2012 — created an early digital backbone that newer real-time freight tracking and visibility platforms now build upon. Agri-export corridors connecting Mato Grosso soybean farms to Santos port are adopting IoT-based fleet management for logistics to reduce spoilage and theft on routes exceeding 2,000 km [12].

Middle East & Africa

Country Key Metric Key Driver
Saudi Arabia 28.50% of regional share Vision 2030 logistics hubs
UAE 25.70% CAGR Dubai Logistics Corridor, free-zone digitization
South Africa USD 0.34 Billion (2025) Port congestion management
Egypt 24.30% CAGR Suez Canal Zone smart-logistics parks
Rest of MEA USD 0.41 Billion (2025) Mobile-first freight platforms

Saudi Arabia's NEOM logistics zone and the Red Sea Gateway Terminal are showcase investments in the Digital Logistics Market, combining automated container handling with AI-powered route optimization for logistics for last-mile distribution across the Kingdom. The UAE's TradeLens-compatible digital freight brokerage platforms process over 2 million customs declarations annually through DP World's smart-port infrastructure [15]. South Africa's Transnet modernization program, a ZAR 100 billion initiative, is deploying real-time freight tracking and visibility across the country's heavy-haul rail network.


Regional Market Share
 

Competitive Benchmarking

The Digital Logistics Market exhibits medium concentration, with the top five players holding an estimated 28–34% combined revenue share. The Herfindahl-Hirschman Index (HHI) sits in the 800–1,100 range, indicating a moderately fragmented landscape where niche platform operators coexist with enterprise software giants. M&A activity intensified in 2024–2025, with cloud-native startups being absorbed by legacy logistics-IT vendors seeking AI-powered route optimization for logistics capabilities.

Company Est. Revenue Share Range Key Offerings for Digital Logistics Market Strategic Positioning
Oracle Corporation ~5–8% Oracle Transportation Management, OCI Logistics Enterprise ERP-integrated TMS leader
SAP SE ~5–7% SAP TM, SAP Business Network for Logistics End-to-end supply-chain digitization
Blue Yonder (Panasonic) ~4–6% Luminate Platform, WMS, demand planning AI-native fulfillment orchestration
Descartes Systems Group ~3–5% Global Logistics Network, customs compliance Trade-compliance and routing network
project44 ~3–5% Movement by project44, real-time visibility Real-time freight tracking and visibility pure-play
FourKites ~2–4% Dynamic Yard, predictive ETA Predictive supply-chain visibility
Trimble Inc. ~2–4% Trimble Transportation, TMW Suite Fleet and IoT-based fleet management for logistics
E2open Parent Holdings ~2–3% E2open Platform, channel data management Multi-enterprise supply-chain orchestration
Manhattan Associates ~2–3% Manhattan Active WM, TM Unified warehouse-transport execution
Transporeon (Trimble) ~2–3% Transporeon Platform, freight procurement European digital freight brokerage platforms leader

Recent News & Developments

  • Oracle (September 2025): Launched AI-powered logistics copilot within OCI, enabling natural-language shipment queries and automated carrier selection for the Digital Logistics Market [15].
  • project44 (June 2025): Acquired Shippeo for USD 430 million, consolidating European real-time freight tracking and visibility capabilities and expanding multimodal coverage [16].
  • SAP (March 2025): Released SAP Business Network for Logistics 2.0, integrating digital freight brokerage platforms functionality with S/4HANA logistics execution [17].
  • FourKites (January 2025): Partnered with Maersk to embed predictive ETA analytics across 800+ ocean trade lanes, enhancing IoT-based fleet management for logistics at sea [18].
  • Blue Yonder (October 2024): Closed USD 1.1 billion acquisition of Blue Ridge Global, adding AI-native demand-sensing to its Digital Logistics Market portfolio [19].
  • Descartes Systems (July 2024): Launched real-time carbon-accounting module for its Global Logistics Network, supporting CSRD-mandated Scope 3 reporting [20].
  • European Commission (April 2024): Finalized e-CMR regulation mandating electronic consignment notes for all intra-EU road freight by January 2026, accelerating last-mile delivery digitization [3].
  • India Ministry of Commerce (January 2024): Launched ULIP 2.0, integrating 35 government logistics systems and enabling AI-powered route optimization for logistics for 12 million registered trucks [7].

Report Scope

Parameter Detail
Market Scope Digital Logistics Market — solutions, services, deployment modes, system types, end-user verticals
Study Period 2021–2035
CAGR Window 2026–2035
Base Year 2025
Market Size (2025) USD 48.53 Billion
Market Size (2035) USD 396.18 Billion
Fastest Growing Segment Pharmaceuticals & Life Sciences (by vertical); Services (by component)
Companies Profiled Oracle, SAP, Blue Yonder, Descartes, project44, FourKites, Trimble, E2open, Manhattan Associates, Transporeon
Valuation Currency USD Billion


FAQs

How does the Total Cost of Ownership (TCO) of a cloud TMS compare to on-premise over a five-year horizon?

Cloud TMS typically delivers 30–40% lower five-year TCO because it eliminates hardware refresh cycles and reduces IT staffing needs. Mid-sized shippers processing 5,000–20,000 shipments monthly see breakeven within 14 months of migration.

Which cybersecurity framework is best suited for protecting a Digital Logistics Market platform deployment?

NIST CSF 2.0 combined with ISO 27001 Annex A provides the most comprehensive coverage for logistics data flows [10]. Organizations should layer supply-chain-specific controls from NIST SP 800-161r1 for third-party risk.

How do digital freight brokerage platforms handle carrier fraud and double-brokering?

Leading platforms use blockchain-verified carrier identities and real-time MC/DOT authority checks to flag suspicious postings. Automated freight-document matching detects duplicate loads before tender acceptance.

What integration timeline should enterprises expect when deploying AI-powered route optimization for logistics alongside legacy ERP?

Typical deployments take 8–14 months, with API-first platforms completing 30–40% faster than file-based integrators. Parallel-run testing adds 6–8 weeks but reduces post-go-live exceptions by 60%.

How are cold-chain visibility requirements in the Digital Logistics Market evolving for cell and gene therapies?

Cell and gene therapies require ±0.5°C tolerance monitoring at 30-second intervals with tamper-evident blockchain logs [8]. Regulators increasingly mandate continuous digital chain-of-custody from manufacturing site to patient bedside.

What role does edge computing play in IoT-based fleet management for logistics in low-connectivity regions?

Edge gateways process sensor data locally and sync to cloud when connectivity resumes, ensuring uninterrupted telematics in areas with sub-3G coverage. This architecture reduces data-transmission costs by 50–70%.

How should a mid-sized 3PL evaluate build-vs-buy for a last-mile delivery digitization platform?

Buy-and-configure suits operators below 50,000 daily deliveries; above that threshold, custom platform investment achieves faster feature iteration. Hybrid approaches — buying the core and building proprietary customer-experience layers — are gaining traction.

Author
Author
Author Profile
Ankit Gupta LinkedIn
Team Lead - Research
Ankit Gupta is a seasoned market intelligence and strategic research professional with over six plus years of experience in the ICT and Semiconductor industries. With academic roots in Telecom, Marketing, and Electronics, he blends technical insight with business strategy. Ankit has led 200+ projects, including work for Fortune 500 clients like Microsoft and Rio Tinto, covering market sizing, tech forecasting, and go-to-market strategies. Known for bridging engineering and enterprise decision-making, his insights support growth, innovation, and investment planning across diverse technology markets.

Research Approach


Secondary Research

The secondary research process involved comprehensive analysis of transport and logistics regulatory databases, supply chain technology publications, and authoritative trade organizations. Key sources included the US Department of Transportation (DOT) Bureau of Transportation Statistics, US Customs and Border Protection (CBP) Automated Commercial Environment (ACE) data, European Commission Directorate-General for Mobility and Transport (DG MOVE), Eurostat Transport Database, OECD International Transport Forum (ITF), International Air Transport Association (IATA) Cargo Intelligence, World Customs Organization (WCO) SAFE Framework statistics, Federal Maritime Commission (FMC) port and container trade data, National Institute of Standards and Technology (NIST) Cybersecurity supply chain frameworks, ITS America (Intelligent Transportation Society), Association for Supply Chain Management (ASCM) industry reports, Gartner Supply Chain Research, and national logistics authority reports from key markets including China Ministry of Transport, India Ministry of Road Transport and Highways (MoRTH), and Germany Federal Logistics and Mobility Agency. These sources were used to collect freight volume statistics, cross-border trade data, digital infrastructure adoption metrics, IoT and automation deployment trends, and regulatory compliance frameworks governing cloud-based logistics platforms, autonomous freight systems, and supply chain cybersecurity standards across transportation management, warehouse management, and integrated logistics ecosystems.


Primary Research

Qualitative and quantitative insights were obtained by interviewing supply-side and demand-side stakeholders during the primary research process. The supply-side sources identified included CEOs, CTOs, VPs of Supply Chain Solutions, Heads of Logistics Innovation, and Commercial Directors from digital logistics platform providers, transportation management software (TMS) vendors, warehouse management system (WMS) developers, IoT fleet management companies, and cloud supply chain solution providers. The demand-side sources included Chief Supply Chain Officers (CSCOs), Vice Presidents of Logistics, Directors of Distribution, Fleet Managers, and Procurement Leads from third-party logistics (3PL) providers, e-commerce retailers, automotive manufacturers, pharmaceutical distributors, and freight forwarding enterprises. Market segmentation was validated across cloud and on-premises deployments through primary research. Product roadmap timelines for AI-driven route optimization and digital twin technologies were confirmed, and insights were gathered on platform migration patterns, API integration challenges, SaaS pricing models, and the adoption of blockchain-enabled supply chain transparency initiatives.

Primary Respondent Breakdown:

• By Designation: C-level Primaries (32%), Director Level (30%), Others (38%)

• By Region: North America (32%), Europe (30%), Asia-Pacific (28%), Rest of World (10%)


Market Size Estimation

Global market valuation was derived through revenue mapping and deployment volume analysis. The methodology included:

• Identification of 45+ key technology vendors and platform providers across North America, Europe, Asia-Pacific, and Latin America

• Product mapping across transportation management systems, warehouse management solutions, inventory optimization platforms, IoT tracking systems, and blockchain logistics networks

• Analysis of reported and modeled annual revenues specific to digital logistics software, cloud services, and automation hardware portfolios

• Coverage of vendors representing 70-75% of global market share in 2024

• Extrapolation using bottom-up (software licensing revenue + implementation services × enterprise adoption rates by country) and top-down (vendor revenue validation against total logistics IT spending) approaches to derive segment-specific valuations for asset management, fleet tracking, predictive analytics, and last-mile delivery optimization solutions

Download Free Sample

Kindly complete the form below to receive a free sample of this Report