District Heating Market

Key Players: Fortum Corporation, Vattenfall AB, Danfoss A/S, E.ON SE, Veolia Environnement SA, Engie SA, Statkraft AS, Ørsted A/S

District Heating Market

District Heating Market Size, Share & Growth Analysis Report By Energy Source (Natural Gas, Biomass, Electricity, Waste Heat, Geothermal), By Implementation Type (New Construction, Retrofitting, Expansion), By End Use (Residential, Commercial, Industrial), By System Type (Combined Heat and Power, Single Energy Source, Multi-Energy Source) and By Regional (North America, Europe, South America, Asia Pacific, Middle East and Africa) - Trends & Industry Forecast to 2035
ID: MRFR/EnP/17708-CR
128 Pages
Chitranshi Jaiswal
Last Updated: June 22, 2026

District Heating Market Summary

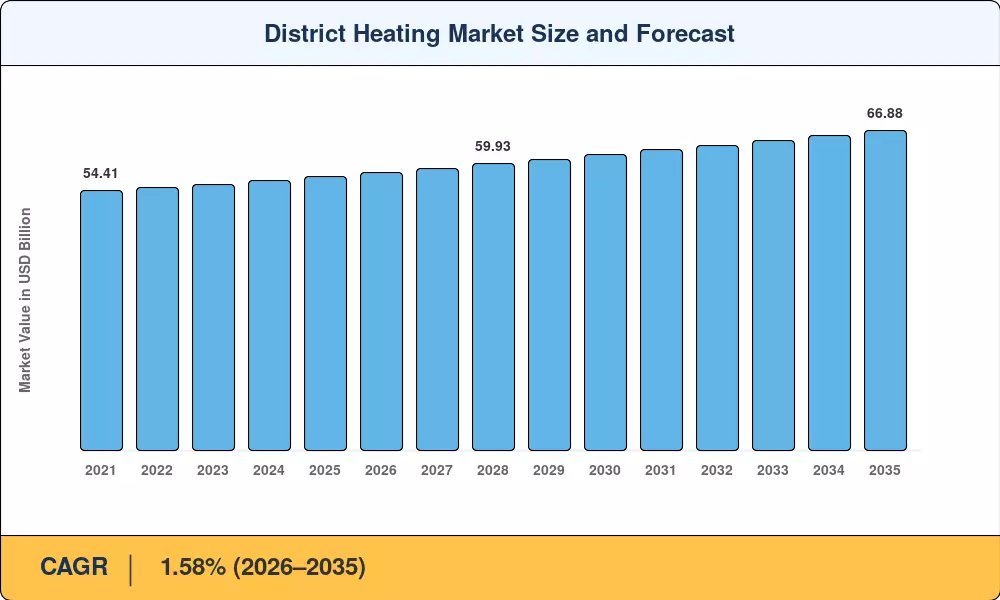
The District Heating Market was valued at USD 57.18 billion in 2025 and is projected to grow from USD 58.08 billion in 2026 to USD 66.88 billion by 2035, registering a CAGR of 1.58% during the forecast period (2026–2035). This steady expansion is rooted in two converging forces: the European Union's revised Energy Efficiency Directive mandating that member states develop national heating and cooling plans by 2026, and accelerating urbanization across Asia-Pacific cities where centralized thermal infrastructure displaces fragmented boiler installations [1]. Clean-heat mandates in Denmark, Sweden, and Finland — which collectively channel over USD 3.2 billion annually into heat-network upgrades — continue to anchor policy-driven demand [2].

A generational change in technology is taking place in the District Heating Market. The legacy high-temperature steam networks built around coal-fired boilers are being replaced by lower temperature hot water systems linked with waste-heat recovery, large-scale heat pumps and solar thermal arrays. In its 2024 World Energy Outlook, the IEA estimated that the total global investment in district energy infrastructure was over USD 18 billion in that year, with around 40% of the expenditure going towards renewable heat integration and digital load-balancing platforms [3]. This is not a change of degree but a change in the way operators monetize thermal assets.


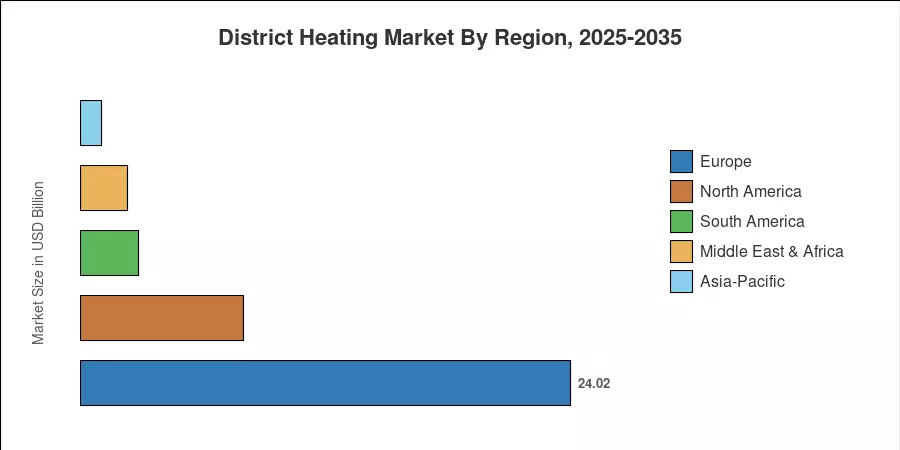
The District Heating Market in Europe took the highest share in 2025 with about 42% of the worldwide revenue, led by the established Scandinavian networks and the increasing refurbishments in Eastern Europe. Asia-Pacific is the fastest-growing market, with demand fuelled by urbanisation in China, South Korea and Japan, bringing heat-network building to new residential corridors. North America accounted for over 14% of the District Heating Market worldwide, with campus-scale systems and data-center heat-reuse pilots gaining momentum across the northern United States and Canada [4].


Key Report Takeaways

• By Plant Type

  • Combined Heat and Power (CHP) plants held approximately 57.1% of the District Heating Market share in 2025, reflecting the continued dominance of cogeneration assets in European and Chinese networks.
  • Waste-heat recovery units are forecast to register the fastest growth at a 4.89% CAGR through 2035, driven by industrial symbiosis programs and data-center heat capture.

• By Application

  • The residential segment captured roughly 57.4% of the District Heating Market in 2025, supported by mandatory connection policies in Nordic countries.
  • The industrial application segment is projected to grow at a 2.70% CAGR to 2035, fueled by process-heat electrification and decarbonization mandates in heavy industry.

• By Geography

  • Europe dominated the District Heating Market with the largest revenue share in 2025, underpinned by mature regulatory frameworks and extensive pipeline networks.
  • Asia-Pacific is forecast to register the quickest growth rate through 2035, led by large-scale urban heating projects in China and district cooling expansion in Southeast Asia.

Market Size and Forecast (2021–2035)

MRFR’s proprietary estimation framework combines firsthand interviews with utility operators and equipment OEMs, regulatory filings from national energy authorities and secondary statistics from IEA, Eurostat and BloombergNEF. Historical statistics (2021–2024) are reconciled against reported capital expenditures and linked building floor area; forecast figures (2026–2035) apply regression-adjusted demand modeling calibrated to national heating plans and fuel-price scenarios.

District Heating Market Size and Forecast
Our Impact
Enabled $4.3B Revenue Impact for Fortune 500 and Leading Multinationals
Partnering with 2000+ Global Organizations Each Year
30K+ Citations by Top-Tier Firms in the Industry

Driver Impact Analysis

Driver ~% Impact on CAGR Geographic Relevance Impact Timeline
EU clean-heat regulations and national heating plans +0.35 Europe Short-term (≤2 yr)
Urbanization-led heating demand in the Asia-Pacific +0.30 Asia-Pacific Medium-term (2–4 yr)
Data-center waste-heat reuse programs +0.20 Global Medium-term (2–4 yr)
Industrial decarbonization mandates +0.18 Europe, North America Long-term (≥4 yr)
Heat-pump cost reductions and technology scaling +0.15 Global Medium-term (2–4 yr)
Carbon-pricing mechanisms (EU ETS, national schemes) +0.12 Europe, Asia-Pacific Long-term (≥4 yr)
Digital optimization and predictive load management +0.10 Global Short-term (≤2 yr)


EU Clean-Heat Regulations

The EU's revised Energy Efficiency Directive (2023/1791) requires all member states to submit comprehensive heating and cooling assessments and develop plans for efficient district heating by 2026. Denmark's Climate Act targets a 70% emissions reduction by 2030, channeling approximately EUR 1.8 billion into heat-network decarbonization between 2024 and 2028 [1]. This regulatory push directly expands the addressable District Heating Market in Western and Northern Europe, compelling municipal utilities to accelerate fossil-fuel phase-outs in existing networks.

Asia-Pacific Urbanization

China's 14th Five-Year Plan allocated approximately CNY 450 billion (USD 63 billion) to urban heating infrastructure in northern provinces through 2025, with continued commitments expected through 2030 [11]. South Korea's District Heating Corporation is investing KRW 2.3 trillion in network extensions to serve 1.5 million additional households by 2028. These capital commitments are reshaping the District Heating Market in Asia-Pacific, creating large-scale greenfield opportunities that Western markets — with their brownfield refurbishment focus — cannot match.

Data-Center Heat Reuse

Global data-center electricity consumption reached an estimated 460 TWh in 2024, and roughly 95% of that energy is eventually dissipated as heat [18]. Projects in Stockholm, Helsinki, and Dublin are already piping server-farm waste heat into district networks, displacing natural gas consumption. Microsoft's agreement with Fortum in Finland captures up to 60 MW of thermal energy for the Espoo district heating grid, establishing a replicable template that could add over USD 1.2 billion in addressable demand for the District Heating Market by 2030 [18].

Carbon Pricing

The EU Emissions Trading System (ETS) carbon price exceeded EUR 65 per tonne in 2024, directly increasing the operating cost of gas- and coal-fired heat-only boilers [12]. At this price level, heat pumps and waste-heat recovery installations achieve cost parity with fossil-fuel generation in most Northern European networks. The extension of carbon pricing to buildings under the EU's ETS-2 framework, expected by 2027, will intensify the economic case for transitioning existing District Heating Market assets toward lower-emission heat sources.

Restraints Impact Analysis

Restraint ~% Impact on CAGR Geographic Relevance Impact Timeline
High upfront infrastructure capital costs –0.25 Global Long-term (≥4 yr)
Natural-gas price volatility –0.18 Europe, Asia-Pacific Short-term (≤2 yr)
Aging pipeline networks require costly refurbishment –0.15 Europe, North America Medium-term (2–4 yr)
Regulatory fragmentation across municipalities –0.12 North America, MEA Long-term (≥4 yr)
Competition from individual heat-pump installations –0.10 Europe, North America Medium-term (2–4 yr)


High Capital Costs

Greenfield district heating network construction in urban settings typically costs between EUR 800 and EUR 1,500 per meter of pipeline in developed markets, with total project costs for a medium-sized city network reaching EUR 200–500 million [19]. These capital requirements create significant barriers for municipalities with constrained balance sheets, particularly in emerging economies where subsidized natural gas or electricity keeps end-user heating costs artificially low. The long payback periods — often exceeding 15 years — deter private investors absent government guarantees or concessional financing, constraining the District Heating Market expansion in regions without established public-private partnership frameworks.

Competition from Building-Level Heat Pumps

Air-source heat pump unit costs dropped roughly 30% between 2020 and 2024, and the IEA projects installed capacity will triple by 2030 [22]. In markets like Germany and the UK, individual building-level heat pumps compete directly with district heating connections for the same decarbonization policy support. Where building-stock density is low — suburban developments, rural communities — the economics increasingly favor distributed solutions over centralized networks, limiting the addressable District Heating Market to high-density urban cores and mixed-use developments.

District Heating Market Opportunities

Industrial Symbiosis and Waste-Heat Monetization

Industrial facilities — steelworks, chemical plants, refineries — release enormous volumes of low-grade heat that district heating networks can capture. The EU Industrial Emissions Directive revision encourages large emitters to explore heat-recovery partnerships, and pilot programs in the Netherlands and Belgium have demonstrated payback periods under six years for waste-heat capture infrastructure [10]. Scaling this model across European industrial corridors could unlock over USD 4 billion in incremental District Heating Market revenue by 2032.

Emerging-Market Network Development

Countries across Southeast Asia, the Middle East, and Latin America are urbanizing rapidly yet lack centralized heating or cooling infrastructure. District cooling — a close cousin of heating networks — is gaining traction in the Gulf States, with investments exceeding USD 2 billion in the UAE and Saudi Arabia. Transferring European engineering expertise to these markets through joint ventures represents a significant growth vector for the District Heating Market.

Digital Twin and Predictive Analytics Platforms

Network operators deploying digital twins — virtual replicas of their pipeline infrastructure — report 12–18% reductions in thermal losses and 8–10% fuel savings [13]. Companies like Danfoss and Kamstrup are commercializing cloud-based analytics suites that integrate real-time sensor data with weather forecasting and demand prediction models. The digital overlay transforms asset management from reactive maintenance to predictive optimization, creating recurring software-revenue streams within the District Heating Market.

Seasonal Thermal Energy Storage

Large-scale pit and borehole thermal storage systems — pioneered in Denmark's Vojens and Dronninglund projects — allow summer solar heat to be stored for winter delivery. The European Commission's Horizon Europe program has earmarked EUR 350 million for seasonal storage R&D through 2027 [16]. Successful commercialization would dramatically improve the economics of solar-integrated district heating and reduce reliance on peak-load gas boilers.

Cross-Border Heat Trade

Scandinavian countries are exploring regulatory frameworks for transnational heat exchange — allowing surplus geothermal energy from Iceland or biomass heat from Finland to be traded across interconnected networks. While still nascent, these frameworks mirror the architecture of electricity interconnectors and could expand the addressable District Heating Market beyond national boundaries.

District Heating Market Future Outlook

AI-Driven Network Operations

Artificial intelligence is moving from pilot to production in district heating operations. Machine-learning algorithms that optimize supply temperatures in real time — adjusting for weather, occupancy patterns, and electricity-market price signals — can reduce fuel consumption by 10–15% without sacrificing comfort [13]. By 2030, the IEA projects that over 40% of European district networks will incorporate some form of AI-based dispatch optimization, transforming the operational economics of the District Heating Market and creating a new competitive dimension around software capability [3].

Electrification and Sector Coupling

The electrification of heating — through large-scale heat pumps drawing power from renewable-rich grids — represents the most significant structural shift for the District Heating Market in the coming decade. IRENA estimates that electricity-based heat supply in district networks could quadruple between 2025 and 2035, displacing natural-gas CHP plants as the marginal generation technology [24]. Sector coupling — linking electricity, heat, and transport networks through shared storage and flexible demand — positions district heating operators as active participants in power-market balancing rather than passive fuel consumers.

ESG Reporting and Green-Bond Financing

Growing scrutiny from institutional investors and regulators on Scope 1 and Scope 2 emissions is accelerating the decarbonization timeline for district heating assets. The EU's Corporate Sustainability Reporting Directive (CSRD) requires large heat utilities to disclose granular emissions data from 2025 onward [25]. Green-bond issuance for district heating infrastructure reached USD 4.8 billion globally in 2024, and this financing channel is expected to grow as operators develop bankable transition plans tied to science-based targets. The District Heating Market is increasingly shaped by capital-market expectations as much as engineering fundamentals.

Hydrogen Blending and Synthetic Fuels

Hydrogen admixture in gas-fired district heating networks is advancing from laboratory trials to field demonstrations. Projects in the Netherlands (HyDelta) and Germany (H2 Wärmewende) are testing 20–30% hydrogen blends in existing pipeline infrastructure [14]. While full hydrogen conversion remains economically challenging at current production costs, blending offers a transitional pathway that extends the useful life of gas-based CHP assets while reducing carbon intensity. Synthetic methane derived from green hydrogen and captured CO₂ represents a longer-term option that could maintain the operational paradigm of the District Heating Market without the emissions profile.

District Heating Market Segmentation

By Plant Type

Segment Key Metric Primary Demand Driver
Combined Heat and Power (CHP) ~57.1% share (2025) Fuel efficiency and grid revenue
Boiler Plant USD 19.44 Billion (2025) Legacy infrastructure replacement cycles
Waste-Heat Recovery 4.89% CAGR (2026–2035) Industrial symbiosis and data-center heat capture


CHP plants remained the backbone of the District Heating Market in 2025, supplying heat and electricity simultaneously from a single fuel input. European networks — particularly in Germany, Poland, and the Baltic states — rely heavily on gas-fired CHP units that benefit from both thermal revenue and electricity-market participation. The efficiency advantage of cogeneration (typically 80–90% fuel utilization vs. 40–55% for separate heat and power generation) sustains CHP's dominant position even as policy pressure mounts against fossil-fuel dependency.

Waste-heat recovery is the standout growth segment in the District Heating Market. Industrial facilities, data centers, and wastewater treatment plants generate surplus thermal energy that can be captured and fed into heat networks at minimal marginal fuel cost. Stockholm's open district heating platform — which purchases waste heat from over 80 commercial sources — serves as the global benchmark for this model and has been replicated in Helsinki, Oslo, and Amsterdam [18].

By Heat Source

Segment Key Metric Primary Demand Driver
Natural Gas ~47.2% share (2025) Established CHP infrastructure base
Coal USD 8.00 Billion (2025) Eastern European and Chinese legacy plants
Renewables (biomass, geothermal, solar) 5.80% CAGR (2026–2035) Decarbonization mandates
Oil & Others 0.92% CAGR (2026–2035) Declining share in mature markets


Natural gas continues to dominate the heat-source mix of the District Heating Market, providing the primary fuel for CHP and heat-only boiler plants across Europe, China, and North America. Coal retains a significant position in Chinese northern heating systems and in Polish and Czech networks, though phase-out timelines are accelerating under climate commitments. The renewables segment — encompassing biomass, geothermal, and solar thermal — is growing fastest as Scandinavian networks achieve 70–90% renewable heat shares and serve as demonstration models for the rest of Europe [2].

By Application

Segment Key Metric Primary Demand Driver
Residential ~57.4% share (2025) Mandatory connection policies in dense urban areas
Commercial USD 14.87 Billion (2025) Office, retail, and institutional building demand
Industrial 2.70% CAGR (2026–2035) Process-heat decarbonization requirements


The residential segment commands the largest share of the District Heating Market, reflecting the fundamental role of space heating and domestic hot-water supply in consumer energy budgets. Mandatory connection policies in cities like Copenhagen, Helsinki, and Vilnius ensure high residential uptake rates. The industrial segment, while smaller, is growing faster as manufacturing plants seek low-carbon process heat to meet regulatory and customer-driven sustainability expectations.

By Distribution Temperature Tier

Segment Key Metric Primary Demand Driver
High-Temperature (>100 °C) ~48.5% share (2025) Legacy steam networks and heavy industrial demand
Low-Temperature (50–100 °C) USD 22.30 Billion (2025) Modern hot-water networks and building retrofits
Ultra-Low-Temperature (<50 °C) 3.85% CAGR (2026–2035) Heat-pump integration and new-build developments


High-temperature networks still serve the majority of connected load in the District Heating Market, but the trend is unmistakably toward lower supply temperatures. Reducing network temperatures from 120 °C to 70 °C can cut distribution losses by 30–40% and enable the integration of low-grade renewable and waste-heat sources that cannot supply high-temperature steam [16]. Ultra-low-temperature systems — operating below 50 °C — are emerging in new-build residential developments where well-insulated buildings and underfloor heating allow effective heat delivery at ambient-plus temperatures.

Regional Market Share Analysis

Region Key Metric Primary Investment Themes
North America ~14.0% share (2025) Campus systems, data-center heat reuse
Europe ~42.0% share (2025) Decarbonization, pipeline refurbishment
Asia-Pacific 1.82% CAGR (2026–2035) Urban expansion, CHP capacity additions
South America USD 2.86 Billion (2025) Emerging municipal pilots
Middle East & Africa USD 2.29 Billion (2025) District cooling crossover
Total USD 57.18 Billion (2025)

The District Heating Market exhibits pronounced regional concentration, with Europe and Asia-Pacific collectively accounting for over three-quarters of global revenue. Infrastructure maturity, heating-degree-day profiles, and regulatory support shape regional trajectories.


North America

Country Key Metric Key Driver
US ~68% of regional share University and hospital campus networks
Canada 1.72% CAGR Federal clean-heat incentive programs
Mexico USD 0.40 Billion Industrial zone pilot systems


North America's District Heating Market is anchored by institutional campus networks in the United States — university systems, military installations, and hospital complexes operating legacy steam loops. Canada's federal government allocated CAD 800 million through the Green Infrastructure Fund to support community-scale heating projects between 2024 and 2028 [4]. Mexico's participation remains limited but growing, with industrial zones in Monterrey and Guadalajara exploring cogeneration-linked heat distribution for manufacturing clusters.

Europe

Country Key Metric Key Driver
Germany ~18% of regional share Energiewende heat-transition policy
UK 2.10% CAGR Heat Network Zoning legislation
France USD 2.52 Billion Réseaux de chaleur expansion program
Italy 1.65% CAGR Po Valley urban heating modernization
Spain USD 0.84 Billion Barcelona district cooling integration
Nordic Countries ~26% of regional share Mature biomass and geothermal networks
Russia USD 3.36 Billion Centralized Soviet-era infrastructure
Rest of Europe 1.48% CAGR EU cohesion fund-supported projects


Europe remains the anchor of the global District Heating Market. Denmark derives over 65% of its building heat from district networks, and Sweden and Finland maintain similarly high penetration rates [2]. Germany's revised Building Energy Act (GEG) requires municipalities with over 100,000 residents to publish heat-planning roadmaps by mid-2026, catalyzing network investments in Hamburg, Munich, and Berlin. The UK's Energy Act 2023 introduced heat-network zoning powers that allow local authorities to designate areas where new buildings must connect to district systems, creating a regulatory catalyst that did not previously exist in British heating policy [21].

Asia-Pacific

Country Key Metric Key Driver
China ~62% of regional share Northern urban heating mandates
India USD 0.42 Billion Industrial cluster heating pilots
Japan 1.74% CAGR Earthquake-resilient energy infrastructure
South Korea USD 3.15 Billion Korea District Heating Corporation expansion
ASEAN 1.90% CAGR District cooling in tropical cities
Rest of Asia-Pacific USD 0.63 Billion Emerging institutional networks


Asia-Pacific is the fastest-growing region in the District Heating Market. China operates the world's largest district heating system by connected area, with over 15 billion square meters of heated floor space served by municipal networks across northern cities [7]. South Korea's District Heating Corporation supplies approximately 1.8 million households and is extending pipelines to satellite cities around Seoul and Busan. Japan's focus on earthquake-resilient energy systems has driven investments in decentralized cogeneration-linked heating networks, particularly in Tokyo's Marunouchi and Roppongi districts.

South America

Country Key Metric Key Driver
Brazil ~52% of regional share Industrial cogeneration in São Paulo
Argentina 1.38% CAGR Gas-linked municipal heating pilots
Rest of South America USD 0.66 Billion Nascent infrastructure


South America's District Heating Market is embryonic, with most activity concentrated in Brazil's industrial cogeneration sector. São Paulo's industrial parks and university campuses represent the primary demand centers. Argentina's abundant natural-gas reserves provide a low-cost heat source, though municipal-scale network development has been constrained by macroeconomic instability and limited public-sector investment capacity.

Middle East & Africa

Country Key Metric Key Driver
Saudi Arabia ~32% of regional share NEOM and the giga-project district cooling
UAE 1.95% CAGR Dubai and Abu Dhabi district cooling mandates
South Africa USD 0.23 Billion Industrial process-heat recovery
Egypt 1.42% CAGR New Administrative Capital district systems
Rest of MEA USD 0.34 Billion Emerging demand


The Middle East & Africa segment of the District Heating Market is driven primarily by district cooling rather than traditional heating, given the region's climate profile. Saudi Arabia's NEOM project incorporates an integrated district cooling network estimated at USD 1.5 billion in infrastructure value. The UAE mandates district cooling connections for new developments in designated zones across Dubai and Abu Dhabi, creating a regulatory pull that mirrors European heating-connection mandates but for the opposite thermal service [23].

District Heating Market By Region, 2025-2035

Competitive Benchmarking

The District Heating market is moderately concentrated, with the top five companies projected to account for about 28-35% of worldwide revenues. The Herfindahl-Hirschman Index (HHI) is in the 600-900 range, reflecting a fragmented landscape where municipal utilities, national energy firms and specialist equipment providers co-exist. Competition is local – market access is based on concession agreements, regulatory ties and installed base advantages, not on worldwide brand recognition alone.

Company Est. Revenue Share Range Key Offerings for the District Heating Market Strategic Positioning
Fortum Corporation ~5–8% CHP plants, open district heating platforms Nordic market leader; waste-heat aggregation pioneer
Vattenfall AB ~4–7% Heat networks, biomass CHP, heat pumps Integrated utility with a fossil-free heat target by 2030
Danfoss A/S ~3–5% Substations, controls, smart-grid components Technology supplier across the value chain
E.ON SE ~4–6% District heating operations, network management Large installed base in Germany and Sweden
Veolia Environnement SA ~3–5% Network operations, energy-from-waste plants Global services model with PPP expertise
Engie SA ~3–5% CHP, geothermal networks, digital platforms Diversified energy group with heating portfolio
Statkraft AS ~2–4% Renewable district heating, biomass plants Norwegian state-owned, hydropower-linked heat
Ørsted A/S ~2–4% Biomass CHP, green hydrogen pilot heating Transitioning from fossil to renewable heat
Kamstrup A/S ~2–3% Smart metering, ultrasonic flow sensors Data-layer provider for network optimization
Alfa Laval AB ~2–3% Heat exchangers, plate technology Component specialist with global distribution
Ramboll Group A/S ~1–2% Engineering consultancy, network design Advisory and design services for greenfield projects
Logstor A/S ~1–2% Pre-insulated pipe systems Pipeline infrastructure supplier


Recent News & Developments

  • Fortum Corporation (March 2025): Commissioned a 60 MW waste-heat capture system at a data-center facility in Espoo, Finland, integrating server-farm thermal energy into the city's district heating grid — one of Europe's largest such installations [18].
  • Vattenfall AB (January 2025): Announced a EUR 750 million investment plan to decarbonize its Berlin district heating network by 2030, including large-scale heat-pump installations at the Reuter West and Klingenberg sites [20].
  • UK Department for Energy Security (November 2024): Published Heat Network Zoning regulations under the Energy Act 2023, granting local authorities in England the power to designate zones where buildings must connect to district heating networks [21].
  • Danfoss A/S (September 2024): Launched its Leanheat AI 3.0 platform, offering cloud-based predictive optimization for district heating substations and promising 10–15% energy savings for network operators [13].


  • European Commission (March 2024): Approved EUR 2.1 billion in state-aid packages across eight member states for district heating decarbonization projects under the REPowerEU framework [1].


  • Stockholm Exergi (August 2023): Broke ground on a bioenergy carbon capture and storage (BECCS) facility integrated with its biomass-fired district heating plant, targeting negative emissions of 800,000 tonnes of CO₂ annually by 2026 [2].

District Heating Market Report Scope

Parameter Details
Market Scope Global District Heating Market — Plant Type, Heat Source, Application, Distribution Temperature Tier, Region
Study Period 2021–2035
CAGR 1.58% (2026–2035)
Market Size (2025) USD 57.18 Billion
Market Size (2035) USD 66.88 Billion
Fastest Growing Segments Waste-heat recovery (by plant type); Renewables (by heat source); Asia-Pacific (by region)
Companies Profiled 12 (Fortum, Vattenfall, Danfoss, E.ON, Veolia, Engie, Statkraft, Ørsted, Kamstrup, Alfa Laval, Ramboll, Logstor)
Valuation Currency USD Billion


FAQs

What is the typical payback period for a new district heating connection in a European city?

Payback periods range from 8 to 18 years, depending on network density, heat source, and local subsidy levels. Scandinavian cities with high connection rates achieve shorter paybacks than greenfield projects in Southern Europe [19].

How does the District Heating Market differ for retrofitted buildings versus new construction?

New buildings integrate low-temperature connections at minimal incremental cost. Retrofits require substation upgrades, pipe rerouting, and radiator modifications, typically adding 25–40% to connection costs [19].

What role does geothermal energy play in district heating outside Iceland?

Paris operates Europe's largest geothermal district heating network, serving over 250,000 housing equivalents from Dogger aquifer wells. Munich and The Hague are scaling similar deep-geothermal projects [8].

How do concession models affect competitive dynamics in the District Heating Market?

Most European networks operate under 15-to-30-year municipal concessions, creating high barriers to entry and limited competitive switching. New entrants typically access the District Heating Market through concession renewals or greenfield developments [19].

What cybersecurity risks exist for digitally controlled district heating networks?

SCADA and IoT-enabled control systems face growing exposure to ransomware and operational-technology attacks. EU NIS2 directive mandates cybersecurity risk assessments for critical energy infrastructure operators by 2025 [12].

Can district heating networks also provide cooling services?

Yes — dual-purpose networks supplying both heating and cooling operate in cities like Helsinki, Copenhagen, and Dubai. Absorption chillers or separate chilled-water loops enable summer cooling from the same infrastructure [23].

How does the District Heating Market address heat poverty in low-income communities?

Several European cities — Vienna, Copenhagen, and Warsaw — operate regulated tariff structures that cap residential heating costs below market rates. Social-housing connection mandates ensure equitable access to affordable heat [1].    
Author
Author
Author Profile
Chitranshi Jaiswal LinkedIn
Team Lead - Research
Chitranshi is a Team Leader in the Chemicals & Materials (CnM) and Energy & Power (EnP) domains, with 6+ years of experience in market research. She leads and mentors teams to deliver cross-domain projects that equip clients with actionable insights and growth strategies. She is skilled in market estimation, forecasting, competitive benchmarking, and both primary & secondary research, enabling her to turn complex data into decision-ready insights. An engineer and MBA professional, she combines technical expertise with strategic acumen to solve dynamic market challenges. Chitranshi has successfully managed projects that support market entry, investment planning, and competitive positioning, while building strong client relationships. Certified in Advanced Excel & Power BI she leverages data-driven approaches to ensure accuracy, clarity, and impactful outcomes.

Research Approach

Secondary Research

The secondary research process involved comprehensive analysis of regulatory databases, energy policy publications, utility industry reports, and authoritative environmental organizations. Key sources included the International Energy Agency (IEA), European Environment Agency (EEA), US Environmental Protection Agency (EPA), US Energy Information Administration (EIA), Eurostat Energy Database, International District Energy Association (IDEA), Euroheat & Power, UNEP District Energy in Cities Initiative, International Renewable Energy Agency (IRENA), European Heat Pump Association (EHPA), Danish Energy Agency, Swedish Energy Agency, German Federal Ministry for Economic Affairs and Energy (BMWi), UK Department for Business, Energy & Industrial Strategy (BEIS), and national energy ministry reports from key markets. These sources were used to collect district heating capacity statistics, regulatory policy data, renewable energy integration trends, infrastructure investment flows, carbon emission reduction metrics, and market landscape analysis for combined heat and power systems, biomass-fired plants, geothermal networks, waste heat recovery systems, and natural gas-based district heating technologies.

Primary Research

In order to gather both qualitative and quantitative insights, supply-side and demand-side stakeholders were interviewed during the primary research process. CEOs, vice presidents of business development, chief technology officers, and heads of regulatory affairs from district heating network operators, energy utilities, equipment producers, and engineering contractors were examples of supply-side sources. Municipal energy planners, facility managers from commercial and industrial complexes, housing association representatives, sustainability directors, and procurement leaders from large-scale industrial facilities, municipal governments, and residential developers were among the demand-side sources. Primary research obtained information on technology adoption patterns, tariff structures, regulatory compliance costs, and financing mechanisms for new construction versus retrofitting projects. It also verified infrastructure project pipelines and modernization timelines and validated market segmentation across energy sources and system types.

Primary Respondent Breakdown:

By Designation: C-level Primaries (38%), Director Level (25%), Others (37%)

By Region: North America (32%), Europe (35%), Asia-Pacific (25%), Rest of World (8%)

Market Size Estimation

Global market valuation was derived through capacity mapping and infrastructure investment analysis. The methodology included:

Identification of 50+ key district heating operators and utility companies across North America, Europe, Asia-Pacific, Latin America, and Middle East & Africa

Technology mapping across natural gas-fired CHP, biomass combustion, geothermal systems, waste heat recovery, electric heat pumps, and hybrid multi-energy source configurations

Analysis of reported and modeled annual revenues specific to district heating network operations and equipment supply

Coverage of operators and manufacturers representing 75-80% of global installed capacity and market share in 2024

Extrapolation using bottom-up (heat sales volume × average tariff by country/region) and top-down (operator revenue validation) approaches to derive segment-specific valuations for new construction, retrofitting, and network expansion projects

Download Free Sample

Kindly complete the form below to receive a free sample of this Report

Download PDF ×

We do not share your information with anyone. However, we may send you emails based on your report interest from time to time. You may contact us at any time to opt-out.