SEGMENTATION QUICK REFERENCE
| Dimension | Sub-Segments | Dominant Segment | Fastest Growing Segment |
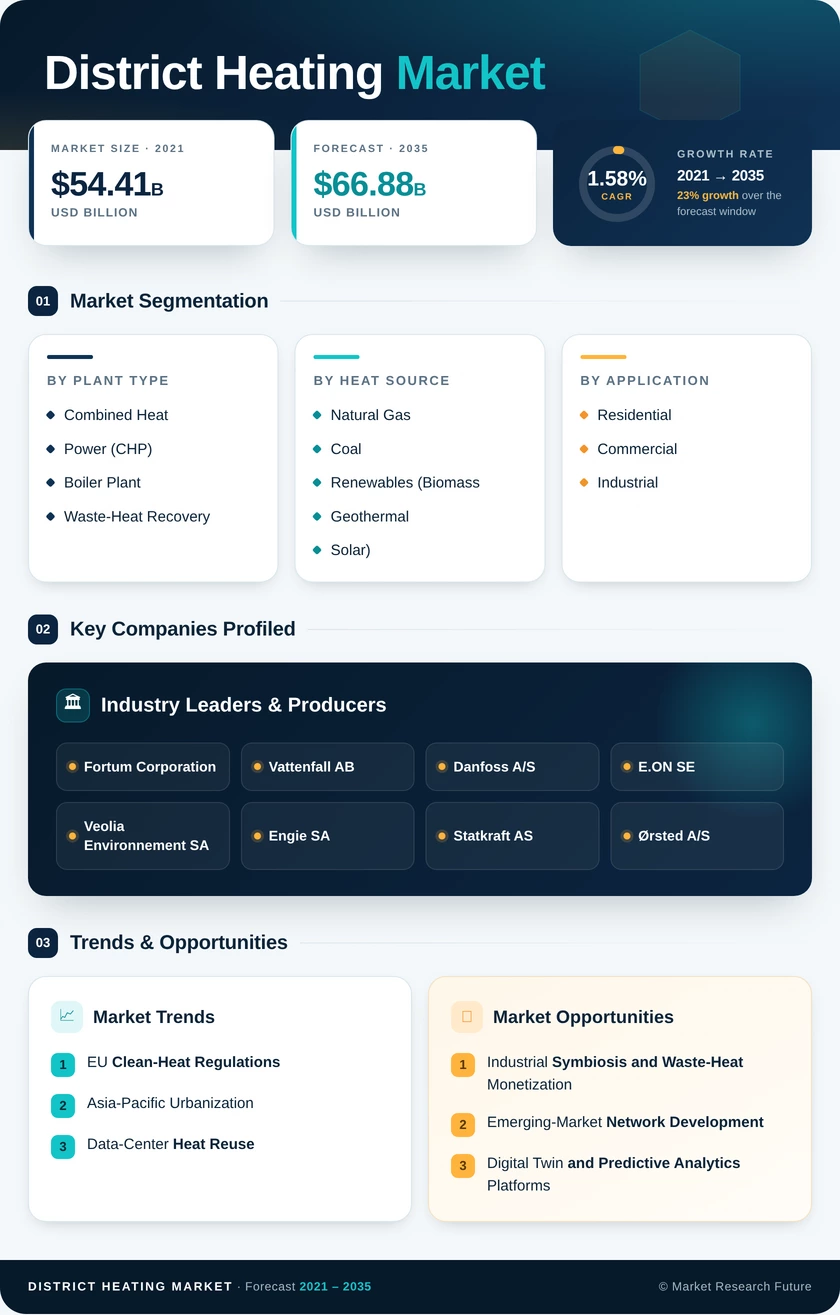
| By Plant Type | Combined Heat and Power (CHP); Boiler Plant; Waste-Heat Recovery | Combined Heat and Power (CHP) | Waste-Heat Recovery |
| By Heat Source | Natural Gas; Coal; Renewables (Biomass, Geothermal, Solar); Oil & Others | Natural Gas | Renewables |
| By Application | Residential; Commercial; Industrial | Residential | Industrial |
| By Distribution Temperature Tier | High-Temperature (>100 °C); Low-Temperature (50–100 °C); Ultra-Low-Temperature (<50 °C) | High-Temperature | Ultra-Low-Temperature |
MARKET SEGMENTATION OVERVIEW
By Plant Type
| Sub-Segment | Key Trend |
| Combined Heat and Power (CHP) | Fuel-switching from coal to gas and biomass; revenue diversification via electricity-market participation. |
| Boiler Plant | Legacy replacement cycles are driving modernization to condensing and modular designs. |
| Waste-Heat Recovery | Data-center heat capture and industrial symbiosis creating new feedstock streams |
Combined Heat and Power plants remain the primary generation asset class in district heating, delivering both thermal and electrical output from a single fuel stream. CHP dominance is sustained by dual-revenue economics and high installed-base inertia across European and Chinese networks. Waste-heat recovery is the segment attracting the most new capital as industrial operators and data-center developers seek to monetize thermal by-products that were previously vented to the atmosphere.
By Heat Source
| Sub-Segment | Key Trend |
| Natural Gas | Continued CHP reliance with growing pressure from carbon pricing and electrification |
| Coal | Accelerating phase-out in the EU and OECD; persistence in China and Eastern Europe. |
| Renewables (Biomass, Geothermal, Solar) | Policy-driven rapid expansion; Scandinavian benchmark models scaling to continental Europe |
| Oil & Others | Marginal and declining share; primarily in legacy island and remote systems |
Natural gas retains the largest share of the fuel mix but faces structural headwinds as carbon-pricing escalation and renewable-heat mandates shift investment priorities. Renewables — encompassing biomass, geothermal, and solar thermal — are growing fastest, with Denmark and Sweden demonstrating that 80–90% renewable heat shares are commercially achievable in mature networks.
By Application
| Sub-Segment | Key Trend |
| Residential | Mandatory connection policies in high-density urban zones; metering modernization |
| Commercial | Office, retail, and institutional buildings seeking green-lease compliance |
| Industrial | Process-heat decarbonization and waste-heat exchange are driving adoption. |
Residential heating dominates district network demand by volume, driven by space-heating and hot-water requirements in cold-climate urban centers. Industrial applications are growing faster from a smaller base as manufacturing facilities pursue low-carbon process heat to satisfy regulatory and supply-chain sustainability requirements.
By Distribution Temperature Tier
| Sub-Segment | Key Trend |
| High-Temperature (>100 °C) | Legacy steam networks serving industrial loads and older building stock |
| Low-Temperature (50–100 °C) | Modern hot-water networks enabling broader heat-source integration |
| Ultra-Low-Temperature (<50 °C) | New-build developments with high-performance insulation and heat-pump boosters |
The temperature transition from high-temperature steam to low- and ultra-low-temperature hot-water systems is the defining infrastructure shift in district heating. Lower supply temperatures reduce distribution losses, expand the range of usable heat sources, and align with building-stock energy-efficiency improvements, positioning networks for long-term relevance in a decarbonized energy system.