Drones and Aerial Inspection Services Market

Drones and Aerial Inspection Services Market Research Report By End Use (Government, Commercial, Industrial, Agriculture, Energy), By Drone Type (Fixed Wing, Multirotor, Hybrid, Single Rotor, Nano), By Technology (Thermal Imaging, LiDAR, Optical Imaging, Ultrasonic Testing, Multispectral Imaging), By Application (Infrastructure Inspection, Agricultural Monitoring, Energy Sector Inspection, Environmental Monitoring, Construction Site Surveying), By Service Type (Data Collection, Data Analysis, Consultation Services, Training Services, Maintenance Services) And By Region (North America, Europe, Asia-Pacific, And Rest Of The World) – Market Forecast Till 2035.

Forecast Period
2025 - 2035
CAGR
6.66%
2024 Market Size
$ 9.1 Billion
2035 Market Size
$ 18.5 Billion
MRO ● Updated April 8, 2026 Report ID: MRFR/MRO/64728-HCR | Pages: 200 | Author: Shubham Munde

Drones and Aerial Inspection Services Market Summary

As per MRFR analysis, the Drones and Aerial Inspection Services Market was estimated at 9.1 USD Billion in 2024. The Drones and Aerial Inspection Services industry is projected to grow from 9.71 USD Billion in 2025 to 18.5 USD Billion by 2035, exhibiting a compound annual growth rate (CAGR) of 6.66% during the forecast period 2025 - 2035.

Key Market Trends & Highlights

The Drones and Aerial Inspection Services Market is experiencing robust growth driven by technological advancements and increasing regulatory support.

  • Technological integration is enhancing operational efficiency across various sectors, particularly in North America.
  • A growing focus on sustainability is influencing the adoption of drones for environmental monitoring and compliance.
  • Regulatory adaptation is facilitating broader acceptance and use of drones in commercial applications, especially in infrastructure inspection.
  • Key market drivers include technological advancements and cost efficiency, which are propelling growth in both the infrastructure inspection and agricultural monitoring segments.

Market Size & Forecast

2024 Market Size 9.1 (USD Billion)
2035 Market Size 18.5 (USD Billion)
CAGR (2025 - 2035) 6.66%

Major Players

DJI (CN), Parrot (FR), senseFly (CH), Aeryon Labs (CA), Insitu (US), Skycatch (US), Delair (FR), Quantum Systems (DE), Airware (US)

Our Impact

Enabled $4.3B Revenue Impact for Fortune 500 and Leading Multinationals

Partnering with 2000+ Global Organizations Each Year

30K+ Citations by Top-Tier Firms in the Industry

Drones and Aerial Inspection Services Market Drivers

Cost Efficiency

Cost efficiency is a pivotal driver in the Drones and Aerial Inspection Services Market, as organizations seek to reduce operational expenses while maintaining high-quality standards. Aerial inspections using drones can significantly lower costs associated with labor, equipment, and time. For example, traditional inspection methods often require scaffolding or cranes, which can be prohibitively expensive and time-consuming. In contrast, drones can cover large areas quickly and provide high-resolution imagery without the need for extensive setup. This shift towards more economical solutions is reflected in the increasing number of companies adopting drone technology for routine inspections, leading to a projected market growth that could exceed 30 billion dollars by 2030.

Safety and Risk Mitigation

Safety and risk mitigation are increasingly recognized as critical factors driving the Drones and Aerial Inspection Services Market. Drones offer a safer alternative for inspecting hazardous or hard-to-reach areas, such as power lines, wind turbines, and oil rigs. By utilizing drones, companies can minimize the risk of accidents associated with manual inspections, thereby protecting their workforce and reducing liability. The ability to conduct inspections from a distance also allows for better assessment of potential hazards without exposing personnel to danger. As industries prioritize safety protocols, the demand for drone-based inspections is likely to rise, contributing to a robust market growth trajectory.

Technological Advancements

The Drones and Aerial Inspection Services Market is experiencing rapid technological advancements that enhance operational efficiency and data accuracy. Innovations in drone technology, such as improved battery life, enhanced imaging capabilities, and advanced sensors, are driving the adoption of aerial inspection services across various sectors. For instance, the integration of artificial intelligence and machine learning algorithms allows for real-time data analysis, which is crucial for industries like construction and energy. According to recent data, the market for drones is projected to grow significantly, with a compound annual growth rate of over 20 percent in the coming years. This growth is indicative of the increasing reliance on drones for inspections, which are often more cost-effective and safer than traditional methods.

Data Collection and Analysis

The ability to collect and analyze data efficiently is a significant driver in the Drones and Aerial Inspection Services Market. Drones equipped with advanced imaging and sensing technologies can gather vast amounts of data quickly, which is essential for industries such as agriculture, construction, and infrastructure management. The integration of drones with data analytics platforms enables organizations to derive actionable insights from the collected data, enhancing decision-making processes. This trend is particularly evident in sectors where timely information is critical for operational success. As the demand for data-driven decision-making continues to grow, the market for aerial inspection services is expected to expand, with projections indicating a potential market size of over 25 billion dollars by 2028.

Regulatory Support and Frameworks

Regulatory support and frameworks are emerging as vital drivers in the Drones and Aerial Inspection Services Market. Governments worldwide are increasingly recognizing the potential of drones for commercial applications and are establishing regulations that facilitate their use. This regulatory clarity not only encourages investment in drone technology but also fosters innovation within the industry. For instance, streamlined processes for obtaining flight permissions and certifications are making it easier for companies to deploy drones for inspections. As regulatory environments become more favorable, the market is likely to witness accelerated growth, with estimates suggesting that the industry could reach a valuation of 40 billion dollars by 2035.

Market Segment Insights

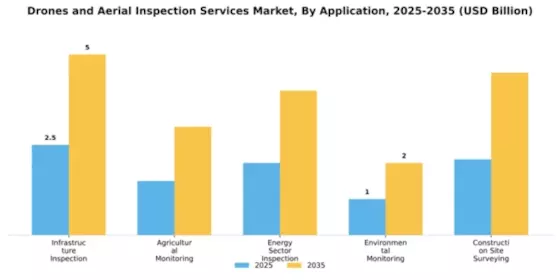
By Application: Infrastructure Inspection (Largest) vs. Agricultural Monitoring (Fastest-Growing)

The Drones and Aerial Inspection Services Market showcases a diverse application landscape, where Infrastructure Inspection holds the largest share due to its critical role in maintenance and safety assessments. This segment includes the monitoring of bridges, roads, and buildings, highlighting a robust demand for aerial surveys and real-time data collection. The agricultural monitoring segment, while smaller in comparison, is rapidly gaining traction as technology enables precision farming, allowing farmers to optimize productivity and resource utilization. The integration of drones in this sector is expected to further enhance crop management and landscape surveillance, contributing to its growth.
Drones and Aerial Inspection Services Market Segment Image 0

Infrastructure Inspection (Dominant) vs. Agricultural Monitoring (Emerging)

Infrastructure Inspection remains the dominant application in the Drones and Aerial Inspection Services Market, characterized by its extensive use in routine assessments and compliance checks for vital structures like bridges and power lines. It leverages advanced drone technology for high-resolution imagery, which aids in thorough inspections and minimizes human risks. On the other hand, Agricultural Monitoring is emerging as a significant segment, driven by the increasing adoption of precision agriculture practices. This application utilizes drones to monitor crop health, soil conditions, and overall field optimization, making it an essential tool for modern farming techniques. The growing focus on sustainability and food security positions this segment for rapid expansion in the future.
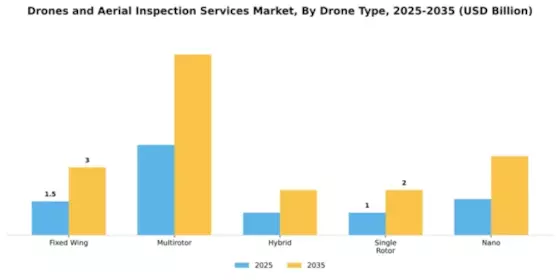
By End Use: Commercial (Largest) vs. Agriculture (Fastest-Growing)

Drones and Aerial Inspection Services Market Segment Image 1

The Drones and Aerial Inspection Services Market exhibits varied end-use applications, with the commercial segment commanding a significant portion of the market share. This sector includes delivery services, surveillance, and emergency response, reflecting the broad acceptance of drone technology in urban and rural settings. Following commercial, agriculture plays a pivotal role, utilizing drones for crop monitoring, precision agriculture, and resource management to enhance productivity and reduce waste. Growth trends in this segment are significantly influenced by technological advancements and increasing regulatory support. The commercial end-use sector benefits from rising demand for efficient logistics and surveillance, while the agriculture segment is witnessing a surge in adoption due to the need for sustainable farming practices. Increased investments in drone technology research and development are also accelerating growth across both segments.

Commercial (Dominant) vs. Agriculture (Emerging)

The commercial end-use segment is a dominant force in the Drones and Aerial Inspection Services Market, driven by its application in sectors such as logistics, media, and real estate. Companies are leveraging drones for data collection, asset inspection, and monitoring, taking advantage of the efficiency and cost-effectiveness of aerial technologies. In contrast, the agriculture sector is emerging rapidly, harnessing drone capabilities for precision agriculture practices that allow farmers to monitor crop health, optimize inputs, and manage resources effectively. This shift towards automated farming solutions indicates a growing recognition of the value that drones can provide in enhancing agricultural productivity and sustainability, especially in precision farming practices.

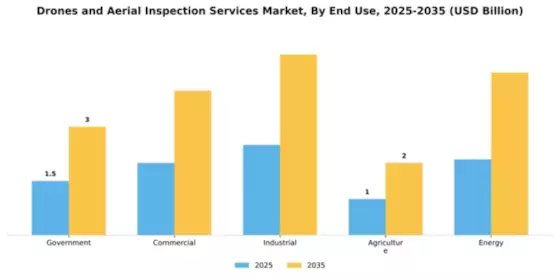
By Drone Type: Multirotor (Largest) vs. Fixed Wing (Fastest-Growing)

The Drone Type segment in the Drones and Aerial Inspection Services Market showcases a diverse distribution of market shares among Fixed Wing, Multirotor, Hybrid, Single Rotor, and Nano categories. Currently, Multirotor drones dominate the market due to their versatility, ease of use, and ability to be deployed in various applications. Conversely, Fixed Wing drones are gaining traction for long-range missions and efficiency in covering larger areas, positioning themselves as a significant player in the growing market landscape.
Drones and Aerial Inspection Services Market Segment Image 2

Drone Type: Multirotor (Dominant) vs. Fixed Wing (Emerging)

Multirotor drones are recognized as the dominant segment within the Drones and Aerial Inspection Services Market due to their ability to perform complex maneuvers and operate in confined spaces, making them ideal for inspections in urban and industrial environments. Their low operating costs and ability to carry advanced sensors further enhance their appeal. Meanwhile, Fixed Wing drones are emerging rapidly, showcasing advantages such as extended flight times and higher payload capacities, suitable for expansive aerial inspections and surveying tasks. As the technology matures, both categories are expected to thrive, catering to varied customer needs across different sectors.
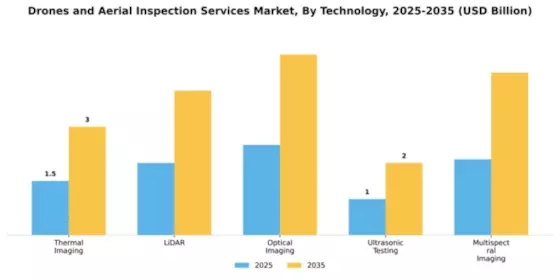
By Technology: Thermal Imaging (Largest) vs. LiDAR (Fastest-Growing)

Drones and Aerial Inspection Services Market Segment Image 3

In the Drones and Aerial Inspection Services Market, Thermal Imaging holds the largest market share among the technologies utilized for inspection and monitoring. Following closely behind, LiDAR is emerging as a significant player with a rapidly expanding market share. Both technologies are preferred across various industries, including construction, agriculture, and environmental monitoring, owing to their precision and efficiency in data collection and analysis. Optical Imaging, Ultrasonic Testing, and Multispectral Imaging are also notable technologies, but they are currently less predominant in terms of market share.

Technology: Thermal Imaging (Dominant) vs. LiDAR (Emerging)

Thermal Imaging serves as the dominant technology within the Drones and Aerial Inspection Services Market, primarily due to its capabilities in identifying temperature variations and detecting heat loss, which is invaluable in sectors such as building inspection and wildlife monitoring. In contrast, LiDAR, emerging as a fast-growing technology, leverages light pulses to measure distances, offering high-resolution mapping and topographical data that are crucial for land surveying and forestry applications. These contrasting yet complementary technologies highlight the versatility required in aerial inspections; while Thermal Imaging excels in specialized thermal analysis, LiDAR is revolutionizing data accuracy and detail.

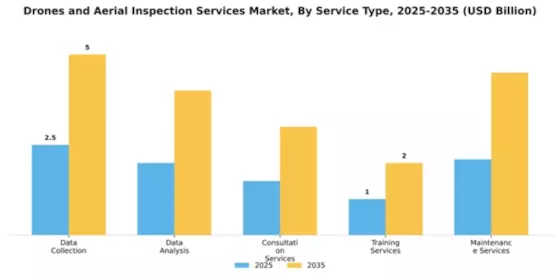
By Service Type: Data Collection (Largest) vs. Data Analysis (Fastest-Growing)

In the Drones and Aerial Inspection Services Market, Data Collection stands out as the largest segment, capturing a significant market share due to its extensive application across various industries such as agriculture, construction, and energy. Following closely, Data Analysis is rapidly gaining traction, emerging as the fastest-growing service owing to the increasing demand for actionable insights derived from drone-generated data, which enhances operational efficiency and decision-making processes.
Drones and Aerial Inspection Services Market Segment Image 4

Data Collection (Dominant) vs. Data Analysis (Emerging)

Data Collection services in the Drones and Aerial Inspection Services Market are characterized by their extensive use in gathering high-resolution imagery and data from aerial perspectives. This segment is widely adopted across multiple sectors, due to its ability to offer real-time observations and extensive coverage of large areas. Conversely, Data Analysis services represent an emerging force in the market, driven by innovations in data processing technologies. These services translate raw data into meaningful insights, catering to a growing need for informed decision-making. As companies increasingly recognize the value of data-driven strategies, Data Analysis is set to experience rapid growth and adoption.

Get more detailed insights about Drones and Aerial Inspection Services Market Request Free Sample

Regional Insights

North America : Market Leader in Drones

North America continues to lead the Drones and Aerial Inspection Services Market, holding a significant market share of 4.55 in 2024. The growth is driven by increasing demand for aerial surveillance, infrastructure inspection, and agricultural monitoring. Regulatory support from the FAA and advancements in drone technology are key catalysts for this expansion. The region's focus on innovation and safety regulations further enhances market potential. The competitive landscape is robust, with the U.S. being a major player, home to key companies like DJI, Insitu, and Airware. Canada also contributes significantly, with firms like Aeryon Labs leading in technology development. The presence of established players and a growing number of startups fosters a dynamic environment, ensuring North America remains at the forefront of the drone industry.

Europe : Emerging Market with Regulations

Europe's Drones and Aerial Inspection Services Market is poised for growth, with a market size of 2.73. The region benefits from stringent regulations that promote safety and innovation, driving demand for aerial services in sectors like construction and agriculture. The European Union's initiatives to integrate drones into airspace are pivotal in shaping market dynamics, ensuring compliance and fostering technological advancements. Leading countries such as Germany, France, and the UK are at the forefront, with companies like Parrot and senseFly making significant contributions. The competitive landscape is characterized by a mix of established firms and innovative startups, enhancing the region's market potential. The collaborative efforts among EU member states to standardize regulations further strengthen the market's growth trajectory.

Asia-Pacific : Rapid Growth in Drone Adoption

The Asia-Pacific region is witnessing rapid growth in the Drones and Aerial Inspection Services Market, with a market size of 1.82. Factors such as increasing urbanization, infrastructure development, and a growing emphasis on agricultural efficiency are driving demand. Countries like China and India are leading this growth, supported by favorable government policies and investments in drone technology, which are crucial for market expansion. China stands out as a major player, with companies like DJI leading the global market. India is also emerging as a significant market, with increasing adoption in agriculture and surveillance. The competitive landscape is evolving, with both local and international players vying for market share, ensuring a dynamic environment for innovation and growth.

Middle East and Africa : Untapped Potential in Drones

The Middle East and Africa region represents an untapped market for Drones and Aerial Inspection Services, with a market size of 0.1. The growth potential is driven by increasing investments in infrastructure and a rising demand for aerial surveillance in sectors like oil and gas. Governments are beginning to recognize the benefits of drone technology, leading to gradual regulatory developments that support market entry and expansion. Countries like the UAE and South Africa are leading the way, with initiatives to integrate drones into various sectors. The competitive landscape is still developing, with a mix of local startups and international companies exploring opportunities. As regulations evolve and awareness grows, the region is expected to see significant advancements in drone adoption and utilization.

Key Players and Competitive Insights

The Drones and Aerial Inspection Services Market is currently characterized by a dynamic competitive landscape, driven by technological advancements and increasing demand for efficient inspection solutions across various sectors. Key players such as DJI (CN), Parrot (FR), and Insitu (US) are at the forefront, each adopting distinct strategies to enhance their market positioning. DJI (CN) continues to lead with a focus on innovation, particularly in developing advanced imaging technologies and AI capabilities, which are crucial for aerial inspections. Meanwhile, Parrot (FR) emphasizes partnerships with local firms to expand its reach in Europe, thereby enhancing its operational footprint. Insitu (US), a subsidiary of Boeing, is leveraging its aerospace expertise to integrate drones into broader defense and commercial applications, indicating a strategic pivot towards diversified service offerings.The market structure appears moderately fragmented, with numerous players vying for market share. Key business tactics include localizing manufacturing to reduce costs and optimize supply chains, which is particularly relevant in the context of rising global logistics challenges. The collective influence of these major companies shapes a competitive environment where innovation and operational efficiency are paramount, allowing them to respond swiftly to market demands.In November DJI (CN) announced the launch of its latest drone model equipped with enhanced thermal imaging capabilities, aimed specifically at the energy sector for infrastructure inspections. This strategic move not only reinforces DJI's commitment to innovation but also positions the company to capture a larger share of the growing demand for energy infrastructure monitoring, which is critical in the context of global energy transitions.In October Parrot (FR) entered into a strategic partnership with a leading European telecommunications provider to develop drone-based solutions for 5G network inspections. This collaboration is significant as it aligns with the increasing need for robust telecommunications infrastructure, particularly in urban areas, thereby enhancing Parrot's service offerings and market relevance.In September Insitu (US) secured a contract with a major government agency to provide drone services for environmental monitoring. This contract underscores Insitu's strategic focus on expanding its presence in the public sector, which is likely to yield long-term benefits as governments increasingly adopt drone technology for various applications.As of December the competitive trends in the Drones and Aerial Inspection Services Market are heavily influenced by digitalization, sustainability, and AI integration. Strategic alliances are becoming increasingly vital, as companies recognize the need to collaborate to enhance technological capabilities and market reach. Looking ahead, competitive differentiation is expected to evolve, shifting from price-based competition to a focus on innovation, technological advancements, and supply chain reliability. This transition suggests that companies that prioritize R&D and strategic partnerships will likely emerge as leaders in this rapidly evolving market.


Key Companies in the Drones and Aerial Inspection Services Market include

Future Outlook

Drones and Aerial Inspection Services Market Future Outlook

The Drones and Aerial Inspection Services Market is projected to grow at a 6.66% CAGR from 2025 to 2035, driven by technological advancements, regulatory support, and increasing demand for efficient inspection solutions.

New opportunities lie in:

  • Development of AI-driven analytics platforms for real-time data interpretation. Expansion into emerging markets with tailored drone solutions. Partnerships with infrastructure firms for integrated inspection services.

By 2035, the market is poised for robust growth, reflecting evolving industry needs and technological innovations.

Market Segmentation

drones-and-aerial-inspection-services-market End Use Outlook

  • Government
  • Commercial
  • Industrial
  • Agriculture
  • Energy

drones-and-aerial-inspection-services-market Drone Type Outlook

  • Fixed Wing
  • Multirotor
  • Hybrid
  • Single Rotor
  • Nano

drones-and-aerial-inspection-services-market Technology Outlook

  • Thermal Imaging
  • LiDAR
  • Optical Imaging
  • Ultrasonic Testing
  • Multispectral Imaging

drones-and-aerial-inspection-services-market Application Outlook

  • Infrastructure Inspection
  • Agricultural Monitoring
  • Energy Sector Inspection
  • Environmental Monitoring
  • Construction Site Surveying

drones-and-aerial-inspection-services-market Service Type Outlook

  • Data Collection
  • Data Analysis
  • Consultation Services
  • Training Services
  • Maintenance Services

Report Scope

MARKET SIZE 2024 9.1(USD Billion)
MARKET SIZE 2025 9.71(USD Billion)
MARKET SIZE 2035 18.5(USD Billion)
COMPOUND ANNUAL GROWTH RATE (CAGR) 6.66% (2025 - 2035)
REPORT COVERAGE Revenue Forecast, Competitive Landscape, Growth Factors, and Trends
BASE YEAR 2024
Market Forecast Period 2025 - 2035
Historical Data 2019 - 2024
Market Forecast Units USD Billion
Key Companies Profiled DJI (CN), Parrot (FR), senseFly (CH), Aeryon Labs (CA), Insitu (US), Skycatch (US), Delair (FR), Quantum Systems (DE), Airware (US)
Segments Covered Application, End Use, Drone Type, Technology, Service Type
Key Market Opportunities Integration of artificial intelligence enhances efficiency in the Drones and Aerial Inspection Services Market.
Key Market Dynamics Technological advancements and regulatory changes drive growth in the Drones and Aerial Inspection Services Market.
Countries Covered North America, Europe, APAC, South America, MEA

Table of Contents

  1. SECTION I: EXECUTIVE SUMMARY AND KEY HIGHLIGHTS |
    1. 1.1 EXECUTIVE SUMMARY | |
      1. 1.1.1 Market Overview | |
      2. 1.1.2 Key Findings | |
      3. 1.1.3 Market Segmentation | |
      4. 1.1.4 Competitive Landscape | |
      5. 1.1.5 Challenges and Opportunities | |
      6. 1.1.6 Future Outlook 2
  2. SECTION II: SCOPING, METHODOLOGY AND MARKET STRUCTURE |
    1. 2.1 MARKET INTRODUCTION | |
      1. 2.1.1 Definition | |
      2. 2.1.2 Scope of the study | | |
        1. 2.1.2.1 Research Objective | | |
        2. 2.1.2.2 Assumption | | |
        3. 2.1.2.3 Limitations |
    2. 2.2 RESEARCH METHODOLOGY | |
      1. 2.2.1 Overview | |
      2. 2.2.2 Data Mining | |
      3. 2.2.3 Secondary Research | |
      4. 2.2.4 Primary Research | | |
        1. 2.2.4.1 Primary Interviews and Information Gathering Process | | |
        2. 2.2.4.2 Breakdown of Primary Respondents | |
      5. 2.2.5 Forecasting Model | |
      6. 2.2.6 Market Size Estimation | | |
        1. 2.2.6.1 Bottom-Up Approach | | |
        2. 2.2.6.2 Top-Down Approach | |
      7. 2.2.7 Data Triangulation | |
      8. 2.2.8 Validation 3
  3. SECTION III: QUALITATIVE ANALYSIS |
    1. 3.1 MARKET DYNAMICS | |
      1. 3.1.1 Overview | |
      2. 3.1.2 Drivers | |
      3. 3.1.3 Restraints | |
      4. 3.1.4 Opportunities |
    2. 3.2 MARKET FACTOR ANALYSIS | |
      1. 3.2.1 Value chain Analysis | |
      2. 3.2.2 Porter's Five Forces Analysis | | |
        1. 3.2.2.1 Bargaining Power of Suppliers | | |
        2. 3.2.2.2 Bargaining Power of Buyers | | |
        3. 3.2.2.3 Threat of New Entrants | | |
        4. 3.2.2.4 Threat of Substitutes | | |
        5. 3.2.2.5 Intensity of Rivalry | |
      3. 3.2.3 COVID-19 Impact Analysis | | |
        1. 3.2.3.1 Market Impact Analysis | | |
        2. 3.2.3.2 Regional Impact | | |
        3. 3.2.3.3 Opportunity and Threat Analysis 4
  4. SECTION IV: QUANTITATIVE ANALYSIS |
    1. 4.1 Life Sciences, BY Application (USD Billion) | |
      1. 4.1.1 Infrastructure Inspection | |
      2. 4.1.2 Agricultural Monitoring | |
      3. 4.1.3 Energy Sector Inspection | |
      4. 4.1.4 Environmental Monitoring | |
      5. 4.1.5 Construction Site Surveying |
    2. 4.2 Life Sciences, BY End Use (USD Billion) | |
      1. 4.2.1 Government | |
      2. 4.2.2 Commercial | |
      3. 4.2.3 Industrial | |
      4. 4.2.4 Agriculture | |
      5. 4.2.5 Energy |
    3. 4.3 Life Sciences, BY Drone Type (USD Billion) | |
      1. 4.3.1 Fixed Wing | |
      2. 4.3.2 Multirotor | |
      3. 4.3.3 Hybrid | |
      4. 4.3.4 Single Rotor | |
      5. 4.3.5 Nano |
    4. 4.4 Life Sciences, BY Technology (USD Billion) | |
      1. 4.4.1 Thermal Imaging | |
      2. 4.4.2 LiDAR | |
      3. 4.4.3 Optical Imaging | |
      4. 4.4.4 Ultrasonic Testing | |
      5. 4.4.5 Multispectral Imaging |
    5. 4.5 Life Sciences, BY Service Type (USD Billion) | |
      1. 4.5.1 Data Collection | |
      2. 4.5.2 Data Analysis | |
      3. 4.5.3 Consultation Services | |
      4. 4.5.4 Training Services | |
      5. 4.5.5 Maintenance Services |
    6. 4.6 Life Sciences, BY Region (USD Billion) | |
      1. 4.6.1 North America | | |
        1. 4.6.1.1 US | | |
        2. 4.6.1.2 Canada | |
      2. 4.6.2 Europe | | |
        1. 4.6.2.1 Germany | | |
        2. 4.6.2.2 UK | | |
        3. 4.6.2.3 France | | |
        4. 4.6.2.4 Russia | | |
        5. 4.6.2.5 Italy | | |
        6. 4.6.2.6 Spain | | |
        7. 4.6.2.7 Rest of Europe | |
      3. 4.6.3 APAC | | |
        1. 4.6.3.1 China | | |
        2. 4.6.3.2 India | | |
        3. 4.6.3.3 Japan | | |
        4. 4.6.3.4 South Korea | | |
        5. 4.6.3.5 Malaysia | | |
        6. 4.6.3.6 Thailand | | |
        7. 4.6.3.7 Indonesia | | |
        8. 4.6.3.8 Rest of APAC | |
      4. 4.6.4 South America | | |
        1. 4.6.4.1 Brazil | | |
        2. 4.6.4.2 Mexico | | |
        3. 4.6.4.3 Argentina | | |
        4. 4.6.4.4 Rest of South America | |
      5. 4.6.5 MEA | | |
        1. 4.6.5.1 GCC Countries | | |
        2. 4.6.5.2 South Africa | | |
        3. 4.6.5.3 Rest of MEA 5
  5. SECTION V: COMPETITIVE ANALYSIS |
    1. 5.1 Competitive Landscape | |
      1. 5.1.1 Overview | |
      2. 5.1.2 Competitive Analysis | |
      3. 5.1.3 Market share Analysis | |
      4. 5.1.4 Major Growth Strategy in the Life Sciences | |
      5. 5.1.5 Competitive Benchmarking | |
      6. 5.1.6 Leading Players in Terms of Number of Developments in the Life Sciences | |
      7. 5.1.7 Key developments and growth strategies | | |
        1. 5.1.7.1 New Product Launch/Service Deployment | | |
        2. 5.1.7.2 Merger & Acquisitions | | |
        3. 5.1.7.3 Joint Ventures | |
      8. 5.1.8 Major Players Financial Matrix | | |
        1. 5.1.8.1 Sales and Operating Income | | |
        2. 5.1.8.2 Major Players R&D Expenditure. 2023 |
    2. 5.2 Company Profiles | |
      1. 5.2.1 DJI (CN) | | |
        1. 5.2.1.1 Financial Overview | | |
        2. 5.2.1.2 Products Offered | | |
        3. 5.2.1.3 Key Developments | | |
        4. 5.2.1.4 SWOT Analysis | | |
        5. 5.2.1.5 Key Strategies | |
      2. 5.2.2 Parrot (FR) | | |
        1. 5.2.2.1 Financial Overview | | |
        2. 5.2.2.2 Products Offered | | |
        3. 5.2.2.3 Key Developments | | |
        4. 5.2.2.4 SWOT Analysis | | |
        5. 5.2.2.5 Key Strategies | |
      3. 5.2.3 senseFly (CH) | | |
        1. 5.2.3.1 Financial Overview | | |
        2. 5.2.3.2 Products Offered | | |
        3. 5.2.3.3 Key Developments | | |
        4. 5.2.3.4 SWOT Analysis | | |
        5. 5.2.3.5 Key Strategies | |
      4. 5.2.4 Aeryon Labs (CA) | | |
        1. 5.2.4.1 Financial Overview | | |
        2. 5.2.4.2 Products Offered | | |
        3. 5.2.4.3 Key Developments | | |
        4. 5.2.4.4 SWOT Analysis | | |
        5. 5.2.4.5 Key Strategies | |
      5. 5.2.5 Insitu (US) | | |
        1. 5.2.5.1 Financial Overview | | |
        2. 5.2.5.2 Products Offered | | |
        3. 5.2.5.3 Key Developments | | |
        4. 5.2.5.4 SWOT Analysis | | |
        5. 5.2.5.5 Key Strategies | |
      6. 5.2.6 Skycatch (US) | | |
        1. 5.2.6.1 Financial Overview | | |
        2. 5.2.6.2 Products Offered | | |
        3. 5.2.6.3 Key Developments | | |
        4. 5.2.6.4 SWOT Analysis | | |
        5. 5.2.6.5 Key Strategies | |
      7. 5.2.7 Delair (FR) | | |
        1. 5.2.7.1 Financial Overview | | |
        2. 5.2.7.2 Products Offered | | |
        3. 5.2.7.3 Key Developments | | |
        4. 5.2.7.4 SWOT Analysis | | |
        5. 5.2.7.5 Key Strategies | |
      8. 5.2.8 Quantum Systems (DE) | | |
        1. 5.2.8.1 Financial Overview | | |
        2. 5.2.8.2 Products Offered | | |
        3. 5.2.8.3 Key Developments | | |
        4. 5.2.8.4 SWOT Analysis | | |
        5. 5.2.8.5 Key Strategies | |
      9. 5.2.9 Airware (US) | | |
        1. 5.2.9.1 Financial Overview | | |
        2. 5.2.9.2 Products Offered | | |
        3. 5.2.9.3 Key Developments | | |
        4. 5.2.9.4 SWOT Analysis | | |
        5. 5.2.9.5 Key Strategies |
    3. 5.3 Appendix | |
      1. 5.3.1 References | |
      2. 5.3.2 Related Reports 6 LIST OF FIGURES |
    4. 6.1 MARKET SYNOPSIS |
    5. 6.2 NORTH AMERICA MARKET ANALYSIS |
    6. 6.3 US MARKET ANALYSIS BY APPLICATION |
    7. 6.4 US MARKET ANALYSIS BY END USE |
    8. 6.5 US MARKET ANALYSIS BY DRONE TYPE |
    9. 6.6 US MARKET ANALYSIS BY TECHNOLOGY |
    10. 6.7 US MARKET ANALYSIS BY SERVICE TYPE |
    11. 6.8 CANADA MARKET ANALYSIS BY APPLICATION |
    12. 6.9 CANADA MARKET ANALYSIS BY END USE |
    13. 6.10 CANADA MARKET ANALYSIS BY DRONE TYPE |
    14. 6.11 CANADA MARKET ANALYSIS BY TECHNOLOGY |
    15. 6.12 CANADA MARKET ANALYSIS BY SERVICE TYPE |
    16. 6.13 EUROPE MARKET ANALYSIS |
    17. 6.14 GERMANY MARKET ANALYSIS BY APPLICATION |
    18. 6.15 GERMANY MARKET ANALYSIS BY END USE |
    19. 6.16 GERMANY MARKET ANALYSIS BY DRONE TYPE |
    20. 6.17 GERMANY MARKET ANALYSIS BY TECHNOLOGY |
    21. 6.18 GERMANY MARKET ANALYSIS BY SERVICE TYPE |
    22. 6.19 UK MARKET ANALYSIS BY APPLICATION |
    23. 6.20 UK MARKET ANALYSIS BY END USE |
    24. 6.21 UK MARKET ANALYSIS BY DRONE TYPE |
    25. 6.22 UK MARKET ANALYSIS BY TECHNOLOGY |
    26. 6.23 UK MARKET ANALYSIS BY SERVICE TYPE |
    27. 6.24 FRANCE MARKET ANALYSIS BY APPLICATION |
    28. 6.25 FRANCE MARKET ANALYSIS BY END USE |
    29. 6.26 FRANCE MARKET ANALYSIS BY DRONE TYPE |
    30. 6.27 FRANCE MARKET ANALYSIS BY TECHNOLOGY |
    31. 6.28 FRANCE MARKET ANALYSIS BY SERVICE TYPE |
    32. 6.29 RUSSIA MARKET ANALYSIS BY APPLICATION |
    33. 6.30 RUSSIA MARKET ANALYSIS BY END USE |
    34. 6.31 RUSSIA MARKET ANALYSIS BY DRONE TYPE |
    35. 6.32 RUSSIA MARKET ANALYSIS BY TECHNOLOGY |
    36. 6.33 RUSSIA MARKET ANALYSIS BY SERVICE TYPE |
    37. 6.34 ITALY MARKET ANALYSIS BY APPLICATION |
    38. 6.35 ITALY MARKET ANALYSIS BY END USE |
    39. 6.36 ITALY MARKET ANALYSIS BY DRONE TYPE |
    40. 6.37 ITALY MARKET ANALYSIS BY TECHNOLOGY |
    41. 6.38 ITALY MARKET ANALYSIS BY SERVICE TYPE |
    42. 6.39 SPAIN MARKET ANALYSIS BY APPLICATION |
    43. 6.40 SPAIN MARKET ANALYSIS BY END USE |
    44. 6.41 SPAIN MARKET ANALYSIS BY DRONE TYPE |
    45. 6.42 SPAIN MARKET ANALYSIS BY TECHNOLOGY |
    46. 6.43 SPAIN MARKET ANALYSIS BY SERVICE TYPE |
    47. 6.44 REST OF EUROPE MARKET ANALYSIS BY APPLICATION |
    48. 6.45 REST OF EUROPE MARKET ANALYSIS BY END USE |
    49. 6.46 REST OF EUROPE MARKET ANALYSIS BY DRONE TYPE |
    50. 6.47 REST OF EUROPE MARKET ANALYSIS BY TECHNOLOGY |
    51. 6.48 REST OF EUROPE MARKET ANALYSIS BY SERVICE TYPE |
    52. 6.49 APAC MARKET ANALYSIS |
    53. 6.50 CHINA MARKET ANALYSIS BY APPLICATION |
    54. 6.51 CHINA MARKET ANALYSIS BY END USE |
    55. 6.52 CHINA MARKET ANALYSIS BY DRONE TYPE |
    56. 6.53 CHINA MARKET ANALYSIS BY TECHNOLOGY |
    57. 6.54 CHINA MARKET ANALYSIS BY SERVICE TYPE |
    58. 6.55 INDIA MARKET ANALYSIS BY APPLICATION |
    59. 6.56 INDIA MARKET ANALYSIS BY END USE |
    60. 6.57 INDIA MARKET ANALYSIS BY DRONE TYPE |
    61. 6.58 INDIA MARKET ANALYSIS BY TECHNOLOGY |
    62. 6.59 INDIA MARKET ANALYSIS BY SERVICE TYPE |
    63. 6.60 JAPAN MARKET ANALYSIS BY APPLICATION |
    64. 6.61 JAPAN MARKET ANALYSIS BY END USE |
    65. 6.62 JAPAN MARKET ANALYSIS BY DRONE TYPE |
    66. 6.63 JAPAN MARKET ANALYSIS BY TECHNOLOGY |
    67. 6.64 JAPAN MARKET ANALYSIS BY SERVICE TYPE |
    68. 6.65 SOUTH KOREA MARKET ANALYSIS BY APPLICATION |
    69. 6.66 SOUTH KOREA MARKET ANALYSIS BY END USE |
    70. 6.67 SOUTH KOREA MARKET ANALYSIS BY DRONE TYPE |
    71. 6.68 SOUTH KOREA MARKET ANALYSIS BY TECHNOLOGY |
    72. 6.69 SOUTH KOREA MARKET ANALYSIS BY SERVICE TYPE |
    73. 6.70 MALAYSIA MARKET ANALYSIS BY APPLICATION |
    74. 6.71 MALAYSIA MARKET ANALYSIS BY END USE |
    75. 6.72 MALAYSIA MARKET ANALYSIS BY DRONE TYPE |
    76. 6.73 MALAYSIA MARKET ANALYSIS BY TECHNOLOGY |
    77. 6.74 MALAYSIA MARKET ANALYSIS BY SERVICE TYPE |
    78. 6.75 THAILAND MARKET ANALYSIS BY APPLICATION |
    79. 6.76 THAILAND MARKET ANALYSIS BY END USE |
    80. 6.77 THAILAND MARKET ANALYSIS BY DRONE TYPE |
    81. 6.78 THAILAND MARKET ANALYSIS BY TECHNOLOGY |
    82. 6.79 THAILAND MARKET ANALYSIS BY SERVICE TYPE |
    83. 6.80 INDONESIA MARKET ANALYSIS BY APPLICATION |
    84. 6.81 INDONESIA MARKET ANALYSIS BY END USE |
    85. 6.82 INDONESIA MARKET ANALYSIS BY DRONE TYPE |
    86. 6.83 INDONESIA MARKET ANALYSIS BY TECHNOLOGY |
    87. 6.84 INDONESIA MARKET ANALYSIS BY SERVICE TYPE |
    88. 6.85 REST OF APAC MARKET ANALYSIS BY APPLICATION |
    89. 6.86 REST OF APAC MARKET ANALYSIS BY END USE |
    90. 6.87 REST OF APAC MARKET ANALYSIS BY DRONE TYPE |
    91. 6.88 REST OF APAC MARKET ANALYSIS BY TECHNOLOGY |
    92. 6.89 REST OF APAC MARKET ANALYSIS BY SERVICE TYPE |
    93. 6.90 SOUTH AMERICA MARKET ANALYSIS |
    94. 6.91 BRAZIL MARKET ANALYSIS BY APPLICATION |
    95. 6.92 BRAZIL MARKET ANALYSIS BY END USE |
    96. 6.93 BRAZIL MARKET ANALYSIS BY DRONE TYPE |
    97. 6.94 BRAZIL MARKET ANALYSIS BY TECHNOLOGY |
    98. 6.95 BRAZIL MARKET ANALYSIS BY SERVICE TYPE |
    99. 6.96 MEXICO MARKET ANALYSIS BY APPLICATION |
    100. 6.97 MEXICO MARKET ANALYSIS BY END USE |
    101. 6.98 MEXICO MARKET ANALYSIS BY DRONE TYPE |
    102. 6.99 MEXICO MARKET ANALYSIS BY TECHNOLOGY |
    103. 6.100 MEXICO MARKET ANALYSIS BY SERVICE TYPE |
    104. 6.101 ARGENTINA MARKET ANALYSIS BY APPLICATION |
    105. 6.102 ARGENTINA MARKET ANALYSIS BY END USE |
    106. 6.103 ARGENTINA MARKET ANALYSIS BY DRONE TYPE |
    107. 6.104 ARGENTINA MARKET ANALYSIS BY TECHNOLOGY |
    108. 6.105 ARGENTINA MARKET ANALYSIS BY SERVICE TYPE |
    109. 6.106 REST OF SOUTH AMERICA MARKET ANALYSIS BY APPLICATION |
    110. 6.107 REST OF SOUTH AMERICA MARKET ANALYSIS BY END USE |
    111. 6.108 REST OF SOUTH AMERICA MARKET ANALYSIS BY DRONE TYPE |
    112. 6.109 REST OF SOUTH AMERICA MARKET ANALYSIS BY TECHNOLOGY |
    113. 6.110 REST OF SOUTH AMERICA MARKET ANALYSIS BY SERVICE TYPE |
    114. 6.111 MEA MARKET ANALYSIS |
    115. 6.112 GCC COUNTRIES MARKET ANALYSIS BY APPLICATION |
    116. 6.113 GCC COUNTRIES MARKET ANALYSIS BY END USE |
    117. 6.114 GCC COUNTRIES MARKET ANALYSIS BY DRONE TYPE |
    118. 6.115 GCC COUNTRIES MARKET ANALYSIS BY TECHNOLOGY |
    119. 6.116 GCC COUNTRIES MARKET ANALYSIS BY SERVICE TYPE |
    120. 6.117 SOUTH AFRICA MARKET ANALYSIS BY APPLICATION |
    121. 6.118 SOUTH AFRICA MARKET ANALYSIS BY END USE |
    122. 6.119 SOUTH AFRICA MARKET ANALYSIS BY DRONE TYPE |
    123. 6.120 SOUTH AFRICA MARKET ANALYSIS BY TECHNOLOGY |
    124. 6.121 SOUTH AFRICA MARKET ANALYSIS BY SERVICE TYPE |
    125. 6.122 REST OF MEA MARKET ANALYSIS BY APPLICATION |
    126. 6.123 REST OF MEA MARKET ANALYSIS BY END USE |
    127. 6.124 REST OF MEA MARKET ANALYSIS BY DRONE TYPE |
    128. 6.125 REST OF MEA MARKET ANALYSIS BY TECHNOLOGY |
    129. 6.126 REST OF MEA MARKET ANALYSIS BY SERVICE TYPE |
    130. 6.127 KEY BUYING CRITERIA OF LIFE SCIENCES |
    131. 6.128 RESEARCH PROCESS OF MRFR |
    132. 6.129 DRO ANALYSIS OF LIFE SCIENCES |
    133. 6.130 DRIVERS IMPACT ANALYSIS: LIFE SCIENCES |
    134. 6.131 RESTRAINTS IMPACT ANALYSIS: LIFE SCIENCES |
    135. 6.132 SUPPLY / VALUE CHAIN: LIFE SCIENCES |
    136. 6.133 LIFE SCIENCES, BY APPLICATION, 2024 (% SHARE) |
    137. 6.134 LIFE SCIENCES, BY APPLICATION, 2024 TO 2035 (USD Billion) |
    138. 6.135 LIFE SCIENCES, BY END USE, 2024 (% SHARE) |
    139. 6.136 LIFE SCIENCES, BY END USE, 2024 TO 2035 (USD Billion) |
    140. 6.137 LIFE SCIENCES, BY DRONE TYPE, 2024 (% SHARE) |
    141. 6.138 LIFE SCIENCES, BY DRONE TYPE, 2024 TO 2035 (USD Billion) |
    142. 6.139 LIFE SCIENCES, BY TECHNOLOGY, 2024 (% SHARE) |
    143. 6.140 LIFE SCIENCES, BY TECHNOLOGY, 2024 TO 2035 (USD Billion) |
    144. 6.141 LIFE SCIENCES, BY SERVICE TYPE, 2024 (% SHARE) |
    145. 6.142 LIFE SCIENCES, BY SERVICE TYPE, 2024 TO 2035 (USD Billion) |
    146. 6.143 BENCHMARKING OF MAJOR COMPETITORS 7 LIST OF TABLES |
    147. 7.1 LIST OF ASSUMPTIONS | |
      1. 7.1.1 |
    148. 7.2 North America MARKET SIZE ESTIMATES; FORECAST | |
      1. 7.2.1 BY APPLICATION, 2025-2035 (USD Billion) | |
      2. 7.2.2 BY END USE, 2025-2035 (USD Billion) | |
      3. 7.2.3 BY DRONE TYPE, 2025-2035 (USD Billion) | |
      4. 7.2.4 BY TECHNOLOGY, 2025-2035 (USD Billion) | |
      5. 7.2.5 BY SERVICE TYPE, 2025-2035 (USD Billion) |
    149. 7.3 US MARKET SIZE ESTIMATES; FORECAST | |
      1. 7.3.1 BY APPLICATION, 2025-2035 (USD Billion) | |
      2. 7.3.2 BY END USE, 2025-2035 (USD Billion) | |
      3. 7.3.3 BY DRONE TYPE, 2025-2035 (USD Billion) | |
      4. 7.3.4 BY TECHNOLOGY, 2025-2035 (USD Billion) | |
      5. 7.3.5 BY SERVICE TYPE, 2025-2035 (USD Billion) |
    150. 7.4 Canada MARKET SIZE ESTIMATES; FORECAST | |
      1. 7.4.1 BY APPLICATION, 2025-2035 (USD Billion) | |
      2. 7.4.2 BY END USE, 2025-2035 (USD Billion) | |
      3. 7.4.3 BY DRONE TYPE, 2025-2035 (USD Billion) | |
      4. 7.4.4 BY TECHNOLOGY, 2025-2035 (USD Billion) | |
      5. 7.4.5 BY SERVICE TYPE, 2025-2035 (USD Billion) |
    151. 7.5 Europe MARKET SIZE ESTIMATES; FORECAST | |
      1. 7.5.1 BY APPLICATION, 2025-2035 (USD Billion) | |
      2. 7.5.2 BY END USE, 2025-2035 (USD Billion) | |
      3. 7.5.3 BY DRONE TYPE, 2025-2035 (USD Billion) | |
      4. 7.5.4 BY TECHNOLOGY, 2025-2035 (USD Billion) | |
      5. 7.5.5 BY SERVICE TYPE, 2025-2035 (USD Billion) |
    152. 7.6 Germany MARKET SIZE ESTIMATES; FORECAST | |
      1. 7.6.1 BY APPLICATION, 2025-2035 (USD Billion) | |
      2. 7.6.2 BY END USE, 2025-2035 (USD Billion) | |
      3. 7.6.3 BY DRONE TYPE, 2025-2035 (USD Billion) | |
      4. 7.6.4 BY TECHNOLOGY, 2025-2035 (USD Billion) | |
      5. 7.6.5 BY SERVICE TYPE, 2025-2035 (USD Billion) |
    153. 7.7 UK MARKET SIZE ESTIMATES; FORECAST | |
      1. 7.7.1 BY APPLICATION, 2025-2035 (USD Billion) | |
      2. 7.7.2 BY END USE, 2025-2035 (USD Billion) | |
      3. 7.7.3 BY DRONE TYPE, 2025-2035 (USD Billion) | |
      4. 7.7.4 BY TECHNOLOGY, 2025-2035 (USD Billion) | |
      5. 7.7.5 BY SERVICE TYPE, 2025-2035 (USD Billion) |
    154. 7.8 France MARKET SIZE ESTIMATES; FORECAST | |
      1. 7.8.1 BY APPLICATION, 2025-2035 (USD Billion) | |
      2. 7.8.2 BY END USE, 2025-2035 (USD Billion) | |
      3. 7.8.3 BY DRONE TYPE, 2025-2035 (USD Billion) | |
      4. 7.8.4 BY TECHNOLOGY, 2025-2035 (USD Billion) | |
      5. 7.8.5 BY SERVICE TYPE, 2025-2035 (USD Billion) |
    155. 7.9 Russia MARKET SIZE ESTIMATES; FORECAST | |
      1. 7.9.1 BY APPLICATION, 2025-2035 (USD Billion) | |
      2. 7.9.2 BY END USE, 2025-2035 (USD Billion) | |
      3. 7.9.3 BY DRONE TYPE, 2025-2035 (USD Billion) | |
      4. 7.9.4 BY TECHNOLOGY, 2025-2035 (USD Billion) | |
      5. 7.9.5 BY SERVICE TYPE, 2025-2035 (USD Billion) |
    156. 7.10 Italy MARKET SIZE ESTIMATES; FORECAST | |
      1. 7.10.1 BY APPLICATION, 2025-2035 (USD Billion) | |
      2. 7.10.2 BY END USE, 2025-2035 (USD Billion) | |
      3. 7.10.3 BY DRONE TYPE, 2025-2035 (USD Billion) | |
      4. 7.10.4 BY TECHNOLOGY, 2025-2035 (USD Billion) | |
      5. 7.10.5 BY SERVICE TYPE, 2025-2035 (USD Billion) |
    157. 7.11 Spain MARKET SIZE ESTIMATES; FORECAST | |
      1. 7.11.1 BY APPLICATION, 2025-2035 (USD Billion) | |
      2. 7.11.2 BY END USE, 2025-2035 (USD Billion) | |
      3. 7.11.3 BY DRONE TYPE, 2025-2035 (USD Billion) | |
      4. 7.11.4 BY TECHNOLOGY, 2025-2035 (USD Billion) | |
      5. 7.11.5 BY SERVICE TYPE, 2025-2035 (USD Billion) |
    158. 7.12 Rest of Europe MARKET SIZE ESTIMATES; FORECAST | |
      1. 7.12.1 BY APPLICATION, 2025-2035 (USD Billion) | |
      2. 7.12.2 BY END USE, 2025-2035 (USD Billion) | |
      3. 7.12.3 BY DRONE TYPE, 2025-2035 (USD Billion) | |
      4. 7.12.4 BY TECHNOLOGY, 2025-2035 (USD Billion) | |
      5. 7.12.5 BY SERVICE TYPE, 2025-2035 (USD Billion) |
    159. 7.13 APAC MARKET SIZE ESTIMATES; FORECAST | |
      1. 7.13.1 BY APPLICATION, 2025-2035 (USD Billion) | |
      2. 7.13.2 BY END USE, 2025-2035 (USD Billion) | |
      3. 7.13.3 BY DRONE TYPE, 2025-2035 (USD Billion) | |
      4. 7.13.4 BY TECHNOLOGY, 2025-2035 (USD Billion) | |
      5. 7.13.5 BY SERVICE TYPE, 2025-2035 (USD Billion) |
    160. 7.14 China MARKET SIZE ESTIMATES; FORECAST | |
      1. 7.14.1 BY APPLICATION, 2025-2035 (USD Billion) | |
      2. 7.14.2 BY END USE, 2025-2035 (USD Billion) | |
      3. 7.14.3 BY DRONE TYPE, 2025-2035 (USD Billion) | |
      4. 7.14.4 BY TECHNOLOGY, 2025-2035 (USD Billion) | |
      5. 7.14.5 BY SERVICE TYPE, 2025-2035 (USD Billion) |
    161. 7.15 India MARKET SIZE ESTIMATES; FORECAST | |
      1. 7.15.1 BY APPLICATION, 2025-2035 (USD Billion) | |
      2. 7.15.2 BY END USE, 2025-2035 (USD Billion) | |
      3. 7.15.3 BY DRONE TYPE, 2025-2035 (USD Billion) | |
      4. 7.15.4 BY TECHNOLOGY, 2025-2035 (USD Billion) | |
      5. 7.15.5 BY SERVICE TYPE, 2025-2035 (USD Billion) |
    162. 7.16 Japan MARKET SIZE ESTIMATES; FORECAST | |
      1. 7.16.1 BY APPLICATION, 2025-2035 (USD Billion) | |
      2. 7.16.2 BY END USE, 2025-2035 (USD Billion) | |
      3. 7.16.3 BY DRONE TYPE, 2025-2035 (USD Billion) | |
      4. 7.16.4 BY TECHNOLOGY, 2025-2035 (USD Billion) | |
      5. 7.16.5 BY SERVICE TYPE, 2025-2035 (USD Billion) |
    163. 7.17 South Korea MARKET SIZE ESTIMATES; FORECAST | |
      1. 7.17.1 BY APPLICATION, 2025-2035 (USD Billion) | |
      2. 7.17.2 BY END USE, 2025-2035 (USD Billion) | |
      3. 7.17.3 BY DRONE TYPE, 2025-2035 (USD Billion) | |
      4. 7.17.4 BY TECHNOLOGY, 2025-2035 (USD Billion) | |
      5. 7.17.5 BY SERVICE TYPE, 2025-2035 (USD Billion) |
    164. 7.18 Malaysia MARKET SIZE ESTIMATES; FORECAST | |
      1. 7.18.1 BY APPLICATION, 2025-2035 (USD Billion) | |
      2. 7.18.2 BY END USE, 2025-2035 (USD Billion) | |
      3. 7.18.3 BY DRONE TYPE, 2025-2035 (USD Billion) | |
      4. 7.18.4 BY TECHNOLOGY, 2025-2035 (USD Billion) | |
      5. 7.18.5 BY SERVICE TYPE, 2025-2035 (USD Billion) |
    165. 7.19 Thailand MARKET SIZE ESTIMATES; FORECAST | |
      1. 7.19.1 BY APPLICATION, 2025-2035 (USD Billion) | |
      2. 7.19.2 BY END USE, 2025-2035 (USD Billion) | |
      3. 7.19.3 BY DRONE TYPE, 2025-2035 (USD Billion) | |
      4. 7.19.4 BY TECHNOLOGY, 2025-2035 (USD Billion) | |
      5. 7.19.5 BY SERVICE TYPE, 2025-2035 (USD Billion) |
    166. 7.20 Indonesia MARKET SIZE ESTIMATES; FORECAST | |
      1. 7.20.1 BY APPLICATION, 2025-2035 (USD Billion) | |
      2. 7.20.2 BY END USE, 2025-2035 (USD Billion) | |
      3. 7.20.3 BY DRONE TYPE, 2025-2035 (USD Billion) | |
      4. 7.20.4 BY TECHNOLOGY, 2025-2035 (USD Billion) | |
      5. 7.20.5 BY SERVICE TYPE, 2025-2035 (USD Billion) |
    167. 7.21 Rest of APAC MARKET SIZE ESTIMATES; FORECAST | |
      1. 7.21.1 BY APPLICATION, 2025-2035 (USD Billion) | |
      2. 7.21.2 BY END USE, 2025-2035 (USD Billion) | |
      3. 7.21.3 BY DRONE TYPE, 2025-2035 (USD Billion) | |
      4. 7.21.4 BY TECHNOLOGY, 2025-2035 (USD Billion) | |
      5. 7.21.5 BY SERVICE TYPE, 2025-2035 (USD Billion) |
    168. 7.22 South America MARKET SIZE ESTIMATES; FORECAST | |
      1. 7.22.1 BY APPLICATION, 2025-2035 (USD Billion) | |
      2. 7.22.2 BY END USE, 2025-2035 (USD Billion) | |
      3. 7.22.3 BY DRONE TYPE, 2025-2035 (USD Billion) | |
      4. 7.22.4 BY TECHNOLOGY, 2025-2035 (USD Billion) | |
      5. 7.22.5 BY SERVICE TYPE, 2025-2035 (USD Billion) |
    169. 7.23 Brazil MARKET SIZE ESTIMATES; FORECAST | |
      1. 7.23.1 BY APPLICATION, 2025-2035 (USD Billion) | |
      2. 7.23.2 BY END USE, 2025-2035 (USD Billion) | |
      3. 7.23.3 BY DRONE TYPE, 2025-2035 (USD Billion) | |
      4. 7.23.4 BY TECHNOLOGY, 2025-2035 (USD Billion) | |
      5. 7.23.5 BY SERVICE TYPE, 2025-2035 (USD Billion) |
    170. 7.24 Mexico MARKET SIZE ESTIMATES; FORECAST | |
      1. 7.24.1 BY APPLICATION, 2025-2035 (USD Billion) | |
      2. 7.24.2 BY END USE, 2025-2035 (USD Billion) | |
      3. 7.24.3 BY DRONE TYPE, 2025-2035 (USD Billion) | |
      4. 7.24.4 BY TECHNOLOGY, 2025-2035 (USD Billion) | |
      5. 7.24.5 BY SERVICE TYPE, 2025-2035 (USD Billion) |
    171. 7.25 Argentina MARKET SIZE ESTIMATES; FORECAST | |
      1. 7.25.1 BY APPLICATION, 2025-2035 (USD Billion) | |
      2. 7.25.2 BY END USE, 2025-2035 (USD Billion) | |
      3. 7.25.3 BY DRONE TYPE, 2025-2035 (USD Billion) | |
      4. 7.25.4 BY TECHNOLOGY, 2025-2035 (USD Billion) | |
      5. 7.25.5 BY SERVICE TYPE, 2025-2035 (USD Billion) |
    172. 7.26 Rest of South America MARKET SIZE ESTIMATES; FORECAST | |
      1. 7.26.1 BY APPLICATION, 2025-2035 (USD Billion) | |
      2. 7.26.2 BY END USE, 2025-2035 (USD Billion) | |
      3. 7.26.3 BY DRONE TYPE, 2025-2035 (USD Billion) | |
      4. 7.26.4 BY TECHNOLOGY, 2025-2035 (USD Billion) | |
      5. 7.26.5 BY SERVICE TYPE, 2025-2035 (USD Billion) |
    173. 7.27 MEA MARKET SIZE ESTIMATES; FORECAST | |
      1. 7.27.1 BY APPLICATION, 2025-2035 (USD Billion) | |
      2. 7.27.2 BY END USE, 2025-2035 (USD Billion) | |
      3. 7.27.3 BY DRONE TYPE, 2025-2035 (USD Billion) | |
      4. 7.27.4 BY TECHNOLOGY, 2025-2035 (USD Billion) | |
      5. 7.27.5 BY SERVICE TYPE, 2025-2035 (USD Billion) |
    174. 7.28 GCC Countries MARKET SIZE ESTIMATES; FORECAST | |
      1. 7.28.1 BY APPLICATION, 2025-2035 (USD Billion) | |
      2. 7.28.2 BY END USE, 2025-2035 (USD Billion) | |
      3. 7.28.3 BY DRONE TYPE, 2025-2035 (USD Billion) | |
      4. 7.28.4 BY TECHNOLOGY, 2025-2035 (USD Billion) | |
      5. 7.28.5 BY SERVICE TYPE, 2025-2035 (USD Billion) |
    175. 7.29 South Africa MARKET SIZE ESTIMATES; FORECAST | |
      1. 7.29.1 BY APPLICATION, 2025-2035 (USD Billion) | |
      2. 7.29.2 BY END USE, 2025-2035 (USD Billion) | |
      3. 7.29.3 BY DRONE TYPE, 2025-2035 (USD Billion) | |
      4. 7.29.4 BY TECHNOLOGY, 2025-2035 (USD Billion) | |
      5. 7.29.5 BY SERVICE TYPE, 2025-2035 (USD Billion) |
    176. 7.30 Rest of MEA MARKET SIZE ESTIMATES; FORECAST | |
      1. 7.30.1 BY APPLICATION, 2025-2035 (USD Billion) | |
      2. 7.30.2 BY END USE, 2025-2035 (USD Billion) | |
      3. 7.30.3 BY DRONE TYPE, 2025-2035 (USD Billion) | |
      4. 7.30.4 BY TECHNOLOGY, 2025-2035 (USD Billion) | |
      5. 7.30.5 BY SERVICE TYPE, 2025-2035 (USD Billion) |
    177. 7.31 PRODUCT LAUNCH/PRODUCT DEVELOPMENT/APPROVAL | |
      1. 7.31.1 |
    178. 7.32 ACQUISITION/PARTNERSHIP | |

FAQs

What is the current valuation of the Drones and Aerial Inspection Services Market?

As of 2024, the market valuation was 9.1 USD Billion.

What is the projected market size for the Drones and Aerial Inspection Services Market by 2035?

The market is projected to reach 18.5 USD Billion by 2035.

What is the expected CAGR for the Drones and Aerial Inspection Services Market during the forecast period 2025 - 2035?

The expected CAGR for the market during this period is 6.66%.

Which application segments are expected to show significant growth in the Drones and Aerial Inspection Services Market?

Infrastructure Inspection and Construction Site Surveying are projected to grow from 2.5 to 5.0 USD Billion and 2.1 to 4.5 USD Billion, respectively.

What are the key end-use segments in the Drones and Aerial Inspection Services Market?

Key end-use segments include Industrial, which is expected to grow from 2.5 to 5.0 USD Billion, and Energy, projected to grow from 2.1 to 4.5 USD Billion.

Which drone types are anticipated to dominate the market?

Multirotor drones are expected to dominate, with a projected growth from 4.0 to 8.0 USD Billion.

What technologies are driving advancements in the Drones and Aerial Inspection Services Market?

Technologies such as Optical Imaging and LiDAR are expected to grow from 2.5 to 5.0 USD Billion and 2.0 to 4.0 USD Billion, respectively.

What services are included in the Drones and Aerial Inspection Services Market?

The market includes services like Data Collection, which is projected to grow from 2.5 to 5.0 USD Billion, and Maintenance Services, expected to grow from 2.1 to 4.5 USD Billion.

Who are the key players in the Drones and Aerial Inspection Services Market?

Key players include DJI, Parrot, senseFly, and Aeryon Labs, among others.

How does the Drones and Aerial Inspection Services Market compare to other sectors?

The market's growth trajectory suggests a robust expansion, particularly in sectors like Industrial and Energy, which are expected to see substantial increases in valuation.

Author
Author
Author Profile
Shubham Munde LinkedIn
Team Lead - Research
Shubham brings over 7 years of expertise in Market Intelligence and Strategic Consulting, with a strong focus on the Automotive, Aerospace, and Defense sectors. Backed by a solid foundation in semiconductors, electronics, and software, he has successfully delivered high-impact syndicated and custom research on a global scale. His core strengths include market sizing, forecasting, competitive intelligence, consumer insights, and supply chain mapping. Widely recognized for developing scalable growth strategies, Shubham empowers clients to navigate complex markets and achieve a lasting competitive edge. Trusted by start-ups and Fortune 500 companies alike, he consistently converts challenges into strategic opportunities that drive sustainable growth.
Share::
Request Free Sample
Download Free Sample

Kindly complete the form below to receive a free sample of this Report

Share::
Request Free Sample
Download PDF ×

We do not share your information with anyone. However, we may send you emails based on your report interest from time to time. You may contact us at any time to opt-out.