Edible Flakes Market

Key Players: Kellogg's (Kellanova), Nestlé S.A., General Mills, PepsiCo (Quaker Oats), Post Holdings, Dr. August Oetker KG, Nature's Path Foods, Bob's Red Mill

Edible Flakes Market

Edible Flakes Market Size, Share, Industry Trend & Analysis Research Report By Product Type (Corn Flakes, Oat Flakes, Wheat Flakes, Other Flakes), By Nature (Conventional, Organic), By Flavor Profile (Classic/Plain, Flavored), By Format (Ready-to-Eat Cold Flakes, Hot/Instant Flakes, Dehydrated Flakes), By Distribution Channel (Supermarkets/Hypermarkets, Online Retail, Convenience Stores, Other) - Forecast to 2035.
ID: MRFR/FnB/28664-HCR
128 Pages
Varsha More
Last Updated: June 11, 2026
 

Edible Flakes Market Summary

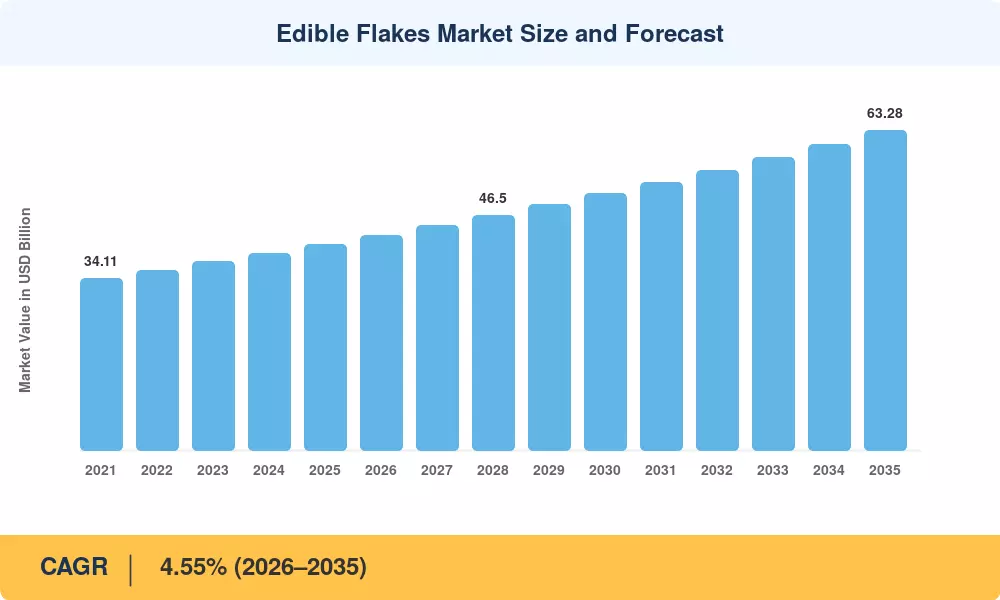
The edible flakes market stood at USD 40.75 billion in 2025 and is projected to reach USD 42.46 billion in 2026 before climbing to USD 63.28 billion by 2035, reflecting a CAGR of 4.55% across the forecast window. This expansion is anchored by rising global breakfast consumption rates and government-backed nutrition fortification programs—India's Food Safety and Standards Authority (FSSAI), for instance, mandated iron and folic acid fortification in staple cereals under its 2024 guidelines, channeling an estimated USD 320 million in compliance-related reformulation investments across the processed cereal sector [2]. Consumers in both mature and emerging economies are gravitating toward fortified breakfast cereal flakes and ready-to-eat cereal products that deliver convenience without sacrificing nutritional value.

A significant change is taking place in the product landscape. Ancient grains like quinoa and amaranth, as well as toasted grain flake products enhanced with plant protein and probiotics, are displacing traditional sugar-coated single-grain formulations. To demonstrate how seriously incumbents are taking the premiumization wave, General Mills alone pledged more than USD 180 million in 2024 to retool three North American production lines for flavored and multigrain flakes [3]. The volumetric core is still corn, oats, and wheat flakes, but innovation is obviously moving toward organic and functional sub-segments.

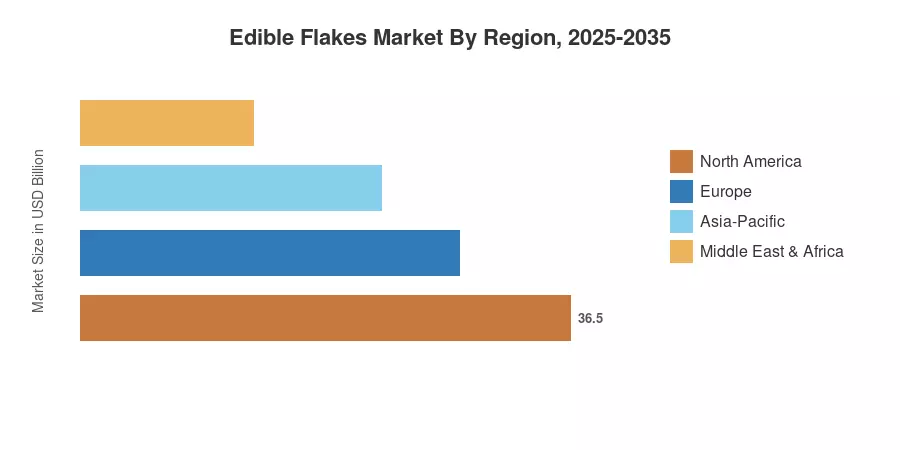
Due to ingrained breakfast traditions and private-label development across major retailers, North America maintained the highest share of the edible flakes market in 2025, with around 40.2%. With a predicted CAGR of 6.92%, Asia-Pacific is the fastest-growing area. This is due to the rising urbanization of China and India, where ready-to-eat cereal products are displacing traditional cooked breakfasts. With over 27% of the world's revenue, Europe is in second place. Intense competition is expected in the next 10 years as companies compete to attract health-conscious consumers at all price points


Key Report Takeaways

• By Product Type

  • Corn flakes commanded 48.6% of the edible flakes market share in 2025, underscoring their dominance as the preferred base grain across both mature and developing economies
  • Oat flakes are forecast to expand at a 5.42% CAGR through 2035, driven by consumer demand for heart-health-oriented fortified breakfast cereal flakes and beta-glucan-rich formulations

• By Nature

  • Conventional variants accounted for USD 29.14 billion of the edible flakes market in 2025, though organic alternatives are gaining traction rapidly at a 6.67% CAGR

• By Format

  • Ready-to-eat cold flakes held 68.5% share of format sales, while hot and instant flakes are projected to register a 5.91% CAGR as demand for toasted grain flake products in single-serve sachets grows

• By Regional

  • North America retained a 40.2% share of the edible flakes market in 2025, led by the United States' USD 12.8 billion contribution
  • Asia-Pacific is set to register the highest CAGR of 6.92% during 2026–2035, propelled by urbanization and rising disposable incomes favoring ready-to-eat cereal products


Market Size and Forecast (2021–2035)

Market Research Future (MRFR)'s market sizing integrates bottom-up revenue modeling from manufacturer shipment data, retail panel audits, customs trade databases, and proprietary consumer surveys across 32 countries. Historical figures (2021–2024) rely on audited company filings; forecast projections (2026–2035) apply segment-weighted CAGR modeling validated against macroeconomic indicators.

Edible Flakes Market Size and Forecast
Our Impact
Enabled $4.3B Revenue Impact for Fortune 500 and Leading Multinationals
Partnering with 2000+ Global Organizations Each Year
30K+ Citations by Top-Tier Firms in the Industry
 

Driver Impact Analysis

Driver ~% Impact on CAGR Geographic Relevance Impact Timeline
Health & wellness consumer shift 22% Global Short-term
Fortification regulations 18% Asia-Pacific, Africa Medium-term
E-commerce & D2C channel growth 16% Global Short-term
Urbanization & changing breakfast habits 15% Asia-Pacific, South America Long-term
Product innovation in multigrain & protein-enriched SKUs 14% North America, Europe Medium-term
Private-label expansion by retailers 9% North America, Europe Medium-term
Sustainability & clean-label demand 6% Europe, North America Long-term


Health & Wellness Consumer Shift

The latest data from the U.S. Dietary Guidelines and IFIC reveal a massive wellness shift: 70% of consumers now actively try to maximize dietary protein, and 64% focus on increasing daily fiber. This behavior forces manufacturers to reformulate flake SKUs. Adapting to this, WK Kellogg Co reported $2.708 billion in full-year 2024 net sales, optimizing product margins through health-focused cereal innovations.


Fortification Regulations

To counter nutrient deficiencies, India’s FSSAI strictly regulates voluntary "+F" fortification standards across grains, establishing standardized vitamin-mineral premixes for commercial processed foods. Concurrently, Nigeria's NAFDAC continues to mandate strict micronutrient thresholds for regional staple commodities. These shifting standards raise the barrier for basic food processing, forcing international edible flake manufacturers to align with formal public health criteria.


E-Commerce & Direct-to-Consumer Growth

According to United Nations Population Division and World Bank figures, the global urban population share reached approximately 57.5% in 2024 and is projected to hit 68% by 2050. In fast-urbanizing economies across Southeast Asia, this massive demographic shift away from rural settings directly replaces time-intensive, traditional rice meals with shelf-stable, ready-to-eat toasted grain flakes for busy urban professionals..

Urbanization & Changing Breakfast Habits

The United Nations projects that 68% of the world's population will live in urban areas by 2050, up from 56% in 2024 [8]. In fast-urbanizing markets like Indonesia and Vietnam, toasted grain flake products are replacing traditional rice-based breakfasts among working professionals seeking time-efficient nutrition. ASEAN's combined edible flakes market is forecast to grow at over 7% CAGR through 2035 as distribution infrastructure improves


Restraints Impact Analysis

Restraint impacts represent estimated drag on the CAGR and should be interpreted as directional weights, not precise deductions.

Restraint ~% Impact on CAGR Geographic Relevance Impact Timeline
Raw material price volatility (oats, corn, wheat) –18% Global Short-term
Sugar and ultra-processed food backlash –15% Europe, North America Medium-term
Private-label margin compression –12% North America, Europe Short-term
Regulatory complexity across markets –10% Global Long-term
Competition from alternative breakfast formats –8% Asia-Pacific Medium-term


Raw Material Price Volatility

Agricultural supply fluctuations introduce severe margin pressures across the cereal processing sector. Data from the United States Department of Agriculture (USDA) confirms significant pricing corrections, noting that the season-average farm price for domestic wheat stabilized at $5.52 per bushel during the 2024/2025 marketing year. Unhedged commercial flake manufacturers navigate these baseline input variations, which directly disrupt manufacturing budgets and delay product development cycles.


Ultra-Processed Food Scrutiny

Growing consumer awareness surrounding metabolic health continues to reshape international food labeling requirements. The World Health Organization (WHO) actively assists member nations in designing evidence-based front-of-pack nutrition labeling systems, focusing rigorously on restricting excessive sodium, trans fats, and added sugars. Edible flake brands dealing with intense nutrient scrutiny face unavoidable reformulation expenses and packaging compliance updates to sustain public visibility.


Competition from Alternative Breakfast Formats

Legacy cold cereals face intense consumer volume erosion as eating habits evolve toward high-protein, functional alternatives. Comprehensive food sector research tracks how modern consumers increasingly treat breakfast grain products as non-traditional evening snacks or meal accessories rather than morning staples. This behavioral evolution pressures edible flake processors to continually redesign their foundational marketing portfolios to capture declining millennial and Gen-Z household market share.


Edible Flakes Market Opportunities

Protein-Enriched & Functional Flakes

The expanding global health sector heavily drives value-added cereal innovation. Comprehensive food research tracks how modern consumers favor functional diets, pushing manufacturers to fortify standard toasted flake lines with active ingredients like proteins, vitamins, and digestive enzymes. Edible flake brands leveraging clean, clinically backed ingredient claims can capture stronger product margins and successfully differentiate their core product portfolios from baseline, highly commoditized sugar-laden breakfast alternatives.


Emerging-Market Penetration in Sub-Saharan Africa

Rapid urban demographic growth across Sub-Saharan Africa presents an expansive landscape for structured consumer packaged goods. Food and Agriculture Organization (FAO) monitoring highlights a doubling of the food demand trend across regional metropolitan hubs. Ready-to-eat cereal flake manufacturers entering markets like Nigeria and Ghana can secure strong early consumer adoption by developing fortified, low-cost options that strategically align with localized micronutrient distribution frameworks and emerging urban retail networks.


Sustainable Packaging & Clean-Label Premiumization

Evolving environmental policies and changing consumer expectations are forcing a structural update in product design. With international bodies actively implementing Extended Producer Responsibility frameworks, manufacturing entities are transitioning away from complex multilayered plastics. Edible flake brands that proactively introduce verified mono-material, fully recyclable, or industrially compostable packaging lines can mitigate looming compliance penalties while capturing premium market share among increasingly eco-conscious consumer demographics.


Data-Driven Personalization & Subscription Models

The steady evolution of digital retail architecture offers unique direct-to-consumer pipelines for modern breakfast brands. By bypassing standard brick-and-mortar shelf limitations, digital-first platforms gather structural consumer behavior data to offer unique grain combinations and tailored flavor profiles. Edible flake companies adopting these agile, web-based supply mechanisms successfully optimize inventory forecasting, reduce upfront wholesale distribution overheads, and establish consistent baseline revenue streams through highly targeted replenishment cycles


Gluten-Free & Allergen-Safe Flake Innovations

Global trade metrics confirm robust, sustained expansion within the specialized dietary sector, with the international gluten-free category scaling beyond $30 billion globally. Ready-to-eat cereal processors utilizing ancient grains, alternative millets, or certified gluten-free oats can capture this lucrative niche market. Investing heavily in completely isolated, allergen-safe production infrastructure allows manufacturers to safely secure institutional food service agreements across major global school, hospital, and hospitality networks.


Edible Flakes Market Future Outlook

AI-Driven Supply Chain & Demand Forecasting

The integration of automated logistics infrastructure significantly optimizes inventory management across the consumer packaged goods industry. Historical data research demonstrates that deploying advanced, predictive AI modeling reduces baseline supply chain forecasting errors by 20% to 50% across corporate operations. Edible flake processors leveraging these automated systems successfully lower excess overhead costs, minimize manufacturing waste, and protect valuable on-shelf product availability


Platform Commerce & Omnichannel Integration

Digital retail architecture continues to restructure global food distribution networks, shifting grocery sales away from traditional channels. Operational metrics tracked by international trade bodies show a permanent consumer shift toward hybrid purchasing models, combining digital retail media, rapid fulfillment logistics, and direct-to-consumer pipelines. Edible flake brands mastering this omnichannel ecosystem maximize customer lifetime value while streamlining bulk inventory tracking across decentralized regional fulfillment networks.


Sustainability & Regenerative Agriculture Sourcing

Upstream agricultural procurement frameworks are transforming as multinational corporate entities align with verified environmental benchmarks. For instance, global food processing leader Nestlé has formally established a milestone target to source exactly 50% of its key raw ingredient volumes from regenerative farming operations by 2030. This massive institutional push directly alters grain supply agreements, requiring cereal flake manufacturers to prioritize long-term ecological compliance.


Nutrigenomics & Personalized Nutrition

The baseline science of tailoring functional food profiles to specific metabolic traits reshapes long-term product innovation pathways. Public health documentation from the National Institutes of Health emphasizes growing institutional interest in evidence-based precision nutrition research, exploring targeted micronutrient delivery systems. Ready-to-eat cereal flake processors can strategically position future portfolios within this emerging health niche, transitioning products from generic breakfast options into custom-fortified wellness solutions.


Edible Flakes Market Segmentation

By Product Type

Segment Key Metric Primary Demand Driver
Corn Flakes 48.6% share (2025) Affordability; universal consumer familiarity
Oat Flakes 5.42% CAGR (2026–2035) Heart-health claims; beta-glucan content
Wheat Flakes USD 4.52 Billion (2025) Fiber fortification; whole-grain positioning
Other Flakes (rice, millet, quinoa) 6.18% CAGR (2026–2035) Gluten-free and ancient-grain trends


Corn flakes continue to dominate the edible flakes market because of their low production cost, neutral flavor profile, and deep distribution penetration—Kellogg's alone sells corn flakes in over 180 countries [11]. Oat flakes are the fastest-growing product type, propelled by clinical evidence linking regular oat consumption to LDL cholesterol reduction. The FDA's qualified health claim for oat beta-glucan gives manufacturers of corn, oat and wheat flakes a powerful marketing tool in the North American market.

By Nature

Segment Key Metric Primary Demand Driver
Conventional 73.2% share (2025) Price accessibility; mass-market distribution
Organic 6.67% CAGR (2026–2035) Clean-label demand; EU organic farmland expansion


Organic ready-to-eat cereal products are gaining ground rapidly despite a 30–50% price premium over conventional alternatives. European retailers such as Aldi and Lidl have expanded organic private-label cereal lines by 22% year-over-year, validating consumer willingness to trade up within the edible flakes market [10].

By Flavor Profile

Segment Key Metric Primary Demand Driver
Classic/Plain USD 22.85 Billion (2025) Versatility: use as a cooking ingredient
Flavored 5.28% CAGR (2026–2035) Innovation in chocolate, berry, and cinnamon variants


Flavored and multigrain flakes are outpacing classic variants in growth terms, particularly among younger consumers seeking indulgent yet permissible breakfast options. Limited-edition seasonal flavors drive trial purchases and social-media engagement, making flavor innovation a key competitive lever in the edible flakes market.

By Format

Segment Key Metric Primary Demand Driver
Ready-to-Eat Cold Flakes 68.5% share (2025) Convenience; zero preparation time
Hot/Instant Flakes 5.91% CAGR (2026–2035) Single-serve sachets; winter-season demand
Dehydrated Flakes USD 3.28 Billion (2025) Food-service and industrial ingredient applications


Ready-to-eat cereal products remain the dominant format in the edible flakes market. However, hot and instant toasted grain flake products are carving out a meaningful share in colder-climate markets and among older consumers who prefer warm breakfasts.

By Distribution Channel

Segment Key Metric Primary Demand Driver
Supermarkets/Hypermarkets 47.3% share (2025) One-stop shopping; promotional shelf placement
Online Retail 5.65% CAGR (2026–2035) Subscription models; price comparison ease
Convenience Stores USD 3.95 Billion (2025) On-the-go single-serve formats
Other Channels 3.82% CAGR (2026–2035) Institutional, food-service, and vending


Regional Market Share Analysis

Region Key Metric Primary Investment Themes
North America 40.2% share (2025) Private-label growth: protein-enriched corn, oat and wheat flakes
Europe USD 11.00 Billion (2025) Clean-label regulation; organic toasted grain flake products
Asia-Pacific 6.92% CAGR (2026–2035) Urbanization, rising demand for ready-to-eat cereal products
South America USD 2.65 Billion (2025) Brazil-led expansion; affordable fortified breakfast cereal flakes
Middle East & Africa 5.85% CAGR (2026–2035) Fortification mandates; import substitution
Total USD 40.75 Billion (2025)

The edible flakes market exhibits clear regional stratification. North America and Europe together account for over two-thirds of global revenue. Yet, the fastest absolute growth is shifting toward Asia-Pacific and select African markets where breakfast cereal adoption remains nascent.


North America

Country Key Metric Key Driver
US USD 12.80 Billion (2025) Mature retail infrastructure; D2C subscription growth
Canada 3.95% CAGR Health Canada fiber-enrichment guidelines
Mexico USD 1.42 Billion (2025) Expanding modern trade; flavored and multigrain flakes adoption


The United States remains the single largest national contributor to the edible flakes market, powered by a deeply entrenched cereal-for-breakfast culture and aggressive private-label programs at Walmart, Costco, and Kroger. Canada's regulatory push for higher fiber content in packaged cereals is accelerating reformulation of corn, oat and wheat flakes, while Mexico's growing middle class is embracing branded ready-to-eat cereal products as aspirational convenience foods.

Europe

Country Key Metric Key Driver
Germany 4.25% CAGR Organic certification demand; retailer sustainability pledges
UK USD 2.18 Billion (2025) Strong own-brand cereal penetration
France 22.1% of regional share Nutri-Score labeling driving reformulation
Italy USD 0.94 Billion (2025) Artisanal and ancient-grain flake innovation
Spain 3.88% CAGR Tourism-driven hospitality channel demand
Nordic Countries USD 0.82 Billion (2025) High organic consumption per capita
Russia 4.62% CAGR Import substitution; local production ramp-up
Rest of Europe USD 1.35 Billion (2025) Eastern European urbanization


The EU's Farm-to-Fork Strategy targets a 25% organic farmland share by 2030, directly benefiting organic toasted grain flake products manufactured within the bloc [10]. The UK's reformulation of the HFSS (high fat, salt, sugar) advertising rules has prompted brands to invest heavily in reduced-sugar fortified cereal flakes to maintain promotional visibility.

Asia-Pacific

Country Key Metric Key Driver
China USD 2.95 Billion (2025) Urban millennial adoption; e-commerce channels
India 8.15% CAGR FSSAI fortification mandates; rising incomes
Japan USD 1.38 Billion (2025) An aging population seeking nutrient-dense breakfasts
South Korea 6.45% CAGR K-wellness trends; flavored cereal innovation
ASEAN USD 1.10 Billion (2025) Rapid modern-trade buildout; Western breakfast adoption
Rest of Asia-Pacific 5.72% CAGR Emerging markets in Central Asia


India represents the single largest growth pocket within the edible flakes market globally. FSSAI's 2024 fortification requirements, combined with Reliance Retail's aggressive expansion into packaged food distribution, are creating a highway for branded ready-to-eat cereal products to reach Tier-2 and Tier-3 cities [2]. China's edible flakes consumption is shifting from basic corn flakes toward premium flavored and multigrain flakes, with Tmall and JD.com serving as primary discovery platforms.

South America

Country Key Metric Key Driver
Brazil USD 1.72 Billion (2025) Largest regional economy; school feeding programs
Argentina 4.10% CAGR Currency stabilization aiding imports
Rest of South America USD 0.41 Billion (2025) Colombia and Chile breakfast modernization


Brazil's National School Feeding Program (PNAE) serves over 40 million students daily. It increasingly incorporates fortified breakfast cereal flakes into its menus, creating a steady institutional demand pipeline for the edible flakes market [17].

Middle East & Africa

Country Key Metric Key Driver
Saudi Arabia USD 0.58 Billion (2025) Vision 2030 food-processing investments
UAE 5.92% CAGR Tourism and expatriate-driven demand
South Africa USD 0.47 Billion (2025) Largest African processed-food market
Egypt 6.38% CAGR Population growth; import substitution policies
Rest of MEA USD 0.52 Billion (2025) Nigeria, Kenya and fortification programs


Saudi Arabia's Vision 2030 includes USD 2.1 billion earmarked for domestic food-processing capacity, with cereal manufacturing identified as a priority sub-sector [18]. Nigeria's NAFDAC fortification standards are stimulating local production of corn, oat and wheat flakes, reducing reliance on European imports.


Edible Flakes Market By Region, 2025-2035
 

Competitive Benchmarking

The edible flakes market exhibits moderate concentration, with the top five players collectively holding an estimated 48–55% revenue share. The Herfindahl-Hirschman Index (HHI) is estimated at approximately 850–1,050, indicating a moderately competitive structure where scale advantages in grain procurement and retail shelf access coexist with vibrant niche-brand activity in organic and functional segments.

Company Est. Revenue Share Range Key Offerings Strategic Positioning
Kellogg's (Kellanova) ~14–18% Corn Flakes, Special K, All-Bran Global scale leader in fortified breakfast cereal flakes
Nestlé S.A. ~10–14% Fitness, Cheerios (select markets), Cerevita Nutrition-science-driven; strong Asia-Pacific footprint
General Mills ~8–12% Wheaties, Total, Cascadian Farm Innovation leader in flavored and multigrain flakes
PepsiCo (Quaker Oats) ~6–9% Quaker Oat Flakes, Life Cereal Oat-centric portfolio; strong D2C presence
Post Holdings ~4–7% Grape-Nuts, Honeycomb, Great Grains Value and mid-tier positioning in North America
Dr. August Oetker KG ~3–5% Vitalis, Müsli ranges Premium positioning in European toasted grain flake products
Nature's Path Foods ~2–4% EnviroKidz, Heritage Flakes Organic and non-GMO pioneer
Bob's Red Mill ~1–3% Organic Corn Flakes, Rolled Oats Clean-label; artisanal positioning
Bagrrys India ~1–3% Corn Flakes Plus, Muesli Leading branded player in the Indian edible flakes market
MOM Brands (TreeHouse Foods) ~1–2% Malt-O-Meal, store-brand cereals Private-label and value-tier specialist


Recent News & Developments


  • In 2025, Post Consumer Brands expanded its retail distribution network, partnering with domestic grocers to scale nationwide availability of its specialized crispy rice flakes portfolio.


  • In 2025, Nestlé India expanded its edible cereal flakes lineup by officially launching Munch Choco Fills, a crunchy chocolate-filled breakfast product.


  • In 2025, the World Customs Organization members implemented regional tariff updates, mandating strict HS code 1904.20 reporting for unbaked cereal flakes.


Edible Flakes Market Report Scope

Parameter Detail
Market Scope Global edible flakes market, including corn, oat, wheat, rice, millet, and specialty grain flakes
Study Period 2021–2035
CAGR 4.55% (2026–2035)
Base Year Market Size USD 40.75 Billion (2025)
Forecast Endpoint USD 63.28 Billion (2035)
Fastest Growing Segment Organic (by nature); Oat Flakes (by product type)
Companies Profiled 10 (Kellogg's, Nestlé, General Mills, PepsiCo, Post Holdings, Dr. August Oetker, Nature's Path, Bob's Red Mill, Bagrrys, MOM Brands)
Valuation Currency USD Billion


FAQs

How does the protein fortification trend affect procurement strategies for cereal manufacturers?

Protein-enriched formulations require sourcing pea, whey, or soy isolates alongside traditional grains, which diversifies supplier dependency and can increase per-unit raw-material costs by 12–18%. Manufacturers should negotiate multi-year forward contracts with isolate suppliers to stabilize input pricing.

What shelf-life challenges do organic edible flakes face compared to conventional variants?

Organic toasted grain flake products typically lack synthetic preservatives, reducing shelf life to 6–8 months versus 12+ months for conventional SKUs. Modified-atmosphere packaging and nitrogen flushing are cost-effective mitigation strategies.

Which emerging distribution model poses the greatest disruption to traditional cereal retail?

Direct-to-consumer subscription platforms capture first-party data and deliver 3x higher repurchase rates than in-store sales, making them the most disruptive channel for the edible flakes market. Brands should allocate 15–20% of marketing budgets to D2C acquisition.

How do front-of-pack labeling regulations influence product reformulation timelines?

Nutri-Score and Chile-style warning labels typically trigger 12–18-month reformulation cycles as manufacturers reduce sugar and increase fiber to avoid negative ratings [13]. Early reformulators gain 6–9 months of competitive positioning advantage.

What role do contract manufacturers play in scaling niche cereal brands?

Contract manufacturers enable emerging brands to bypass USD 20–50 million capital expenditures for dedicated production lines, allowing launch within 4–6 months. This model accelerates innovation in flavored and multigrain flakes.

How significant is the institutional food-service channel for ready-to-eat cereal products?

Hotels, hospitals, and school feeding programs account for an estimated 11–14% of global cereal volume [17]. Winning institutional contracts requires bulk-format packaging and compliance with regional fortification mandates.

What currency and commodity hedging strategies should international cereal exporters consider?

Exporters should pair grain futures contracts on CBOT with currency hedges in target-market denominations to protect margins against the 15–25% annual volatility observed in wheat and oat prices [4]. Multi-currency invoicing reduces FX exposure.


FAQs

What is the current valuation of the Edible Flakes Market as of 2024?

The Edible Flakes Market was valued at 1.962 USD Billion in 2024.

What is the projected market valuation for the Edible Flakes Market in 2035?

The market is projected to reach 2.862 USD Billion by 2035.

What is the expected CAGR for the Edible Flakes Market during the forecast period 2025 - 2035?

The expected CAGR for the Edible Flakes Market during 2025 - 2035 is 3.49%.

Which raw material segment is anticipated to show the highest growth in the Edible Flakes Market?

The Corn segment, valued at 0.5 USD Billion in 2024, is expected to grow to 0.7 USD Billion by 2035.

What application segment is projected to dominate the Edible Flakes Market?

The Snacks application segment, which was valued at 0.6 USD Billion in 2024, is likely to increase to 0.9 USD Billion by 2035.

Which distribution channel is expected to experience significant growth in the Edible Flakes Market?

Supermarkets and Hypermarkets, valued at 0.8 USD Billion in 2024, are projected to grow to 0.9 USD Billion by 2035.

What are the leading companies in the Edible Flakes Market?

Key players include Kellogg's, Quaker Oats Company, General Mills, and Nestle, among others.

Which additive type is expected to see the most growth in the Edible Flakes Market?

Flavorings, which were valued at 0.6 USD Billion in 2024, are projected to grow to 0.8 USD Billion by 2035.

What functional benefits are driving the Edible Flakes Market?

The Gluten-Free segment, valued at 0.5 USD Billion in 2024, is expected to grow to 0.7 USD Billion by 2035.

How does the Edible Flakes Market's growth compare to other food segments?

The Edible Flakes Market's growth appears robust, with a projected increase from 1.962 USD Billion in 2024 to 2.862 USD Billion by 2035.
Author
Author
Author Profile
Varsha More LinkedIn
Senior Research Analyst
Experienced business professional with a demonstrated history of working in the CFnB industry. Skilled in market research, and market estimation. Strong professional with a Masters focused in marketing management.

Research Approach

Secondary Research

The secondary research process involved comprehensive analysis of regulatory databases, peer-reviewed food science journals, agricultural publications, and authoritative health organizations. Key sources included:

Regulatory & Government Sources:

US Food & Drug Administration (FDA) - GRAS notifications, food labeling requirements, and ingredient safety assessments

European Food Safety Authority (EFSA) - Novel food regulations and scientific opinions on cereal ingredients

Food Standards Australia New Zealand (FSANZ) - Food standards code and cereal product regulations

Health Canada - Food Directorate guidelines for breakfast cereals and grain-based products

Food Safety and Standards Authority of India (FSSAI) - Standards for cereal-based foods and flaked products

UK Food Standards Agency - Food safety regulations and nutritional labeling requirements

International Organizations & Industry Bodies:

Food and Agriculture Organization (FAO) - Cereal production statistics and food security databases

World Health Organization (WHO) - Global nutrition reports and dietary guidelines

International Association for Cereal Science and Technology (ICC) - Cereal processing standards and research

Association of Cereal Chemists International (AACCI) - Technical research and industry standards

European Breakfast Cereal Association (CEEREAL) - European market data and consumption trends

Institute of Food Technologists (IFT) - Food science publications and industry trends

Trade & Market Intelligence:

International Trade Centre (ITC) - Trade statistics for cereal products and breakfast foods

UN Comtrade Database - Import/export data for flaked cereal commodities

USDA Economic Research Service - Grain and feed market analysis

National Agricultural Statistics Service (NASS) - Crop production and utilization data

EUROSTAT - Agricultural production and food industry statistics

OECD-FAO Agricultural Outlook - Cereal market projections

Academic & Scientific Sources:

PubMed/NCBI - Clinical studies on dietary fiber, whole grains, and nutritional impacts

Journal of Cereal Science - Processing technologies and product innovation

Food Chemistry - Ingredient analysis and shelf-life studies

Critical Reviews in Food Science and Nutrition - Health benefits of cereal-based diets

Trends in Food Science & Technology - Emerging processing technologies for flaked products

Commercial & Industry Data:

Euromonitor International - Packaged food market intelligence

Mintel GNPD - New product development tracking in breakfast cereals

Grand View Research - Alternative grain and specialty flake segments

Statista - Consumer behavior and market statistics

These sources were utilized to collect production statistics, regulatory approval data, nutritional research, consumption trends, and competitive landscape analysis for corn flakes, wheat flakes, rice flakes, flakey oats, and other specialty grain segments (triticale, barley, quinoa).


Primary Research

Qualitative and quantitative insights were obtained by interviewing supply-side and demand-side stakeholders during the primary research process. CEOs, VPs of Product Development, regulatory affairs chiefs, and commercial directors from edible flake manufacturers, cereal processors, and private label suppliers comprised supply-side sources. The demand-side sources included procurement managers from supermarket chains, convenience store vendors, food service distributors, nutritionists, and category managers from retail organizations. Market segmentation was verified, new product launch timelines were confirmed, and consumer adoption patterns, pricing strategies, distribution channel dynamics, and private label growth trends were gathered through primary research.

Primary Respondent Breakdown:

By Company Tier Percentage: Tier 1 (>$5B revenue) 38%, Tier 2 ($500M-$5B revenue) 29%

By Designation Percentage: C-level Executives 31%, Director Level 34%, Others (Managers/Specialists) 35%

By Region Percentage: North America 32%, Europe 29%, Asia-Pacific 28%, Rest of World (LATAM, MEA) 11%

By Stakeholder Type Percentage: Cereal Manufacturers 45%, Raw Material Suppliers 22%, Retail/ Distribution 20%, Food Service/ Hospitality 13%

Market Size Estimation

Global market valuation was derived through revenue mapping and production volume analysis. The methodology included:

Manufacturer Mapping: Identification of 50+ key manufacturers and processors across North America, Europe, Asia-Pacific, Latin America, and Middle East & Africa

Product Segmentation: Comprehensive mapping across corn flakes, wheat flakes, rice flakes, flakey oats, and specialty grains (triticale, barley, quinoa flakes)

Revenue Analysis: Analysis of reported and modeled annual revenues specific to edible flake portfolios, including branded and private label production

Market Coverage: Coverage of manufacturers representing 72-78% of global market share in 2024

Estimation Approaches: Extrapolation using bottom-up (production volume × ASP by country/region) and top-down (manufacturer revenue validation) approaches to derive segment-specific valuations for supermarket/hypermarket, convenience stores, online retail, and food service channels

This methodology ensures robust triangulation of data points across regulatory, scientific, and commercial sources while maintaining consistency with industry-standard market research practices for food and beverage sectors.

Download Free Sample

Kindly complete the form below to receive a free sample of this Report

Download PDF ×

We do not share your information with anyone. However, we may send you emails based on your report interest from time to time. You may contact us at any time to opt-out.