Edible Animal Fat Market (2026 - 2035)

Edible Animal Fat Market Size, Share, Industry Trend & Analysis Research Report By Ingredient Type (Butter, Tallow, Lard, Liquid Gold, Others), By Form (Solid and Paste, Liquid), By Category (Conventional, Organic), By End-User (Food Processing Industry, Foodservice, Retail), By Geography (North America, Europe, Asia-Pacific, South America, Middle East and Africa) - Forecast to 2035

Forecast Period
2026-2035
CAGR
3.66%
2025 Market Size
USD 60.34 Billion
2035 Market Size
USD 85.59 Billion
Food, Beverages & Nutrition ● Updated August 26, 2026 Report ID: MRFR/FnB/2719-CR | Pages: 200 | Author: Snehal Singh

Edible Animal Fat Market Summary

The Edible Animal Fat Market was valued at USD 60.34 billion in 2025 and opens the forecast window at USD 61.93 billion in 2026, climbing to USD 85.59 billion by 2035 at a 3.66% CAGR. Two catalysts anchor that trajectory. First, the U.S. Dietary Guidelines Advisory Committee's 2025 review softened its posture on total saturated fat ceilings, giving formulators room to reinstate butterfat and beef tallow in retail bakery lines. Second, China's 14th Five-Year Plan for cold-chain logistics committed roughly USD 14 billion to refrigerated capacity, which directly improves shelf stability economics for solid fats moving into secondary cities [1][2].

The Edible Animal Fat Market is also experiencing a shift in processing economics. Continuous low-temperature systems are replacing legacy batch cookers with wet-rendering lines, which reduce the formation of free fatty acids and increase food-grade yield by four to six percentage points. Darling Ingredients alone allocated over USD 250 million in 2024 capital expenditures for specialty fractionation and plant enhancements [3].

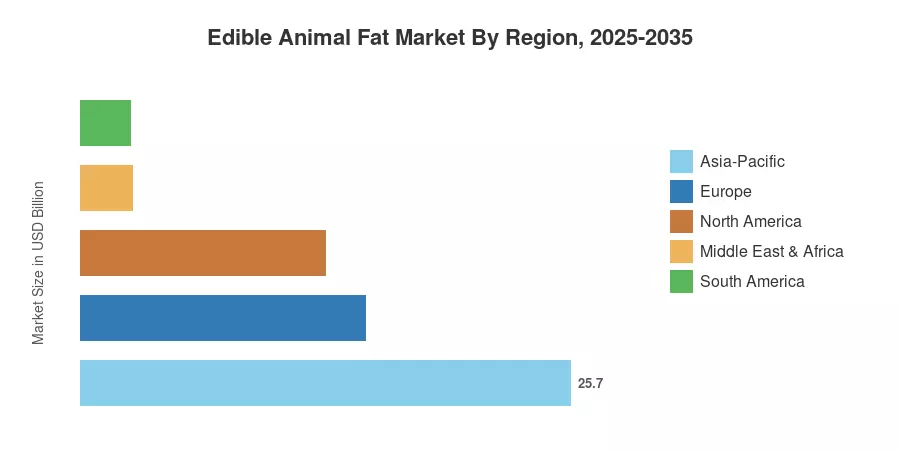
On a regional scale, Asia-Pacific is responsible for 42.6% of 2025 revenue and is also experiencing the most rapid growth, with a compound annual growth rate (CAGR) of 6.01%. Europe follows at 24.8%, bolstered by a mature charcuterie and bakery base and the EU's Animal By-Products Regulation, which provides Category 3 material with a distinct food-grade pathway. North America is the third-ranked region, but it has the highest per-unit pricing. The momentum through 2035 will be contingent upon the ability of renderers to defend food allocation against renewable diesel bidding [4].


Key Report Takeaways

• By Ingredient Type

  • Butter held 49.9% of Edible Animal Fat Market revenue in 2025, sustained by clean-label reformulation in premium bakery.
  • Lard is the fastest-advancing ingredient line at a 5.23% CAGR through 2035, led by Asian processed meat demand.
  • Tallow contributed roughly USD 13.52 billion in 2025 as quick-service frying reverted to animal-origin media.

• By Form

  • Solid and paste formats captured a 67.0% share in 2025 on the strength of laminated dough and confectionery use.


  • Liquid formats are forecast to reach USD 25.8 billion by 2035 as bulk foodservice tanks displace drummed supply.


• By Category

  • Organic is projected to compound at 6.71% through 2035, the highest rate of any category split

• By Region

  • Asia-Pacific leads the Edible Animal Fat Market with 42.6% of 2025 revenue
  • Europe's country base contributed USD 14.96 billion in 2025
  • Middle East & Africa is the smallest region at 4.5% share but benefits from halal-certified capacity build-outs


Market Size and Forecast (2021–2035)

Historical values were reconstructed from national rendering association tonnage disclosures, customs trade data for HS codes 1501–1506, and audited segment revenue from twelve publicly listed processors, then triangulated against foodservice purchasing indices. Forecast years apply a demand-side model weighted for per-capita fat consumption, packaged food output, and renderer allocation between food and fuel channels within the Edible Animal Fat Market.
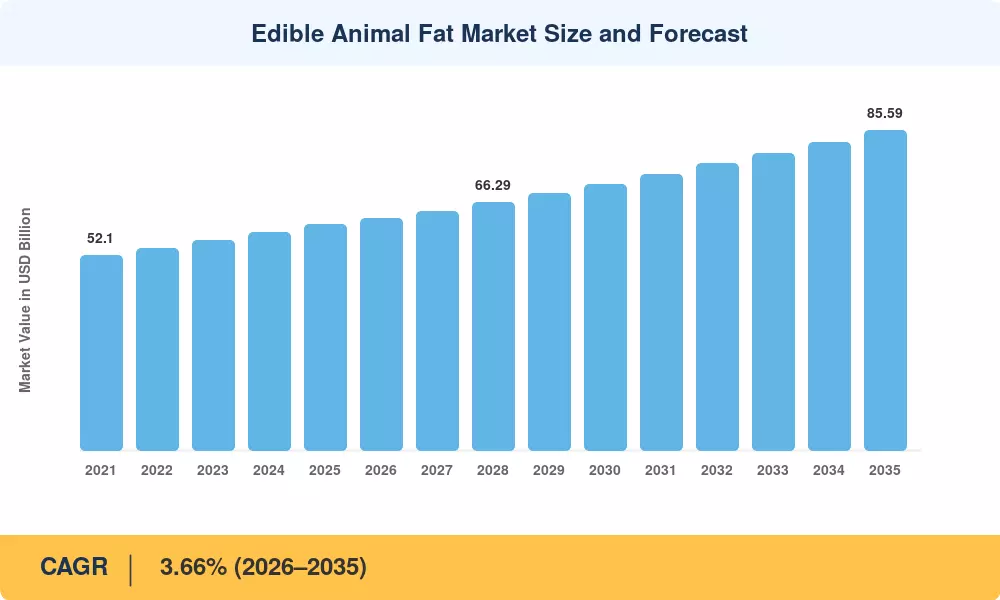
Edible Animal Fat Market Size and Forecast
Our Impact
Enabled $4.3B Revenue Impact for Fortune 500 and Leading Multinationals
Partnering with 2000+ Global Organizations Each Year
30K+ Citations by Top-Tier Firms in the Industry

Driver Impact Analysis

Driver ~% Impact on CAGR Geographic Relevance Impact Timeline
Clean-label reformulation in packaged foods 0.82 Global Medium-term (2–4 yr)
Asian processed meat and bakery output growth 0.74 Asia-Pacific Long-term (≥4 yr)
Softening of saturated fat policy language 0.51 North America, Europe Short-term (≤2 yr)
Continuous low-temperature rendering upgrades 0.44 Global Medium-term (2–4 yr)
Cold-chain infrastructure investment 0.39 Asia-Pacific, MEA Long-term (≥4 yr)
Halal and kosher certified capacity expansion 0.28 MEA, ASEAN Medium-term (2–4 yr)
Premium butterfat demand in confectionery 0.26 Europe, North America Short-term (≤2 yr)


Clean-Label Reformulation Pulls Animal Fats Back Onto Ingredient Decks

Shoppers now read decks, and manufacturers have responded. The 2024 global packaged food audit found that 38% of new bakery launches in Western Europe carried a "no artificial additives" claim, up from 24% in 2020, and butterfat frequently replaces interesterified vegetable blends in those reformulations [11]. That substitution is worth real volume to the Edible Animal Fat Market because a single laminated pastry line converting from margarine to butter can lift annual fat draw by 900 tonnes. Retail private label has followed the branded lead, compressing the price premium.

Asian Demand Structurally Outpaces the Global Average

China and Vietnam together added an estimated 2.1 million tonnes of processed pork output between 2021 and 2024, and lard remains the default carrier fat across that category [7]. India's organised bakery sector, growing at near 9% annually per FICCI estimates, contributes a second demand stream through ghee and butter-based lines [14]. Neither trend depends on Western dietary sentiment, which is precisely why the regional forecast decouples from the global mean.

Rendering Technology Lifts Food-Grade Yield

Continuous low-temperature systems hold cook temperatures below 95°C, which suppresses oxidation and preserves the sensory profile buyers pay for. European Fat Processors and Renderers Association members reported average food-grade recovery improvements of 4.8 percentage points across upgraded plants between 2022 and 2025 [15].


Restraints Impact Analysis

Restraint weightings reflect estimated drag on growth velocity under a base-case scenario. Values are comparative indicators rather than deductible components of the compound rate.

Restraint ~% Drag on CAGR Geographic Relevance Impact Timeline
Vegetable oil price competitiveness -0.68 Global Short-term (≤2 yr)
Saturated fat intake advisories -0.55 Europe, North America Long-term (≥4 yr)
Renewable diesel feedstock competition -0.47 North America, Europe Medium-term (2–4 yr)
Flexitarian and plant-based substitution -0.33 Europe, Oceania Long-term (≥4 yr)
Animal disease outbreak supply shocks -0.24 Asia-Pacific, Europe Short-term (≤2 yr)


Vegetable Oils Reset the Price Floor

Palm and soybean oil quotations retreated sharply from their 2022 peaks, with the FAO Vegetable Oil Price Index falling roughly 31% between March 2022 and mid-2024 before partially recovering [8]. Industrial buyers with dual-capable lines switch on spreads narrower than USD 120 per tonne, and that switching behaviour caps pricing power for renderers even when animal fat supply tightens. Bakery formulators are the most price-elastic cohort.

Fuel Demand Competes for the Same Barrel

Renewable diesel capacity in the United States expanded past 4.5 billion gallons per year by 2025, and tallow is among the preferred low-carbon-intensity feedstocks under California's Low Carbon Fuel Standard [6]. When credit prices rise, fuel buyers outbid food buyers for the same rendered stream. Food-grade allocation therefore behaves less like a supply curve and more like a policy variable.


Edible Animal Fat Market Opportunities

Renewable Diesel and Low-Carbon Energy Integration

Government energy transition audits highlight that U.S. renewable diesel production capacity expanded past 4.5 billion gallons annually, driving heavy industrial demand for waste fats. Regulatory frameworks like California's Low Carbon Fuel Standard (LCFS) incentivize low-carbon-intensity feedstocks, where high-grade tallow achieves carbon intensity scores significantly below standard vegetable oils. Renewable fuel refineries and energy conglomerates routinely outbid traditional food processing buyers for raw rendered streams, capturing upwards of 30% of total commercial tallow distribution channels.


.7 Biofuel-Driven Byproduct Valorization and Waste Management Infrastructure


Major agribusiness and rendering networks are accelerating capital investments into circular economy infrastructure, with processing facilities converting tens of millions of liters of used cooking oil and animal fats into high-grade biodiesel equivalents. Integrated processing enterprises execute multi-million dollar plant capital updates—such as a recent USD 8.97 million investment by Sanimax into advanced biofilter air-treatment and carcass-recovery systems—to maximize raw material processing yields.


Traceability Data as a Revenue Line

Buyers increasingly pay for provenance, not just product. Blockchain-linked lot tracing pilots run by European processors have supported price uplifts of 3–5% on documented single-origin fats, and the same data layer satisfies EU Deforestation Regulation-adjacent due diligence expectations that downstream brands now push upstream [19]. Selling verified chain-of-custody alongside tonnage converts a compliance cost into a margin contributor within the Edible Animal Fat Market.


Halal-Certified Bovine and Ovine Streams

Global halal food trade is projected to exceed USD 2.1 trillion by 2030, and certified beef tallow is structurally short across ASEAN and the Gulf [12]. Dedicated segregated lines, rather than campaign-run certification, are what large buyers now specify.


Edible Animal Fat Market Future Outlook

Allocation Modelling Becomes a Core Competency

Renderers will increasingly run optimisation models that price food-grade and fuel-grade offtake hour by hour. The Edible Animal Fat Market will feel this as widened bid-ask volatility rather than absolute shortage, particularly in years when the IEA's renewable fuel demand projections — roughly 6% annual biofuel growth to 2030 — coincide with weak livestock cycles [21].

Fractionation and Specialty Lipids Deepen

Commodity whole fats will grow near the market mean; fractions and enzymatically modified lipids will grow faster. Expect specialty output to move from roughly 8% of processed volume today toward the mid-teens by 2035 as infant nutrition and confectionery buyers specify tighter melting profiles [15].

Traceability Requirements Harden

Downstream brands are extending supplier due diligence to animal-origin inputs, and OECD-FAO outlook commentary flags provenance documentation as a rising cost of doing business in livestock-linked supply chains [22]. Processors without lot-level systems will lose access to premium accounts before they lose volume.

Emissions Accounting Reshapes Siting Decisions

Scope 3 disclosure regimes now capture rendered inputs, and the carbon intensity of a given fat varies materially by transport distance and cook energy source. Plants powered by biogas from their own effluent streams will hold a measurable advantage. Siting decisions across the Edible Animal Fat Market will increasingly follow renewable energy availability, not just abattoir proximity [23].


Edible Animal Fat Market Segmentation

Segmentation within the Edible Animal Fat Market splits along ingredient type, physical form, production category, and end-user channel.

By Ingredient Type

Segment Metric Primary Demand Driver
Butter 49.9% share (2025) Premium bakery and retail spreads
Tallow USD 13.52 billion (2025) Commercial frying and savoury processing
Lard 5.23% CAGR (2026–2035) Asian processed meat and pastry
Liquid Gold 7.3% share (2025) Bulk industrial frying media
Others USD 3.20 billion (2025) Poultry and duck fat specialty use


Butter's dominance inside the Edible Animal Fat Market reflects both price per tonne and irreplaceability — no vegetable analogue matches its flavour release in laminated dough. Lard is the growth story instead of the size story: Asian pork processing consumes it structurally, and Latin American baking is rebuilding volumes lost to shortening during the 1990s. Tallow occupies the most contested position, since it is the fat that fuel refiners want most.

By Form

Segment Metric Primary Demand Driver
Solid and Paste 67.0% share (2025) Bakery lamination, confectionery, retail packs
Liquid 4.99% CAGR (2026–2035) Bulk foodservice tank delivery


Solid formats hold share because most high-value applications require plastic fat behaviour. Liquid grows faster on logistics economics — tanker delivery into large frying operations removes packaging and labour cost, and fractionated olein makes liquid supply feasible in temperate climates.

By Category

Segment Metric Primary Demand Driver
Conventional 75.1% share (2025) Cost-led industrial procurement
Organic 6.71% CAGR (2026–2035) Retail premiumisation and export demand


Conventional supply will remain the volume backbone throughout the forecast. Organic expansion is supply-limited rather than demand-limited, which is why certified herd contracting has become the practical bottleneck [9].

By End-User

Segment Metric Primary Demand Driver
Food Processing Industry 88.1% share (2025) Bakery, confectionery, processed meat manufacturing
Foodservice USD 4.59 billion (2025) Restaurant and quick-service frying
Retail 6.23% CAGR (2026–2035) Home cooking revival and specialty grocery


Industrial processors buy the overwhelming majority of tonnage in the Edible Animal Fat Market, which concentrates commercial negotiation into a relatively small number of accounts. Retail is small but strategically useful — it carries the highest margin per kilogram and shapes consumer sentiment that eventually flows back into industrial specification.


Regional Market Share Analysis

Region Key Metric (2025 unless noted) Primary Investment Themes
Asia-Pacific 42.6% revenue share Cold chain, lard capacity, bakery expansion
Europe USD 14.96 billion Organic certification, fractionation, EU by-product compliance
North America 21.3% revenue share Food-vs-fuel allocation, tallow frying revival
South America 4.31% CAGR (2026–2035) Export-oriented beef rendering, port logistics
Middle East & Africa USD 2.73 billion Halal segregation, greenfield rendering plants
Total USD 60.34 billion

Regional performance across the Edible Animal Fat Market diverges sharply on dietary tradition and processing infrastructure rather than income level alone.


North America

Country Metric Key Driver
US 78.4% of regional revenue Quick-service frying reversion to beef tallow
Canada USD 1.61 billion Dairy butterfat processing base
Mexico 4.62% CAGR (2026–2035) Lard demand in traditional and industrial baking


Policy noise defines the North American picture. The Edible Animal Fat Market here absorbed a visible demand shock when several national restaurant chains publicised tallow frying conversions during 2024–2025, while the Low Carbon Fuel Standard simultaneously pulled the same feedstock toward refineries [6]. Renderers with dual-channel optionality captured the spread; single-channel food suppliers did not.

Europe

Country Metric Key Driver
Germany 21.8% of regional revenue Charcuterie and processed meat scale
UK USD 2.19 billion Retail butter premiumisation
France 17.4% of regional revenue Viennoiserie and butter-intensive bakery
Italy USD 1.71 billion Cured pork fat traditions
Spain 4.11% CAGR (2026–2035) Iberian lard and export processing
Nordic Countries 6.2% of regional revenue Organic dairy fat supply
Russia USD 1.28 billion Domestic rendering self-sufficiency
Rest of Europe 11.9% of regional revenue Central European capacity consolidation


Regulation, more than taste, sets the European ceiling. Regulation (EC) No 1069/2009 defines which Category 3 material may enter the food chain, and compliance investment has concentrated volume among fewer, larger operators [4]. Nordic organic supply is the standout growth pocket.

Asia-Pacific

Country Metric Key Driver
China 46.1% of regional revenue Processed pork and lard-based cooking
India 7.12% CAGR (2026–2035) Ghee and organised bakery expansion
Japan USD 2.84 billion Confectionery butterfat imports
South Korea 5.9% of regional revenue Convenience food manufacturing
ASEAN USD 3.36 billion Halal tallow and instant noodle frying
Rest of Asia-Pacific 6.8% of regional revenue Emerging cold-chain access


Scale is the story. The Edible Animal Fat Market in Asia-Pacific benefits from a consumption base where rendered fats were never displaced by nutritional guidance, so growth tracks food processing output almost directly. China's cold-chain programme is the single largest enabling investment, extending solid-fat distribution into tier-three cities [2].

South America

Country Metric Key Driver
Brazil 62.3% of regional revenue Integrated beef slaughter and rendering
Argentina USD 0.98 billion Beef tallow export capacity
Rest of South America 13.9% of regional revenue Poultry fat recovery in Chile and Colombia


Brazil's advantage is structural integration — the same groups that slaughter also render, which compresses feedstock cost. Export orientation exposes the region to freight and currency swings, though ABIEC data show tallow shipments rising steadily alongside beef volumes [20].

Middle East & Africa

Country Metric Key Driver
Saudi Arabia 24.6% of regional revenue Halal-certified imports for bakery
UAE USD 0.51 billion Re-export and foodservice hub role
South Africa 19.8% of regional revenue Established commercial rendering base
Egypt 6.84% CAGR (2026–2035) Poultry processing growth
Rest of MEA USD 0.74 billion Greenfield abattoir-linked capacity


Capacity, not appetite, is the binding constraint. Recovery rates across sub-Saharan abattoirs remain far below European benchmarks, and each new food-grade plant converts waste disposal cost into saleable product [12].


Edible Animal Fat Market By Region, 2025-2035

Competitive Benchmarking

Concentration is moderate. The estimated HHI sits near 780, with the top five suppliers holding a combined 31–37% of the Edible Animal Fat Market. Regional renderers and cooperative dairies fill the remainder, so the structure reads as consolidated at the top and fragmented below — a pattern that favours acquirers with logistics density.

Company Est. Revenue Share Range Key Offerings for Edible Animal Fat Market Strategic Positioning
Darling Ingredients ~9–12% Edible tallow, lard, specialty fractions Scale renderer with dual food and fuel channels
Cargill ~7–10% Butterfat blends, industrial frying fats Global sourcing reach and formulation services
Fonterra Co-operative Group ~6–9% Anhydrous milk fat, butter, cream products Dairy-fat specialist with Asia-Pacific distribution
Arla Foods ~5–7% Butter, butter oil, organic dairy fat Strong European organic certification base
Baker Commodities ~3–5% Edible tallow, choice white grease Regional North American rendering density
Ten Kate Holding ~2–4% Fractionated animal fats, food-grade lard Specialty fractionation and export focus
Saria / SARVAL ~2–4% Category 3 derived edible fats Integrated European by-product processing
Land O'Lakes ~2–4% Butter and butterfat ingredients Cooperative supply security in North America
Colyer Fehr Tallow ~1–3% Edible tallow for food manufacturing Oceania supply into Asian processors
Valley Proteins ~1–3% Rendered edible fats and oils Abattoir-adjacent collection network
JBS (Rendering Division) ~1–3% Beef tallow, integrated by-product streams Slaughter-linked feedstock advantage


Recent News & Developments


  • U.S. Dietary Guidelines Advisory Committee (December 2024): Issued scientific report language that reframed saturated fat guidance around replacement quality, opening reformulation space for animal-origin fats [1]
  • Fonterra (July 2024): Expanded anhydrous milk fat capacity at its Clandeboye site to serve Southeast Asian bakery and confectionery customers [13]
  • European Commission (September 2023): Updated Animal By-Products implementing guidance clarifying Category 3 food-chain eligibility documentation for rendered fats [4]


  • Arla Foods (February 2025): Extended organic farmer contracts covering certified butterfat supply through 2029 to secure premium-channel volume [9]
  • California Air Resources Board (November 2024): Approved amendments strengthening Low Carbon Fuel Standard targets, intensifying refinery competition for tallow feedstock [6]
  • Saudi Food and Drug Authority (June 2025): Published revised halal certification procedures for imported edible fats, tightening segregation documentation requirements [12]


Edible Animal Fat Market Report Scope

Parameter Detail
Market Scope Global Edible Animal Fat Market across ingredient type, form, category, end-user, and geography
Study Period 2021–2035 (Historical 2021–2024; Base Year 2025; Forecast 2026–2035)
CAGR 3.66% (2026–2035)
Market Size Checkpoints USD 60.34 Billion (2025); USD 61.93 Billion (2026); USD 85.59 Billion (2035)
Fastest Growing Segments Lard (ingredient type); Liquid (form); Organic (category); Retail (end-user)
Companies Profiled 11 major suppliers including Darling Ingredients, Cargill, Fonterra, Arla Foods, Ten Kate Holding
Valuation Currency USD Billion

FAQs

What contract structures protect food buyers from fuel-driven feedstock competition in the Edible Animal Fat Market?
Multi-year volume commitments with indexed pricing tied to a published fat quotation work better than spot purchasing. Buyers increasingly add right-of-first-refusal clauses on food-grade output. [6]
How should procurement teams audit a supplier's food-grade rendering capability?
Inspect cook temperature records, free fatty acid trend data, and segregation controls between food and technical streams. Certification alone does not confirm consistent food-grade discipline in the Edible Animal Fat Market. [15]
Which quality specification matters most when switching from vegetable shortening in the Edible Animal Fat Market?
Solid fat content profile across the working temperature range determines whether a line runs without adjustment. Peroxide value and melting point follow in importance. [24]
Are private-equity buyers active in this sector?
Yes, particularly in mid-scale regional renderers where logistics density creates defensible route economics. Deal activity concentrates in North America and Central Europe. [25]
What integration challenges arise when adding fractionation to an existing plant in the Edible Animal Fat Market?
Crystallisation control demands stable upstream feed quality, so plants with variable raw material struggle. Utility load and filtration capacity are the usual retrofit constraints. [15]
How do animal disease outbreaks transmit into pricing?
Herd culls reduce slaughter volumes within one to two quarters, tightening raw material before finished fat prices react. Regional outbreaks often shift trade flows rather than cut global supply. [18]
What emerging application deserves attention beyond traditional cooking uses?
Structured lipids for infant nutrition, where specific fatty acid positioning commands substantial premiums. Regulatory approval timelines are long but competitive barriers are correspondingly high. [22]      
Author
Author
Author Profile
Snehal Singh LinkedIn
Manager - Research
High acumen in analyzing complex macro & micro markets with more than 6 years of work experience in the field of market research. By implementing her analytical skills in forecasting and estimation into market research reports, she has expertise in Packaging, Construction, and Equipment domains. She handles a team size of 20-25 resources and ensures smooth running of the projects, associated marketing activities, and client servicing.
Share::
Request Free Sample

Research Approach


Secondary Research

The secondary research process involved comprehensive analysis of agricultural databases, food safety regulatory frameworks, industry trade publications, and commodity market intelligence reports. Key sources included the US Department of Agriculture (USDA), Food and Agriculture Organization of the United Nations (FAO), European Food Safety Authority (EFSA), US Food & Drug Administration (FDA), Codex Alimentarius Commission, Organisation for Economic Co-operation and Development (OECD)-FAO Agricultural Outlook, National Renderers Association (NRA), American Fats and Oils Association (AFOA), EU Association of the Industry of Oils and Fats (Fediol), Animal Agriculture Alliance, National Institute of Oilseed Products (NIOP), and national agricultural ministry reports from key beef, pork, and poultry producing nations. These sources were used to collect slaughter statistics, rendering industry capacity data, food safety regulatory standards, import/export trade flows, and consumption pattern analysis for edible tallow, lard, poultry fat, and other rendered animal fat categories.


Primary Research

To gather both qualitative and quantitative information, the primary research process involved interviewing players from both the supply and demand sides. Executives from integrated meat processing businesses, specialized rendering facilities, and animal fat refiners were among the supply-side sources. They included VPs of operations, heads of regulatory compliance, and procurement directors. Buyers from the food industry (bakery, confectionery, savory snacks), biodiesel manufacturers, animal nutrition formulators, and commodities merchants from strategic export and import areas made up the demand side. Timeliness of rendering technology adoption, market segmentation by fat type (tallow, lard, poultry fat), price volatility patterns, substitution dynamics with vegetable oils, and regulatory compliance costs were all confirmed through primary research.

Primary Respondent Breakdown:

By Designation: C-level Primaries (40%), Director Level (30%), Others (30%)

By Region: North America (30%), Europe (35%), Asia-Pacific (25%), Rest of World (10%)


Market Size Estimation

Global market valuation was derived through production volume mapping and price trend analysis across commodity exchanges. The methodology included:

Identification of 60+ key rendering and animal fat processing facilities across North America, Europe, Asia-Pacific, and Latin America

Product mapping across edible tallow, lard, poultry fat, specialty fats (oleo stock/stearin), and yellow grease categories

Analysis of reported and modeled annual revenues specific to edible-grade fat portfolios versus industrial/feed-grade segments

Coverage of processors and traders representing 75-80% of globally traded edible animal fat volumes in 2024

Extrapolation using bottom-up (slaughter volumes × rendering yields × edible-grade allocation × commodity pricing by region) and top-down (major processor revenue validation against USDA/FAO production statistics) approaches to derive segment-specific valuations across food applications, biodiesel feedstock, and oleochemical industries

Share::
Request Free Sample
Download Free Sample

Kindly complete the form below to receive a free sample of this Report

* Please use a valid business email

Share::
Request Free Sample
Download PDF ×

We do not share your information with anyone. However, we may send you emails based on your report interest from time to time. You may contact us at any time to opt-out.
















