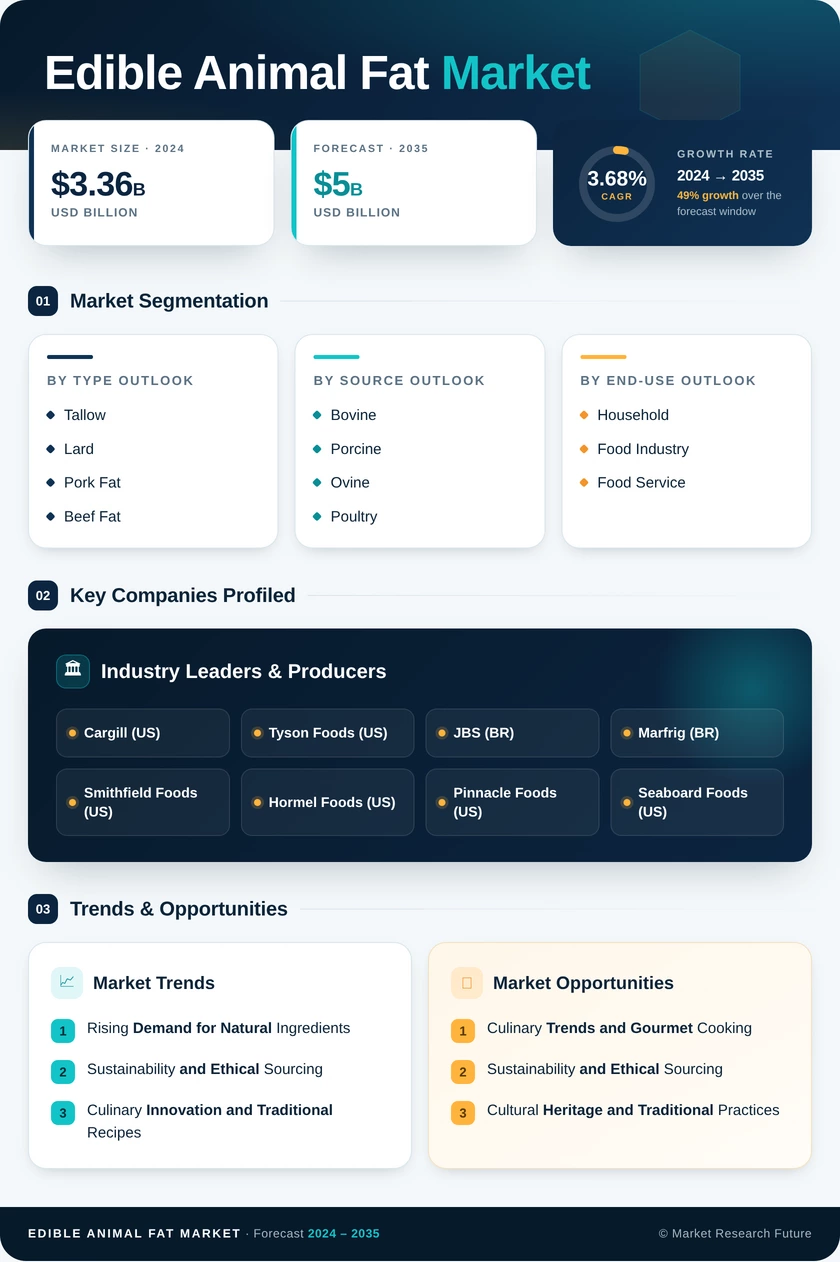
Edible Animal Fat Market (2026 - 2035)

Edible Animal Fat Market Size, Share, Industry Trend & Analysis Research Report By Ingredient Type (Butter, Tallow, Lard, Liquid Gold, Others), By Form (Solid and Paste, Liquid), By Category (Conventional, Organic), By End-User (Food Processing Industry, Foodservice, Retail), By Geography (North America, Europe, Asia-Pacific, South America, Middle East and Africa) - Forecast to 2035

Forecast Period
2026-2035
CAGR
3.66%
2025 Market Size
USD 60.34 Billion
2035 Market Size
USD 85.59 Billion
Food, Beverages & Nutrition ● Updated August 2026 Report ID: MRFR/FnB/2719-CR | Pages: 200 | Author: Snehal Singh
  1. 1 Market Summary |
    1. 1.1 Study Assumptions & Market Definition |
    2. 1.2 Scope of the Study |
    3. 1.3 Research Methodology
  2. 2 Key Report Takeaways |
    1. 2.1 By Ingredient Type |
    2. 2.2 By Form and Category |
    3. 2.3 By Geography
  3. 3 Market Size and Forecast (2021–2035) |
    1. 3.1 Historical Market Size (2021–2024) |
    2. 3.2 Base Year Estimate (2025) |
    3. 3.3 Forecast Market Size (2026–2035) |
    4. 3.4 Year-over-Year Growth Analysis
  4. 4 Driver Impact Analysis |
    1. 4.1 Clean-Label Reformulation in Packaged Foods |
    2. 4.2 Asian Processed Meat and Bakery Output Growth |
    3. 4.3 Continuous Low-Temperature Rendering Upgrades
  5. 5 Restraints Impact Analysis |
    1. 5.1 Vegetable Oil Price Competitiveness |
    2. 5.2 Renewable Fuel Feedstock Competition
  6. 6 Opportunities |
    1. 6.1 Organic and Pasture-Raised Premiumisation |
    2. 6.2 Emerging-Market Capacity Gaps |
    3. 6.3 Traceability Data Monetisation |
    4. 6.4 Fractionation for Functional Applications |
    5. 6.5 Halal-Certified Bovine and Ovine Streams
  7. 7 Regional Market Share and Country-Level Analysis |
    1. 7.1 North America | |
      1. 7.1.1 US | |
      2. 7.1.2 Canada | |
      3. 7.1.3 Mexico |
    2. 7.2 Europe | |
      1. 7.2.1 Germany | |
      2. 7.2.2 UK | |
      3. 7.2.3 France | |
      4. 7.2.4 Italy | |
      5. 7.2.5 Spain | |
      6. 7.2.6 Nordic Countries | |
      7. 7.2.7 Russia | |
      8. 7.2.8 Rest of Europe |
    3. 7.3 Asia-Pacific | |
      1. 7.3.1 China | |
      2. 7.3.2 India | |
      3. 7.3.3 Japan | |
      4. 7.3.4 South Korea | |
      5. 7.3.5 ASEAN | |
      6. 7.3.6 Rest of Asia-Pacific |
    4. 7.4 South America | |
      1. 7.4.1 Brazil | |
      2. 7.4.2 Argentina | |
      3. 7.4.3 Rest of South America |
    5. 7.5 Middle East & Africa | |
      1. 7.5.1 Saudi Arabia | |
      2. 7.5.2 UAE | |
      3. 7.5.3 South Africa | |
      4. 7.5.4 Egypt | |
      5. 7.5.5 Rest of Middle East & Africa
  8. 8 Future Outlook (2026–2035) |
    1. 8.1 Allocation Modelling as Core Competency |
    2. 8.2 Fractionation and Specialty Lipids |
    3. 8.3 Traceability Requirements |
    4. 8.4 Emissions Accounting and Plant Siting
  9. 9 Market Segmentation Analysis |
    1. 9.1 By Ingredient Type | |
      1. 9.1.1 Butter | |
      2. 9.1.2 Tallow | |
      3. 9.1.3 Lard | |
      4. 9.1.4 Liquid Gold | |
      5. 9.1.5 Others |
    2. 9.2 By Form | |
      1. 9.2.1 Solid and Paste | |
      2. 9.2.2 Liquid |
    3. 9.3 By Category | |
      1. 9.3.1 Conventional | |
      2. 9.3.2 Organic |
    4. 9.4 By End-User | |
      1. 9.4.1 Food Processing Industry | |
      2. 9.4.2 Foodservice | |
      3. 9.4.3 Retail
  10. 10 Competitive Landscape |
    1. 10.1 Market Concentration Analysis (2026) |
    2. 10.2 Competitive Benchmarking Matrix |
    3. 10.3 Company Profiles
  11. 11 Recent News & Developments
  12. 12 Report Scope and Methodology
  13. 13 Detailed Sources and Citations
  14. 14 Frequently Asked Questions
  15. 15 LIST OF TABLES
  16. 16 LIST OF FIGURES
Share::
Request Free Sample

Segmentation Quick Reference

DimensionSub-SegmentsDominant SegmentFastest Growing Segment
By Ingredient TypeButter, Tallow, Lard, Liquid Gold, OthersButterLard
By FormSolid and Paste, LiquidSolid and PasteLiquid
By CategoryConventional, OrganicConventionalOrganic
By End-UserFood Processing Industry, Foodservice, RetailFood Processing IndustryRetail
By GeographyNorth America, Europe, Asia-Pacific, South America, Middle East and AfricaAsia-PacificAsia-Pacific


Market Segmentation Overview

By Ingredient Type

Sub-SegmentKey Trend
ButterClean-label reformulation restores butterfat in premium bakery and confectionery.
TallowFrying reversion in quick-service channels collides with renewable fuel bidding.
LardAsian processed meat output and Latin American baking rebuild sustain volume growth.
Liquid GoldBulk industrial frying buyers favour consistent, tank-delivered supply.
OthersPoultry and duck fats find niches in premium foodservice and ethnic cuisine.


Ingredient mix is where pricing power actually sits. Butter carries the highest value density and the weakest substitution risk, while tallow remains the most exposed to outside-sector demand shocks.

By Form

Sub-SegmentKey Trend
Solid and PastePlastic fat behaviour remains essential for lamination and coating applications.
LiquidTanker logistics and fractionated olein availability accelerate industrial adoption


Form preference follows application physics more than buyer preference. Growth tilts liquid because logistics savings compound at scale.

By Category

Sub-SegmentKey Trend
ConventionalCost-led industrial procurement anchors the volume base through 2035
OrganicCertified herd availability, not demand, limits expansion pace


Category dynamics reward suppliers who contract certified supply early. Premium spreads have held steady even as conventional prices fluctuated.

By End-User

Sub-SegmentKey Trend
Food Processing IndustryBakery, confectionery and processed meat manufacturing dominate tonnage
FoodserviceRestaurant frying media conversions drive incremental regional demand.
RetailHome cooking revival and specialty grocery lift high-margin pack formats.


End-user concentration is extreme, with industrial processors absorbing the large majority of supply. Retail matters disproportionately for sentiment and margin rather than volume.

By Geography

Sub-SegmentKey Trend
North AmericaFood-versus-fuel allocation defines availability and pricing volatility
EuropeRegulatory compliance and organic certification concentrate volume among larger operators
Asia-PacificCold-chain investment and processed food output drive the fastest regional expansion.
South AmericaIntegrated slaughter-rendering operations support export-oriented growth.
Middle East and AfricaHalal segregation requirements and greenfield capacity define the opportunity set.


Geographic divergence is widening rather than converging. Asia-Pacific's lead grows because its demand base never absorbed the dietary displacement that reshaped Western consumption.




Share::
Request Free Sample
Download PDF ×

We do not share your information with anyone. However, we may send you emails based on your report interest from time to time. You may contact us at any time to opt-out.