Segmentation Quick Reference
| Dimension | Sub-Segments | Dominant Segment | Fastest Growing Segment |
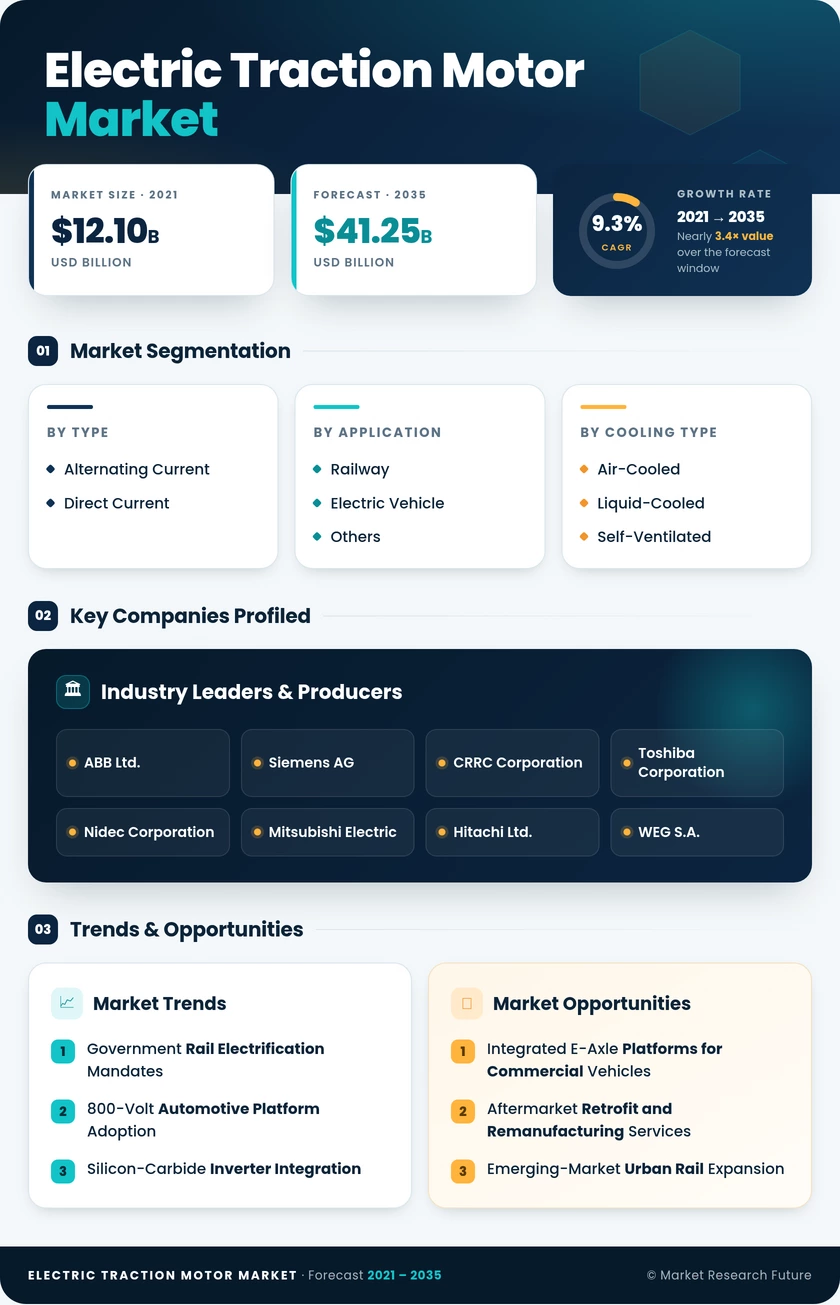
| By Type | Alternating Current, Direct Current | Alternating Current (61% share, 2025) | Direct Current (10.8% CAGR) |
| By Application | Electric Traction Motor Market, Electric Vehicle, Others | Electric Traction Motor Market (43% share, 2025) | Electric Vehicle (17.0% CAGR) |
| By Cooling Type | Air-Cooled, Liquid-Cooled, Self-Ventilated | Air-Cooled (55% share, 2025) | Liquid-Cooled (12.1% CAGR) |
| By Power Rating | Below 200 kW, 200 to 400 kW, Above 400 kW | Below 200 kW (51% share, 2025) | 200 to 400 kW (11.2% CAGR) |
| By Voltage Class | Below 1 kV, 1 to 3 kV, Above 3 kV | 1 to 3 kV (47% share, 2025) | Below 1 kV (11.3% CAGR) |
Market Segmentation Overview
By Type
| Sub-Segment | Key Trend |
| Alternating Current | Dominates rail and automotive traction; shift toward interior permanent magnet synchronous configurations for higher efficiency |
| Direct Current | Declining share in new installations; sustained demand from legacy metro fleet compatibility and mining equipment |
The alternating-current segment holds a commanding share of global traction motor revenue, driven by universal adoption across high-speed rail and battery electric vehicle platforms. Direct-current motors retain a niche in systems where backward compatibility and simple control architectures outweigh efficiency trade-offs.
By Application
| Sub-Segment | Key Trend |
| Electric Traction Motor Market | Stable, policy-driven demand anchored in multi-year procurement cycles across Asia, Europe, and North America |
| Electric Vehicle | Fastest-growing segment as global BEV production scales toward 30+ million units annually by 2030 |
| Others | Includes marine propulsion, mining haul trucks, and industrial traction — steady growth from electrification mandates |
Electric Traction Motor Market remains the backbone application, but electric vehicle traction is rapidly closing the gap in absolute revenue terms as unit volumes accelerate globally.
By Cooling Type
| Sub-Segment | Key Trend |
| Air-Cooled | Preferred for sub-200 kW applications where weight and cost sensitivity outweigh thermal performance needs |
| Liquid-Cooled | Gaining share in high-power automotive and locomotive platforms requiring sustained output without derating |
| Self-Ventilated | Used in auxiliary and industrial traction drives where motor speeds generate sufficient airflow for cooling |
Liquid-cooled systems are the growth frontier as power ratings climb above 300 kW across both rail and automotive platforms.
By Power Rating
| Sub-Segment | Key Trend |
| Below 200 kW | Largest share driven by passenger BEV and light metro applications |
| 200 to 400 kW | Fastest-growing band, serving high-speed EMUs, commercial trucks, and premium EVs |
| Above 400 kW | Anchored in freight locomotive and heavy industrial demand; thermal management remains a design constraint |
The 200 to 400 kW band benefits from concurrent demand growth in high-speed rail and heavy-duty commercial vehicle electrification.
By Voltage Class
| Sub-Segment | Key Trend |
| Below 1 kV | Driven by automotive traction at 400 V and 800 V bus levels; highest unit volume growth |
| 1 to 3 kV | Dominant in urban and commuter rail networks operating on 1.5 kV and 3 kV DC catenary systems |
| Above 3 kV | Serves mainline 25 kV AC rail corridors; stable demand tied to intercity and freight operations |
The below-1 kV class is growing fastest due to the automotive electrification wave, while the 1 to 3 kV band maintains the largest absolute revenue share through its alignment with global metro infrastructure.