Download Free Sample
Kindly complete the form below to receive a free sample of this Report
Electric Vehicle Charging Infrastructure MRO Services Market Size, Share and Trends Analysis Research Report Information By End Use (Residential Users, Commercial Users, Government Entities, Fleet Operators), By Application (Public Charging Stations, Private Charging Stations, Fleet Charging Solutions, Workplace Charging Solutions), By Service Type (Maintenance, Repair, Installation, Consultation), By Charging Technology (Level 1, Level 2, DC Fast Charging, Wireless Charging), And By Region – Market Forecast Till 2035.
As per MRFR analysis, the Electric Vehicle Charging Infrastructure MRO Services Market was estimated at 12.5 USD Billion in 2024. The market is projected to grow from 14.28 USD Billion in 2025 to 54.0 USD Billion by 2035, exhibiting a compound annual growth rate (CAGR) of 14.23% during the forecast period 2025 - 2035.
The Electric Vehicle Charging Infrastructure MRO Services Market is poised for substantial growth driven by technological advancements and regulatory support.
| 2024 Market Size | 12.5 (USD Billion) |
| 2035 Market Size | 54.0 (USD Billion) |
| CAGR (2025 - 2035) | 14.23% |
ChargePoint (US), Blink Charging (US), EVBox (NL), Shell Recharge Solutions (GB), Siemens (DE), ABB (CH), Electrify America (US), Greenlots (US), IONITY (DE)
Our Impact
Enabled $4.3B Revenue Impact for Fortune 500 and Leading Multinationals
Partnering with 2000+ Global Organizations Each Year
30K+ Citations by Top-Tier Firms in the Industry
The Electric Vehicle Charging Infrastructure MRO Services Market is currently experiencing a transformative phase, driven by the increasing adoption of electric vehicles and the corresponding need for robust maintenance, repair, and operations services. As the global focus shifts towards sustainable transportation, the demand for efficient charging infrastructure has surged. This market appears to be characterized by a diverse range of service providers, including specialized firms and traditional automotive service companies, all vying to establish a foothold in this burgeoning sector. The integration of advanced technologies, such as IoT and AI, into maintenance practices is likely enhancing operational efficiency and service delivery, thereby attracting more stakeholders. Moreover, the Electric Vehicle Charging Infrastructure MRO Services Market seems to be influenced by regulatory frameworks and government incentives aimed at promoting electric vehicle usage. These initiatives may encourage investments in charging infrastructure, further propelling the need for MRO services. As the market evolves, collaboration between manufacturers, service providers, and technology firms could emerge as a pivotal strategy to address the complexities of maintaining a widespread charging network. The interplay of these factors suggests a dynamic landscape, where adaptability and innovation will be crucial for success in the coming years.
The incorporation of advanced technologies into MRO services is becoming increasingly prevalent. Innovations such as IoT and AI are streamlining maintenance processes, enhancing predictive capabilities, and improving overall service efficiency. This trend indicates a shift towards more data-driven approaches in managing charging infrastructure.
Government policies and incentives are playing a crucial role in shaping the Electric Vehicle Charging Infrastructure MRO Services Market. Regulatory frameworks aimed at promoting electric vehicle adoption are likely to stimulate investments in charging infrastructure, thereby increasing the demand for MRO services.
The formation of partnerships among manufacturers, service providers, and technology firms appears to be a growing trend. Such collaborations may facilitate knowledge sharing and resource optimization, ultimately leading to more effective maintenance solutions and a more resilient charging network.
The increasing adoption of electric vehicles (EVs) is a primary driver for the Electric Vehicle Charging Infrastructure MRO Services Market. As consumers and businesses transition to EVs, the demand for reliable charging infrastructure intensifies. In 2025, it is estimated that the number of electric vehicles on the road will surpass 30 million, necessitating a robust network of charging stations. This surge in EV adoption compels service providers to enhance maintenance, repair, and operational services to ensure the reliability and efficiency of charging stations. Consequently, the Electric Vehicle Charging Infrastructure MRO Services Market is poised for growth as stakeholders seek to meet the evolving needs of EV users.
Government incentives and policies play a crucial role in shaping the Electric Vehicle Charging Infrastructure MRO Services Market. Various governments are implementing favorable regulations and financial incentives to promote the installation of EV charging stations. For instance, tax credits, grants, and subsidies are being offered to businesses and municipalities to encourage the development of charging infrastructure. In 2025, it is projected that these initiatives will lead to a 25% increase in the number of public charging stations, thereby driving demand for MRO services. This supportive regulatory environment not only fosters investment in charging infrastructure but also enhances the overall sustainability of the Electric Vehicle Charging Infrastructure MRO Services Market.
Consumer demand for sustainable solutions is increasingly driving the Electric Vehicle Charging Infrastructure MRO Services Market. As awareness of environmental issues grows, consumers are actively seeking eco-friendly transportation options, including electric vehicles. This shift in consumer behavior is prompting businesses to invest in sustainable charging solutions, which in turn drives the need for MRO services to maintain these systems. In 2025, it is anticipated that the demand for green charging solutions will rise by 30%, further propelling the Electric Vehicle Charging Infrastructure MRO Services Market. Service providers must adapt to this trend by offering environmentally responsible maintenance and repair services that align with consumer expectations.
The surge in investment in charging infrastructure is a significant driver for the Electric Vehicle Charging Infrastructure MRO Services Market. Private and public sectors are recognizing the importance of a comprehensive charging network to support the growing EV market. In 2025, investments in charging infrastructure are projected to exceed $10 billion, reflecting a commitment to expanding the availability of charging stations. This influx of capital not only facilitates the installation of new charging points but also emphasizes the need for ongoing maintenance and operational services. Consequently, the Electric Vehicle Charging Infrastructure MRO Services Market is likely to experience robust growth as stakeholders seek to ensure the longevity and reliability of their charging assets.
Technological advancements in charging solutions are significantly influencing the Electric Vehicle Charging Infrastructure MRO Services Market. Innovations such as fast charging, wireless charging, and smart grid integration are enhancing the efficiency and convenience of EV charging. In 2025, the market for fast charging stations is expected to grow by 40%, driven by consumer demand for quicker charging options. These advancements necessitate specialized maintenance and repair services to ensure optimal performance and safety. As a result, the Electric Vehicle Charging Infrastructure MRO Services Market must adapt to these technological changes, providing tailored services that align with the latest charging technologies.
In the Electric Vehicle Charging Infrastructure MRO Services Market, the application segment reveals diverse opportunities. Public Charging Stations dominate the market, accounting for a significant share as they cater to a wide consumer base. Driven by the rising popularity of electric vehicles, these stations are increasingly becoming essential for urban areas, presenting a fertile ground for service providers. Private Charging Stations, although smaller in share currently, are recognized for their rapid adoption among homeowners and businesses eager to install their own charging solutions, reflecting an upward trend fueled by convenience and energy efficiency concerns. The growth trends in this segment indicate strong momentum for both public and private charging stations. The rising number of electric vehicles on the road plays a pivotal role in increasing demand for charging infrastructure. Enhanced government incentives and policies supporting green energy are also driving the installation of charging stations. Furthermore, the expansion of fleet charging solutions is gaining traction in both workplace and private settings, representing an emerging sector within the market fueled by corporate sustainability goals and the push for cleaner transportation alternatives.
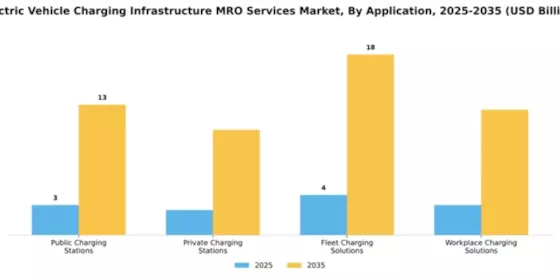
Public Charging Stations (Dominant) vs. Fleet Charging Solutions (Emerging)
Public Charging Stations are pivotal in the Electric Vehicle Charging Infrastructure MRO Services Market, showcasing a robust presence driven by growing public demand. These stations are strategically located in urban centers, offering accessibility for EV users who require convenient charging options during daily commutes. They serve as a critical touchpoint for potential electric vehicle owners, reinforcing their importance in promoting EV adoption. Conversely, Fleet Charging Solutions emerge as a growing segment, focusing on businesses with dedicated electric vehicle fleets. These solutions are tailored to meet the specific charging needs of companies, optimizing operations and reducing downtime. With increasing corporate focus on sustainability and reducing carbon footprints, fleet solutions are witnessing accelerated growth, underscoring their value in the evolving landscape of electric mobility.
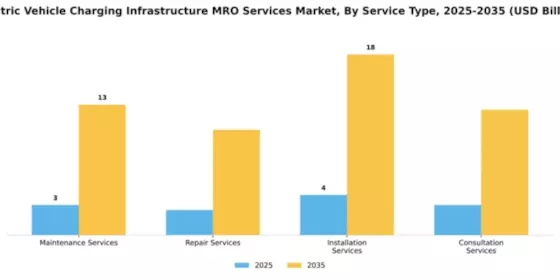
The Electric Vehicle Charging Infrastructure MRO Services Market sees a diverse distribution of service types, with Maintenance Services holding the largest market share due to their essential role in ensuring the operational reliability of charging stations. Following closely, Installation Services are also significant, particularly as the demand for new charging infrastructure accelerates, driven by increased electric vehicle adoption and supportive government policies aimed at expanding charging networks.
In contrast, Repair Services and Consultation Services are valuable components of the market, though they hold a smaller share compared to Maintenance and Installation. The critical driver for growth in the Electric Vehicle Charging Infrastructure MRO Services Market stems from the global shift towards green energy and sustainability. Additionally, technological advancements in charging solutions and the increasing number of electric vehicles on the road further fuel these service demands.
Maintenance Services (Dominant) vs. Repair Services (Emerging)
Maintenance Services are recognized as the dominant force within the Electric Vehicle Charging Infrastructure MRO segment, providing routine services essential for the longevity and efficiency of charging stations. They play a pivotal role in minimizing downtime and operational costs, thereby ensuring a seamless user experience. On the other hand, Repair Services, while currently considered emerging, are gaining traction as the infrastructures age and the frequency of service breakdowns increases. The growing emphasis on reliable charging solutions has made these repair services more crucial. Both segments can coexist, with Maintenance ensuring optimal performance, while Repair Services address unexpected breakdowns, contributing to the overall stability of the EV charging ecosystem.
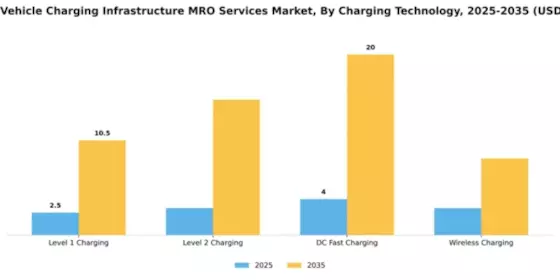
In the Electric Vehicle Charging Infrastructure MRO Services Market, the segment distribution reveals that DC Fast Charging holds the largest market share, primarily attributed to its rapid charging capability that caters to the growing demand for quick charging solutions. Level 2 Charging, while holding a significant share, has gained momentum as more consumers transition to electric vehicles, making it a strong competitor in the charging technology landscape.
Charging Technology: DC Fast Charging (Dominant) vs. Level 2 Charging (Emerging)
DC Fast Charging technology plays a pivotal role in the electric vehicle ecosystem due to its ability to deliver high-power outputs, enabling EVs to recharge in a matter of minutes. This technology is favored for commercial and high-traffic locations, ensuring minimal downtime for drivers. Conversely, Level 2 Charging is emerging rapidly, especially among residential users who seek a balance between charge time and installation costs. It usually utilizes standard household outlets and is increasingly being recognized for its efficiency in daily commuting needs, thus contributing significantly to the growth of the market.
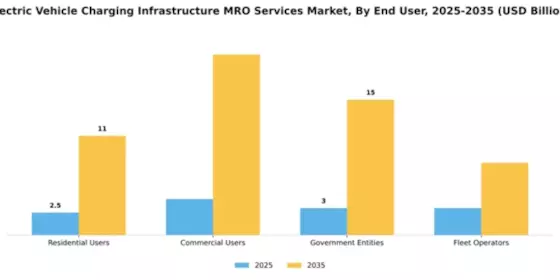
In the Electric Vehicle Charging Infrastructure MRO Services Market, the distribution of market share among end-user segments reveals that residential users currently hold the largest share. This segment benefits from the increasing adoption of electric vehicles (EVs) in households, driven by government incentives and a growing commitment to sustainability. Conversely, fleet operators are emerging as the fastest-growing segment due to the rising electrification of commercial fleets, seeking efficiency and lower operational costs.
The growth trends in this market segment are being fueled by various factors. Residential users are witnessing a steady rise as more homeowners invest in EVs and home charging solutions. Meanwhile, fleet operators are dramatically increasing their investments in charging infrastructure to support electrified fleets, driven by sustainability goals and regulatory pressures. Additionally, government entities are initiating programs to enhance public charging networks, thus bolstering both residential and fleet segments.
Residential Users (Dominant) vs. Government Entities (Emerging)
Residential users represent a dominant force in the Electric Vehicle Charging Infrastructure MRO Services Market, characterized by a strong demand for personalized home charging solutions that offer convenience and efficiency. This segment has been gaining traction due to increasing electric vehicle ownership among homeowners, fueled by incentives and a shift toward greener alternatives. On the other hand, government entities are emerging as a vital segment, tasked with implementing public charging infrastructure. This segment is gaining momentum through investment in EV charging networks aimed at reducing emissions and supporting national sustainability goals. The growth of both segments is crucial as they shape the landscape of EV charging services, with residential users leading the charge and government entities reinforcing infrastructure support.
Get more detailed insights about Electric Vehicle Charging Infrastructure MRO Services Market Request Free Sample
North America is poised to maintain its leadership in the Electric Vehicle Charging Infrastructure MRO Services Market, holding a market size of $5.0 billion as of December 2025. The growth is driven by increasing EV adoption, supportive government policies, and significant investments in charging infrastructure. Regulatory incentives and environmental initiatives are further propelling demand, making it a vibrant market for MRO services. The competitive landscape is characterized by key players such as ChargePoint, Blink Charging, and Electrify America, which are actively expanding their service offerings. The U.S. leads the charge, with states like California implementing aggressive EV targets and infrastructure development plans. This robust ecosystem fosters innovation and collaboration among stakeholders, ensuring a sustainable growth trajectory for the region.
Europe is rapidly evolving into a significant player in the Electric Vehicle Charging Infrastructure MRO Services Market, with a market size of $3.5 billion projected for December 2025. The region benefits from stringent environmental regulations and ambitious targets for carbon neutrality, driving demand for EV charging solutions. Government initiatives, such as the European Green Deal, are catalyzing investments in charging infrastructure, enhancing market growth. Leading countries like Germany, the Netherlands, and the UK are at the forefront of this transformation, hosting key players such as EVBox and Shell Recharge Solutions. The competitive landscape is marked by collaborations between public and private sectors, ensuring a comprehensive charging network. As Europe continues to innovate and expand its infrastructure, it solidifies its position as a hub for EV charging services.
Asia-Pacific is witnessing a significant surge in the Electric Vehicle Charging Infrastructure MRO Services Market, with a projected market size of $3.0 billion by December 2025. The region's growth is fueled by increasing urbanization, rising disposable incomes, and government initiatives promoting electric mobility. Countries like China and Japan are leading the charge, implementing policies to enhance EV adoption and charging infrastructure development. China stands out as a dominant player, with extensive investments in charging networks and a robust manufacturing base for EVs. The competitive landscape includes major players like ABB and IONITY, which are expanding their presence in the region. As the demand for EVs continues to rise, the MRO services market is expected to flourish, driven by the need for reliable and efficient charging solutions.
The Middle East and Africa are emerging as a potential market for Electric Vehicle Charging Infrastructure MRO Services, with a market size of $1.0 billion anticipated by December 2025. The region is beginning to embrace electric mobility, driven by government initiatives aimed at reducing carbon emissions and diversifying energy sources. Countries like South Africa and the UAE are taking steps to develop EV infrastructure, creating a conducive environment for MRO services. The competitive landscape is still in its infancy, with local and international players exploring opportunities. As awareness of electric vehicles grows, investments in charging infrastructure are expected to increase, paving the way for a more robust market. The region's unique challenges, such as varying levels of infrastructure development, present both opportunities and hurdles for market players.
The Electric Vehicle Charging Infrastructure MRO Services Market is currently characterized by a dynamic competitive landscape, driven by the increasing adoption of electric vehicles (EVs) and the corresponding demand for robust charging solutions. Key players such as ChargePoint (US), Blink Charging (US), and ABB (CH) are strategically positioning themselves through innovation and partnerships. ChargePoint (US) focuses on expanding its network of charging stations, while Blink Charging (US) emphasizes enhancing user experience through advanced technology. ABB (CH) is leveraging its expertise in automation and electrification to provide comprehensive solutions, thereby shaping a competitive environment that prioritizes technological advancement and customer-centric services.In terms of business tactics, companies are increasingly localizing manufacturing and optimizing supply chains to enhance operational efficiency. The market appears moderately fragmented, with several players vying for market share. This fragmentation allows for diverse strategies, as companies like Siemens (DE) and Shell Recharge Solutions (GB) adopt different approaches to capture regional markets. The collective influence of these key players fosters a competitive structure that encourages innovation and responsiveness to market demands.
In November ChargePoint (US) announced a partnership with a major automotive manufacturer to integrate its charging solutions into new EV models. This strategic move is likely to enhance ChargePoint's visibility and accessibility, positioning it favorably in the market as consumers increasingly seek seamless charging experiences. The collaboration underscores the importance of partnerships in expanding market reach and enhancing service offerings.
In October Blink Charging (US) launched a new line of fast-charging stations designed for urban environments. This initiative reflects Blink's commitment to addressing the growing need for efficient charging solutions in densely populated areas. By focusing on urban infrastructure, Blink Charging (US) aims to capture a significant share of the market, catering to the evolving needs of urban EV users.
In September ABB (CH) unveiled a new AI-driven platform for managing charging infrastructure, which optimizes energy consumption and enhances operational efficiency. This technological advancement not only positions ABB as a leader in innovation but also aligns with the broader trend of digital transformation within the industry. The integration of AI into charging solutions is indicative of a shift towards smarter, more sustainable infrastructure.
As of December current competitive trends are heavily influenced by digitalization, sustainability, and the integration of AI technologies. Strategic alliances are increasingly shaping the landscape, as companies recognize the value of collaboration in driving innovation. The competitive differentiation is likely to evolve from traditional price-based competition to a focus on technological innovation, supply chain reliability, and enhanced customer experiences. This shift suggests that companies that prioritize these aspects will be better positioned to thrive in the rapidly evolving Electric Vehicle Charging Infrastructure MRO Services Market.



The Electric Vehicle Charging Infrastructure MRO Services Market is projected to grow at a 14.23% CAGR from 2025 to 2035, driven by increasing EV adoption, technological advancements, and supportive government policies.
New opportunities lie in:
By 2035, the market is expected to be robust, driven by innovation and strategic partnerships.
| MARKET SIZE 2024 | 12.5(USD Billion) |
| MARKET SIZE 2025 | 14.28(USD Billion) |
| MARKET SIZE 2035 | 54.0(USD Billion) |
| COMPOUND ANNUAL GROWTH RATE (CAGR) | 14.23% (2025 - 2035) |
| REPORT COVERAGE | Revenue Forecast, Competitive Landscape, Growth Factors, and Trends |
| BASE YEAR | 2024 |
| Market Forecast Period | 2025 - 2035 |
| Historical Data | 2019 - 2024 |
| Market Forecast Units | USD Billion |
| Key Companies Profiled | ChargePoint (US), Blink Charging (US), EVBox (NL), Shell Recharge Solutions (GB), Siemens (DE), ABB (CH), Electrify America (US), Greenlots (US), IONITY (DE) |
| Segments Covered | Application, Service Type, Charging Technology, End User |
| Key Market Opportunities | Integration of advanced monitoring systems enhances efficiency in Electric Vehicle Charging Infrastructure MRO Services Market. |
| Key Market Dynamics | Rising demand for Electric Vehicle Charging Infrastructure MRO Services driven by technological advancements and regulatory support. |
| Countries Covered | North America, Europe, APAC, South America, MEA |
The market valuation reached 12.5 USD Billion in 2024.
The market is expected to grow to 54.0 USD Billion by 2035.
The market is projected to experience a CAGR of 14.23% from 2025 to 2035.
Key players include ChargePoint, Blink Charging, EVBox, Shell Recharge Solutions, Siemens, ABB, Electrify America, Greenlots, and IONITY.
The market segments include applications, service types, charging technologies, and end users.
The market for Public Charging Stations is expected to increase from 3.0 USD Billion to 13.0 USD Billion by 2035.
Installation Services are anticipated to grow from 4.0 USD Billion to 18.0 USD Billion by 2035.
The market for DC Fast Charging technology is projected to expand from 4.0 USD Billion to 20.0 USD Billion by 2035.
The Commercial Users segment is likely to grow from 4.0 USD Billion to 20.0 USD Billion by 2035.
Maintenance Services are expected to rise from 3.0 USD Billion to 13.0 USD Billion by 2035.



Kindly complete the form below to receive a free sample of this Report

“This is really good guys. Excellent work on a tight deadline. I will continue to use you going forward and recommend you to others. Nice job”


“Thanks. It’s been a pleasure working with you, please use me as reference with any other Intel employees.”


“Thanks for sending the report it gives us a good global view of the Betaïne market.”


“Thank you, this will be very helpful for OQS.”


“We found the report very insightful! we found your research firm very helpful. I'm sending this email to secure our future business.”


“I am very pleased with how market segments have been defined in a relevant way for my purposes (such as "Portable Freezers & refrigerators" and "last-mile"). In general the report is well structured. Thanks very much for your efforts.”


“I have been reading the first document or the study, ,the Global HVAC and FP market report 2021 till 2026. Must say, good info! I have not gone in depth at all parts, but got a good indication of the data inside!”


“We got the report in time, we really thank you for your support in this process. I also thank to all of your team as they did a great job.”


“The Automotive 48V ECU Components Procurement Intelligence Study” was a complex project, but the Market Research Future (MRFR) team handled it with quality, agility, and customer-centricity. They delivered all requested data on time and within the agreed scope. The team, including Shubhendra Anand and Rahul Gotadki, was always readily available to clarify questions and swiftly implement necessary adjustments, driving the project to a successful conclusion within a very demanding timeframe.
I would also like to specifically commend Akshay Agarwal for his responsiveness and support at every stage—from our initial inquiry on May 6th through to final delivery on June 18th. His dedication made the entire process seamless.”



