EV Power Inverter Market (2026 - 2035)

Electric Vehicle Power Inverter Market Research Report By Power Level (Low Power (up to 100kW), Medium Power (100kW - 250kW), High Power (250kW and above)), By Cooling System (Liquid Cooled, Air Cooled), By Output Voltage (Low Voltage (less than 400V), Medium Voltage (400V - 1000V), High Voltage (1000V and above)), By Application (Passenger Vehicles, Commercial Vehicles, Industrial Vehicles) and By Regional (North America, Europe, South America, Asia Pacific, Middle East and Africa) - Forecast to 2035
ID: MRFR/AT/23762-HCR
128 Pages
Shubham Munde
Last Updated: June 22, 2026
EV Power Inverter Market
Market Size
Forecast Period2026-2035
CAGR (2026-2035)17.4%
2026 Market SizeUSD 11.34 Billion
2035 Market SizeUSD 48.04 Billion
Key Players
Infineon Technologies
BorgWarner
STMicroelectronics
Denso Corporation
Continental AG
Vitesco Technologies
Opportunities
  • Fuel-Cell Inverter Platforms for Heavy Transport
  • Emerging-Market Electrification Programs
  • Digital-Twin-Enabled Inverter Optimization

Electric Vehicle Power Inverter Market Summary

The electric vehicle power inverter market reached USD 9.53 billion in 2025 and is projected to grow from USD 11.34 billion in 2026 to USD 48.04 billion by 2035, registering a CAGR of 17.4% across the forecast period. This expansion is anchored to two catalysts that have moved from policy debate to concrete spending: the European Union's 2035 ban on new internal-combustion passenger vehicles and China's dual-credit policy, which now penalizes automakers whose new-energy vehicle mix falls below 28% of annual production. Together, these mandates guarantee baseline demand for power electronics in every major auto-producing economy [1][2].

The technology story driving the electric vehicle power inverter market centers on a generational shift in semiconductor architecture. Silicon insulated-gate bipolar transistors, the workhorse of early EV inverters, are steadily ceding ground to wide-bandgap devices that cut switching losses by up to 50% and enable higher-frequency operation in compact housings. Wolfspeed's USD 5 billion Mohawk Valley fab and Infineon's planned EUR 5 billion expansion in Dresden reflect the capital being committed to this transition [3][4].

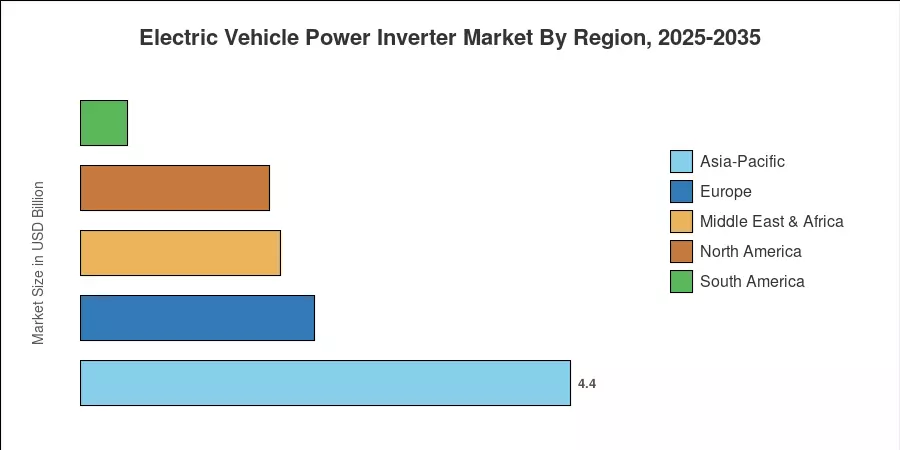
Asia-Pacific commands roughly 46% of the electric vehicle power inverter market, led by China's unmatched battery-electric production volumes and Japan's dominance in power-module packaging. North America holds an estimated 24% share, buoyed by the Inflation Reduction Act incentives for domestically manufactured drivetrain components. Europe, at about 22%, remains the regulatory pace-setter, and its Fit-for-55 framework keeps OEM procurement cycles tilted toward next-generation inverters through the decade's end [5][6].

ย 

Key Report Takeaways

โ€ข By Propulsion Type

  • Battery-electric vehicles accounted for approximately 57.9% of the electric vehicle power inverter market in 2025, reflecting their dominance across passenger and light-commercial platforms.
  • Fuel-cell electric vehicles are forecast to post the fastest CAGR of 20.9% through 2035, driven by heavy-truck hydrogen programs in Europe and South Korea.

โ€ข By Vehicle Type

  • Passenger cars led the electric vehicle power inverter market with a 67.7% share in 2025, as consumer BEV adoption outpaces commercial segments.
  • Heavy commercial vehicles and buses are projected to register a 20.8% CAGR to 2035, supported by urban zero-emission zones.

โ€ข By Region

  • Asia-Pacific generated the largest revenue share in the electric vehicle power inverter market, underpinned by Chinese OEM scale and Japanese supplier technology.
  • North America's electric vehicle power inverter market is expanding at a 17.8% CAGR, with IRA-linked domestic manufacturing incentives accelerating capacity build-outs.

ย 

Market Size and Forecast (2021โ€“2035)

Market Research Future's sizing methodology triangulates top-down policy-driven demand models with bottom-up OEM production forecasts and Tier-1 supplier revenue disclosures. Historical data are calibrated against public filings, while forecast-period figures reflect announced capacity expansions, regulatory phase-in schedules, and semiconductor supply roadmaps.
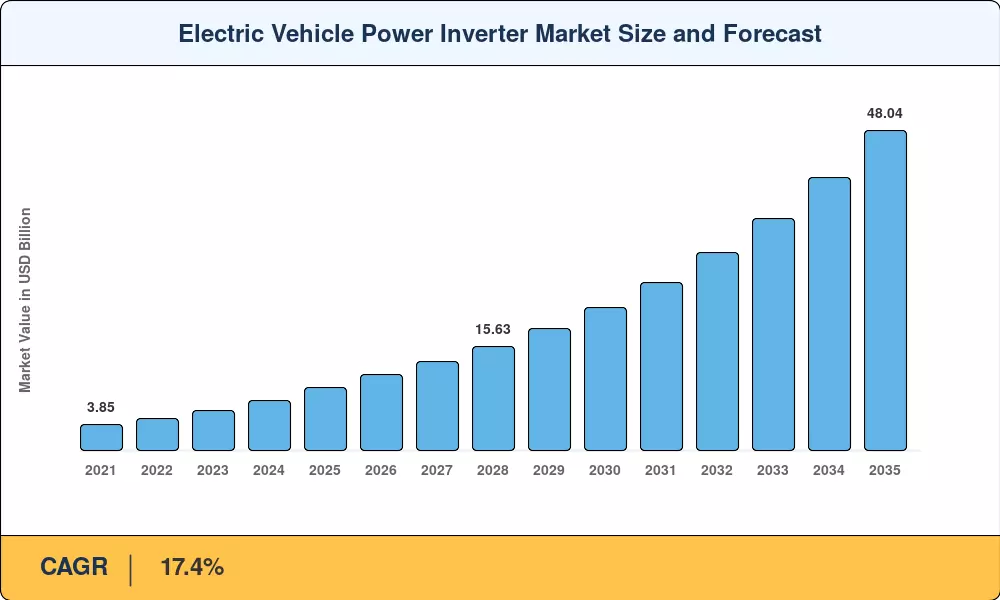
Electric Vehicle Power Inverter Market Size and Forecast
Our Impact
Enabled $4.3B Revenue Impact for Fortune 500 and Leading Multinationals
Partnering with 2000+ Global Organizations Each Year
30K+ Citations by Top-Tier Firms in the Industry

Driver Impact Analysis

Driver ~% Impact on CAGR Geographic Relevance Impact Timeline
Zero-emission vehicle mandates ~25% Global Short-term
800 V architecture adoption ~20% Europe, China Medium-term
SiC semiconductor capacity expansion ~18% US, Germany, Japan Medium-term
Integrated e-Axle consolidation ~12% Global Medium-term
Commercial fleet electrification ~10% Europe, North America Long-term
Battery cost deflation ~8% Global Long-term
Autonomous driving power demands ~7% US, China Long-term

ย 

Zero-Emission Vehicle Mandates

Government regulation remains the single most powerful tailwind for the electric vehicle power inverter market. The EU's Regulation 2023/851 locks in a 100% COโ‚‚ reduction target for new passenger cars by 2035, while California's Advanced Clean Cars II rule requires 100% zero-emission new-car sales by the same date โ€” a standard now adopted by fourteen additional US states representing over 40% of domestic auto sales [1][2]. China's Stage VI emission standards and dual-credit policy complement these Western mandates, ensuring that every high-volume auto market penalizes ICE powertrains in ways that directly lift inverter demand.

800-Volt Architecture Transition

The shift from 400 V to 800 V electrical platforms cuts charging time roughly in half and allows thinner, lighter cable harnesses โ€” savings that automakers value at USD 200โ€“400 per vehicle [3]. Hyundai's E-GMP, Porsche's PPE, and GM's Ultium platforms have already standardized on 800 V, and by 2028, an estimated 35% of new BEV platforms globally will operate at 800 V or above. This architecture demands redesigned inverter topologies with higher blocking voltages, creating an upgrade cycle across the Tier-1 supplier base.

Silicon-Carbide Semiconductor Expansion

Wide-bandgap device capacity is the gating factor for inverter performance gains. Wolfspeed's 200 mm Mohawk Valley fab, Infineon's EUR 5 billion Kulim and Dresden expansions, and STMicroelectronics' Catania ramp collectively aim to triple global SiC wafer output by 2028 [4][11]. Each percentage-point improvement in inverter efficiency translates to 5โ€“8 km of additional range for a 75 kWh battery pack, making SiC adoption a competitive necessity rather than a premium option.

Integrated E-Axle Consolidation

Tier-1 suppliers including BorgWarner, Vitesco Technologies, and Nidec are packaging the motor, inverter, and single-speed gearbox into a unified e-Axle housing. This integration reduces mass by 10โ€“15%, lowers system cost by roughly USD 150 per unit, and simplifies OEM assembly line logistics [7]. The electric vehicle power inverter market stands to benefit as e-Axle adoption drives higher inverter content value per vehicle, even as unit prices decline through scale.

ย 

Restraints Impact Analysis

The restraint impact estimates below are directional and may interact with drivers or with each other in ways that modify net effects on market growth.

Restraint ~% Impact on CAGR Geographic Relevance Impact Timeline
SiC wafer supply bottlenecks ~-3.0% Global Short-term
Thermal management complexity ~-2.5% Global Medium-term
Legacy IGBT overcapacity ~-2.0% China, India Short-term
Grid infrastructure deficits ~-1.5% Emerging markets Long-term
Semiconductor export controls ~-1.0% US-China corridor Medium-term

ย 

SiC Wafer Supply Constraints

Despite aggressive fab investments, the global SiC substrate market faces a structural deficit through at least 2027. Defect densities on 200 mm wafers remain higher than the sub-0.5/cmยฒ target needed for automotive-grade yields, and lead times for epitaxial reactor equipment stretch beyond 18 months [12]. This bottleneck constrains the pace at which OEMs can migrate from silicon IGBT to SiC-based inverters, temporarily capping growth in the premium segment of the electric vehicle power inverter market.

Thermal Management Complexity

Higher switching frequencies and power densities in next-generation inverters amplify heat-flux challenges. Junction temperatures in SiC devices can exceed 200 ยฐC under peak load, demanding advanced cooling solutions โ€” double-sided direct-bond copper, jet-impingement cooling, or phase-change materials โ€” that add USD 30โ€“60 per module [13]. Automakers targeting cost parity with ICE drivetrains find this thermal penalty difficult to absorb, slowing adoption in price-sensitive vehicle segments.

Legacy IGBT Overcapacity

Chinese module makers ramped silicon IGBT capacity aggressively between 2020 and 2023, creating an estimated 15โ€“20% oversupply in the sub-200 kW inverter segment [14]. Excess inventory depresses average selling prices and delays the economic case for switching to wide-bandgap devices in the electric vehicle power inverter market, particularly for entry-level BEVs priced below USD 25,000.

ย 

Electric Vehicle Power Inverter Market Opportunities

Fuel-Cell Inverter Platforms for Heavy Transport

Hydrogen fuel-cell vehicles require inverter designs specifically tailored to cope with transient fuel-cell stack voltages and regeneration loads that are different from battery-electric drivetrains. The EUโ€™s Alternative Fuels Infrastructure Regulation sets a goal of over 700 hydrogen refueling stations by 2030, which creates a corridor for dedicated FCEV inverter platforms[8].

ย 

Emerging-Market Electrification Programs

Indiaโ€™s FAME III subsidy scheme has earmarked INR 10,000 crore for electric two- and three-wheelers, many of which depend on compact, cost-optimized inverters in the 10โ€“50 kW range. Southeast Asian countries โ€“ Thailand, Indonesia, Vietnam โ€“ are mirroring similar incentive systems, establishing a new volume tier in the electric car power inverter market, favoring domestically built modules[17].

ย 

Digital-Twin-Enabled Inverter Optimization

OEMs and Tier-1 suppliers are using cloud-based digital-twin frameworks to model inverter performance over thousands of real-world drive cycles before physical prototyping. This technique can save development time by 30-40 % and enables over-the-air recalibration of switching settings after sale, hence offering recurrent software-revenue streams associated with inverter hardware[10].

ย 

Bidirectional Vehicle-to-Grid Inverter Architectures

California, the Netherlands and Japanโ€™s utilities testing vehicle-to-grid projects are finding that the onboard inverter is a door to demand-response revenues. Bidirectional DC-AC inverters able to export 10-19 kW back to the grid add USD 400-600 to the vehicle bill-of-materials but release energy-arbitrage income that can balance vehicle ownership costs[18].

ย 

GaN-on-SiC Hybrid Power Modules

Gallium-nitride transistors co-packaged with SiC substrates are emerging in auxiliary inverter applications (HVAC compressors, DC-DC converters) and may migrate to traction inverters above 100 kW by 2030. Early prototypes demonstrate 98.5% peak efficiency, offering a technology upgrade path for the electric vehicle power inverter market beyond the current SiC-only generation[19].

ย 

Electric Vehicle Power Inverter Market Future Outlook

Bidirectional Power Flow and Grid Integration

Vehicle-to-grid technology will redefine the inverter's role from a unidirectional power converter to a distributed-energy asset. California's CPUC has approved V2G tariff structures that compensate EV owners for grid stabilization services, and the ISO 15118-20 communication standard โ€” ratified in 2024 โ€” enables automated bidirectional energy transactions. By 2030, an estimated 15% of new BEVs sold in Europe and North America will ship with bidirectional-capable onboard inverters, expanding addressable content value per vehicle by USD 400โ€“600 [18].

AI-Driven Predictive Inverter Control

Machine-learning algorithms embedded in inverter control units are beginning to optimize switching patterns in real time based on driver behavior, road topology, and battery state-of-health. Tesla's proprietary neural-net torque-vectoring controller and BYD's e-Platform 3.0 adaptive efficiency mode represent early commercializations. IEA projects that AI-optimized power electronics could improve fleet-average energy consumption by 3โ€“5% by 2032, translating directly into range gains for the electric vehicle power inverter market [10][23].

Next-Generation Wide-Bandgap Materials

While silicon carbide dominates the near-term transition, gallium-nitride-on-silicon and ultra-wide-bandgap materials such as gallium oxide and diamond substrates are progressing through laboratory validation. The US Department of Energy's ARPA-E CIRCUITS program allocated USD 42 million in 2024 to advance GaN vertical-transistor designs targeting 99% inverter efficiency at 10 kW/L power density [19]. Commercialization timelines suggest pilot automotive adoption by 2031โ€“2033.

ESG Reporting and Supply-Chain Traceability

The EU's Corporate Sustainability Reporting Directive and proposed battery-passport regulation will require Tier-1 inverter suppliers to disclose embedded-carbon metrics and mineral provenance by 2027. Automakers are already conditioning platform contracts on lifecycle-assessment data, favoring suppliers with certified low-carbon SiC production processes. This regulatory pressure will reshape sourcing decisions in the electric vehicle power inverter market throughout the forecast period [24].

ย 

Electric Vehicle Power Inverter Market Segmentation

By Propulsion Type

Segment Key Metric Primary Demand Driver
HEV USD 1.24 Billion (2025) Mild-hybrid mandates in EU and Japan
PHEV 16.3% CAGR (2026โ€“2035) Extended-range preferences in China
BEV 57.9% share (2025) Global ICE phase-out mandates
FCEV 20.9% CAGR (2026โ€“2035) Heavy-truck hydrogen corridors

ย 

Battery-electric vehicles generate the largest slice of the electric vehicle power inverter market, reflecting their dominance across consumer and fleet procurement channels. BEV inverters typically operate in the 150โ€“250 kW range for passenger cars and 300โ€“450 kW for commercial platforms, with system voltages migrating from 400 V to 800 V as charging-speed expectations rise. Fuel-cell electric vehicles represent the fastest-growing propulsion segment, buoyed by European and Korean hydrogen-truck programs that require inverters engineered for the unique transient behavior of PEM fuel-cell stacks [8].

By Vehicle Type

Segment Key Metric Primary Demand Driver
Passenger Cars 67.7% share (2025) Consumer BEV adoption wave
Light Commercial Vehicles USD 1.38 Billion (2025) Last-mile delivery fleet electrification
Heavy Commercial Vehicles & Buses 20.8% CAGR (2026โ€“2035) Urban zero-emission zones

ย 

Passenger cars remain the volume backbone of the electric vehicle power inverter market, though per-unit inverter content is generally lower than in commercial platforms. Heavy commercial vehicles and buses command the fastest segment CAGR, driven by municipal zero-emission zone mandates in London, Paris, Amsterdam, and over 30 Chinese cities that require electric bus procurement for public transit fleets by 2030 [8].

By Voltage Architecture

Segment Key Metric Primary Demand Driver
โ‰ค400 V 63.7% share (2025) Installed base of legacy BEV platforms
โ‰ฅ800 V 20.9% CAGR (2026โ€“2035) Ultra-fast charging and cable-weight reduction

ย 

The โ‰ค400 V architecture still dominates installed volumes in the electric vehicle power inverter market, reflecting the large base of first- and second-generation BEV platforms. The โ‰ฅ800 V segment is growing rapidly as new-generation architectures from Hyundai, Porsche, Kia, and multiple Chinese OEMs standardize higher system voltages for sub-20-minute DC fast charging [3].

By Semiconductor Material

Segment Key Metric Primary Demand Driver
Silicon IGBT 65.7% share (2025) Cost advantage in sub-150 kW applications
SiC MOSFET 20.7% CAGR (2026โ€“2035) Efficiency and range gains in premium BEVs

ย 

Silicon IGBTs retain a majority position in the electric vehicle power inverter market owing to mature manufacturing processes and lower per-device cost. The migration to silicon-carbide devices is accelerating in premium and mid-range BEVs, where the 5โ€“8% efficiency gain justifies the current cost premium of approximately 2โ€“3ร— over equivalent silicon modules [4][11].

By Integration Level

Segment Key Metric Primary Demand Driver
Stand-Alone 67.0% share (2025) Flexibility for multi-platform OEM sourcing
E-Axle 20.9% CAGR (2026โ€“2035) Mass and cost reduction through consolidation
CIDD (Charger-Inverter-DC/DC) USD 0.38 Billion (2025) Compact packaging for small BEVs

ย 

Stand-alone inverters dominate the electric vehicle power inverter market today, but the share of integrated e-Axle solutions is climbing as OEMs seek single-housing motor-inverter-gearbox units that simplify assembly and reduce wiring mass. BorgWarner, Nidec, and Vitesco Technologies are all scaling e-Axle production capacity, and the format is expected to reach cost parity with discrete architectures by 2029 [7].

ย 

Regional Market Share Analysis

Region Key Metric Primary Investment Themes
North America 17.8% CAGR (2026โ€“2035) IRA manufacturing credits, domestic SiC fabs
Europe USD 2.10 Billion (2025) COโ‚‚ fleet penalties, 800 V platform rollouts
Asia-Pacific 46.2% share (2025) NEV dual credits, SiC substrate self-sufficiency
South America USD 0.42 Billion (2025) Brazilian EV import tariff reform, bus fleet renewal
Middle East & Africa 18.9% CAGR (2026โ€“2035) Saudi Vision 2030 EV localization, UAE green-zone mandates
Total USD 9.53 Billion (2025) โ€”

The electric vehicle power inverter market spans five major regions, with Asia-Pacific anchoring both production volume and component-technology development. Regional demand patterns reflect divergent policy timelines, OEM platform strategies, and semiconductor supply-chain proximity.

ย 

North America

Country Key Metric Key Driver
US 78.4% of regional share IRA Section 45X advanced-manufacturing tax credits
Canada 12.6% of regional share ZEV mandate in Quebec and British Columbia
Mexico USD 0.21 Billion (2025) Nearshoring of Tier-1 EV powertrain assembly

ย 

The United States dominates the North American electric vehicle power inverter market through a combination of federal tax credits and state-level ZEV mandates covering more than 40% of new-car registrations. Wolfspeed's Mohawk Valley fab and onsemi's Hudson, New Hampshire expansion are building a domestic SiC supply chain that reduces reliance on Asian substrates. Canada's federal EV purchase incentives and Mexico's growing role as a low-cost powertrain assembly hub round out the regional picture [2][4].

Europe

Country Key Metric Key Driver
Germany 28.5% of regional share OEM platform launches (VW, BMW, Mercedes)
UK 16.3% of regional share 2035 ICE phase-out, Gigafactory investment
France USD 0.27 Billion (2025) Renault-Ampere EV spin-off investment
Italy 9.1% of regional share Stellantis e-Axle localization
Spain 7.4% of regional share SEAT/CUPRA BEV production ramp
Nordic Countries 19.1% CAGR (2026โ€“2035) High EV penetration rate (Norway > 90%)
Russia USD 0.04 Billion (2025) Limited; constrained by sanctions
Rest of Europe 8.2% of regional share Eastern European component assembly growth

ย 

Europe's regulatory apparatus โ€” the Fit-for-55 package, Euro 7 emission standards, and national ICE ban timelines โ€” creates the most prescriptive demand signal for the electric vehicle power inverter market outside China. Germany's three premium OEMs are migrating flagship platforms to 800 V architectures, while Infineon's Kulim and Dresden fabs anchor the region's SiC MOSFET supply strategy [1][3].

Asia-Pacific

Country Key Metric Key Driver
China 58.3% of regional share NEV dual-credit policy, BYD/CATL vertical integration
India 19.6% CAGR (2026โ€“2035) FAME III subsidies, two-wheeler electrification
Japan USD 0.62 Billion (2025) Power-module packaging IP, Toyota BEV pivot
South Korea 12.8% of regional share Hyundai E-GMP/IMA platform expansion
ASEAN 20.3% CAGR (2026โ€“2035) Thailand 30@30 EV policy, VinFast production
Rest of Asia-Pacific 4.1% of regional share Nascent EV programs in emerging economies

ย 

Asia-Pacific's leadership in the electric vehicle power inverter market rests on China's unmatched EV production scale โ€” exceeding 10 million NEVs annually by 2025 โ€” and the region's control of upstream silicon-carbide crystal growth. BYD's vertical integration from wafer fabrication to vehicle assembly compresses the supply chain and sets a cost benchmark that Western competitors struggle to match [5][17].

South America

Country Key Metric Key Driver
Brazil 62.7% of regional share Rota 2030 program, ethanol-hybrid-BEV policy
Argentina 18.4% CAGR (2026โ€“2035) Lithium mining linkages, nascent EV assembly
Rest of South America USD 0.07 Billion (2025) Early-stage fleet electrification pilots

ย 

Brazil anchors the South American electric vehicle power inverter market, though its unique flex-fuel-hybrid policy creates a demand profile distinct from other regions. The Rota 2030 automotive competitiveness program offers tax incentives for locally manufactured EV powertrain components, and Chinese OEMs โ€” BYD, Great Wall Motor โ€” are establishing CKD assembly lines that include inverter integration [20].

Middle East & Africa

Country Key Metric Key Driver
Saudi Arabia 34.2% of regional share Vision 2030 EV localization mandates
UAE USD 0.05 Billion (2025) Dubai Green Mobility Strategy
South Africa 18.1% CAGR (2026โ€“2035) Automotive master plan, BMW iX local assembly
Egypt 14.5% of regional share EV import duty reductions
Rest of MEA USD 0.03 Billion (2025) Nascent policy frameworks

ย 

The Middle East and Africa represent the smallest but fastest-emerging frontier for the electric vehicle power inverter market. Saudi Arabia's Ceer joint venture with Foxconn aims to produce 100,000 EVs annually by 2030, requiring localized inverter sourcing. South Africa's auto industry, long centered on ICE exports to Europe, is pivoting toward EV component manufacturing to retain preferential EU trade access under stricter carbon-border provisions [21][22].

ย 

Electric Vehicle Power Inverter Market By Region, 2025-2035

Competitive Benchmarking

The electric vehicle power inverter market exhibits medium concentration, with the top five players accounting for an estimated 38โ€“44% of global revenue. The competitive structure blends vertically integrated semiconductor-device makers (Infineon, STMicroelectronics), diversified automotive Tier-1 suppliers (BorgWarner, Continental, Denso), and specialized power-electronics companies (Vitesco, Hitachi Astemo). Pricing pressure from Chinese entrants โ€” particularly BYD Semiconductor and StarPower โ€” is compressing margins in the โ‰ค200 kW segment.

Company Est. Revenue Share Range Key Offerings Strategic Positioning
Infineon Technologies ~8โ€“11% HybridPACK Drive, CoolSiC MOSFET modules Vertically integrated SiC supply from wafer to module
BorgWarner ~7โ€“10% eMotor integrated inverters, Viper power modules E-Axle integration leader; broad OEM platform reach
STMicroelectronics ~5โ€“8% SiC MOSFET dies, ACEPACK power modules Long-term SiC wafer supply agreements with multiple OEMs
Denso Corporation ~5โ€“8% Compact power-control units for Toyota/Lexus Deep integration with Toyota BEV platform strategy
Continental AG ~4โ€“7% High-performance power electronics for 800 V Pivoting from ICE systems to dedicated EV division
Vitesco Technologies ~4โ€“6% EMR4 integrated e-Axle inverter Spun off from Continental; pure-play EV powertrain focus
Hitachi Astemo ~4โ€“6% SiC power modules for commercial EVs Honda/Hitachi joint venture; strong in Asian markets
Robert Bosch ~3โ€“5% SiC inverter prototypes, eAxle dev platforms Leveraging broad automotive-systems integration
Hyundai Mobis ~3โ€“5% PE systems for E-GMP / IMA platforms Captive supply to Hyundai-Kia group BEV lineup
Dana Incorporated ~2โ€“4% TM4 e-Axle platform with integrated inverter Specialization in commercial-vehicle electrification

ย 

ย 

Recent News & Developments

ย 

ย 

  • European Commission (November 2024): Finalized Euro 7 emission standards, which include onboard-diagnostics requirements for power-electronics systems โ€” a first regulatory acknowledgment of inverter health monitoring as a safety-relevant function [1].

ย 

ย 

ย 

ย 

  • Hyundai Mobis (December 2023): Inaugurated a power-electronics R&D center in Seoul dedicated to SiC and GaN device integration for the Hyundai Motor Group's next-generation IMA modular platform [3].

ย 

Electric Vehicle Power Inverter Market Report Scope

Parameter Detail
Market Scope Global electric vehicle power inverter market, covering traction and auxiliary inverter systems
Study Period 2021โ€“2035
CAGR (2026โ€“2035) 17.4%
Base Year 2025 โ€” USD 9.53 Billion
2026 Forecast Start USD 11.34 Billion
2035 Forecast End USD 48.04 Billion
Fastest Growing Segments FCEV (propulsion), โ‰ฅ800 V (architecture), E-Axle (integration)
Companies Profiled 10 (Infineon, BorgWarner, STMicroelectronics, Denso, Continental, Vitesco, Hitachi Astemo, Bosch, Hyundai Mobis, Dana)
Valuation Currency USD Billion
Methodology Combined top-down and bottom-up approach; triangulated with OEM production data, Tier-1 revenue disclosures, and regulatory phase-in schedules

ย 

ย 

FAQs

How do OEMs typically structure inverter procurement for new BEV platforms?
Most OEMs award 5โ€“7 year platform contracts to two qualified Tier-1 suppliers, splitting volumes 60/40 to manage supply risk. Price negotiations index to SiC wafer cost curves and annual volume commitments [12].
What thermal interface materials are displacing traditional greases in high-power inverters?
Sintered silver and graphite-based thermal pads are replacing silicone greases, offering 3โ€“5ร— higher thermal conductivity. These materials withstand 200 ยฐC junction cycling without degradation [13].
How does inverter switching frequency affect cabin noise in electric vehicles?
Higher switching frequencies push audible inverter whine above 15 kHz, beyond human hearing. OEMs target 20โ€“40 kHz operation to eliminate NVH complaints without adding acoustic insulation mass [13].
What is the payback period for SiC inverters versus silicon IGBT at the vehicle level?
SiC adds roughly USD 200โ€“350 per inverter but delivers 5โ€“8% range improvement. Fleet operators recover the premium within 18โ€“24 months through reduced energy costs [12].
Are aftermarket inverter upgrades viable for early-generation BEVs?
Aftermarket upgrades remain niche, limited by proprietary CAN-bus protocols and OEM warranty restrictions. A few third-party integrators offer retrofit SiC modules for commercial-fleet vehicles [14].
How will solid-state batteries change inverter design requirements?
Solid-state cells' higher voltage stability could push system architectures to 1,200 V, requiring inverters with higher blocking-voltage devices. Packaging and insulation standards would need revision [19].
What role does the electric vehicle power inverter market play in vehicle cybersecurity compliance?
UN Regulation 155 mandates cybersecurity management for all connected vehicle ECUs, including inverter controllers. OEMs must demonstrate secure boot and encrypted CAN communication for type approval [1]. ย  ย 
Author
Author
Author Profile
Shubham Munde LinkedIn
Team Lead - Research
Shubham brings over 7 years of expertise in Market Intelligence and Strategic Consulting, with a strong focus on the Automotive, Aerospace, and Defense sectors. Backed by a solid foundation in semiconductors, electronics, and software, he has successfully delivered high-impact syndicated and custom research on a global scale. His core strengths include market sizing, forecasting, competitive intelligence, consumer insights, and supply chain mapping. Widely recognized for developing scalable growth strategies, Shubham empowers clients to navigate complex markets and achieve a lasting competitive edge. Trusted by start-ups and Fortune 500 companies alike, he consistently converts challenges into strategic opportunities that drive sustainable growth.

Research Approach

ย 

Secondary Research

The secondary research process involved comprehensive analysis of regulatory databases, automotive industry publications, technical standards documentation, and authoritative transportation organizations. Key sources included the US Department of Energy (DOE), Environmental Protection Agency (EPA), National Highway Traffic Safety Administration (NHTSA), European Automobile Manufacturers' Association (ACEA), International Energy Agency (IEA) Global EV Outlook, International Council on Clean Transportation (ICCT), China Association of Automobile Manufacturers (CAAM), Japan Automobile Manufacturers Association (JAMA), Korea Automobile Manufacturers Association (KAMA), Society of Automotive Engineers (SAE International), International Electrotechnical Commission (IEC), Institute of Electrical and Electronics Engineers (IEEE), European Alternative Fuels Observatory (EAFO), US Bureau of Transportation Statistics, IEA Global EV Data Explorer, BloombergNEF Electric Vehicle Outlook, International Organization of Motor Vehicle Manufacturers (OICA), and national automotive ministry reports from key EV markets including Germany's Federal Motor Transport Authority (KBA), UK Department for Transport, and India's Ministry of Heavy Industries. These sources were used to collect EV sales statistics, inverter efficiency standards, regulatory compliance data, charging infrastructure trends, and competitive landscape analysis for silicon IGBT, silicon carbide (SiC) MOSFET, and gallium nitride (GaN) power inverter technologies across passenger cars, commercial vehicles, and electric buses.

ย 

Primary Research

In order to gather both qualitative and quantitative insights, supply-side and demand-side stakeholders were interviewed during the primary research process. CEOs, vice presidents of engineering, heads of power electronics research and development, and business development directors from manufacturers of power inverters, semiconductors, and automotive Tier 1 suppliers were examples of supply-side sources. Chief engineers, powertrain directors, procurement chiefs, and electrification strategy leaders from OEMs, EV startups, and commercial vehicle manufacturers made up demand-side sources. Primary research verified SiC/GaN adoption schedules, validated market segmentation, and obtained information on supply chain localization trends, cost reduction plans, and thermal management techniques.

Primary Respondent Breakdown:

By Designation: C-level Primaries (28%), Director Level (35%), Others (37%)

By Region: North America (28%), Europe (32%), Asia-Pacific (35%), Rest of World (5%)

ย 

Market Size Estimation

Global market valuation was derived through revenue mapping and unit shipment analysis. The methodology included:

Identification of 50+ key manufacturers across North America, Europe, Asia-Pacific, and China

Product mapping across silicon IGBT, silicon carbide (SiC), and gallium nitride (GaN) inverter categories by power rating (up to 50 kW, 50-100 kW, 100-200 kW, above 200 kW)

Analysis of reported and modeled annual revenues specific to EV power inverter portfolios

Coverage of manufacturers representing 75-80% of global market share in 2024

Extrapolation using bottom-up (EV unit sales ร— inverter ASP by vehicle type and region) and top-down (manufacturer revenue validation) approaches to derive segment-specific valuations

Download Free Sample

Kindly complete the form below to receive a free sample of this Report

Download PDF ×

We do not share your information with anyone. However, we may send you emails based on your report interest from time to time. You may contact us at any time to opt-out.
















