EV Power Inverter Market (2026 - 2035)

ID: MRFR/AT/23762-HCR
128 Pages
Shubham Munde
Last Updated: June 22, 2026
Electric Vehicle Power Inverter Market Research Report By Power Level (Low Power (up to 100kW), Medium Power (100kW - 250kW), High Power (250kW and above)), By Cooling System (Liquid Cooled, Air Cooled), By Output Voltage (Low Voltage (less than 400V), Medium Voltage (400V - 1000V), High Voltage (1000V and above)), By Application (Passenger Vehicles, Commercial Vehicles, Industrial Vehicles) and By Regional (North America, Europe, South America, Asia Pacific, Middle East and Africa) - Forecast to 2035
EV Power Inverter Market
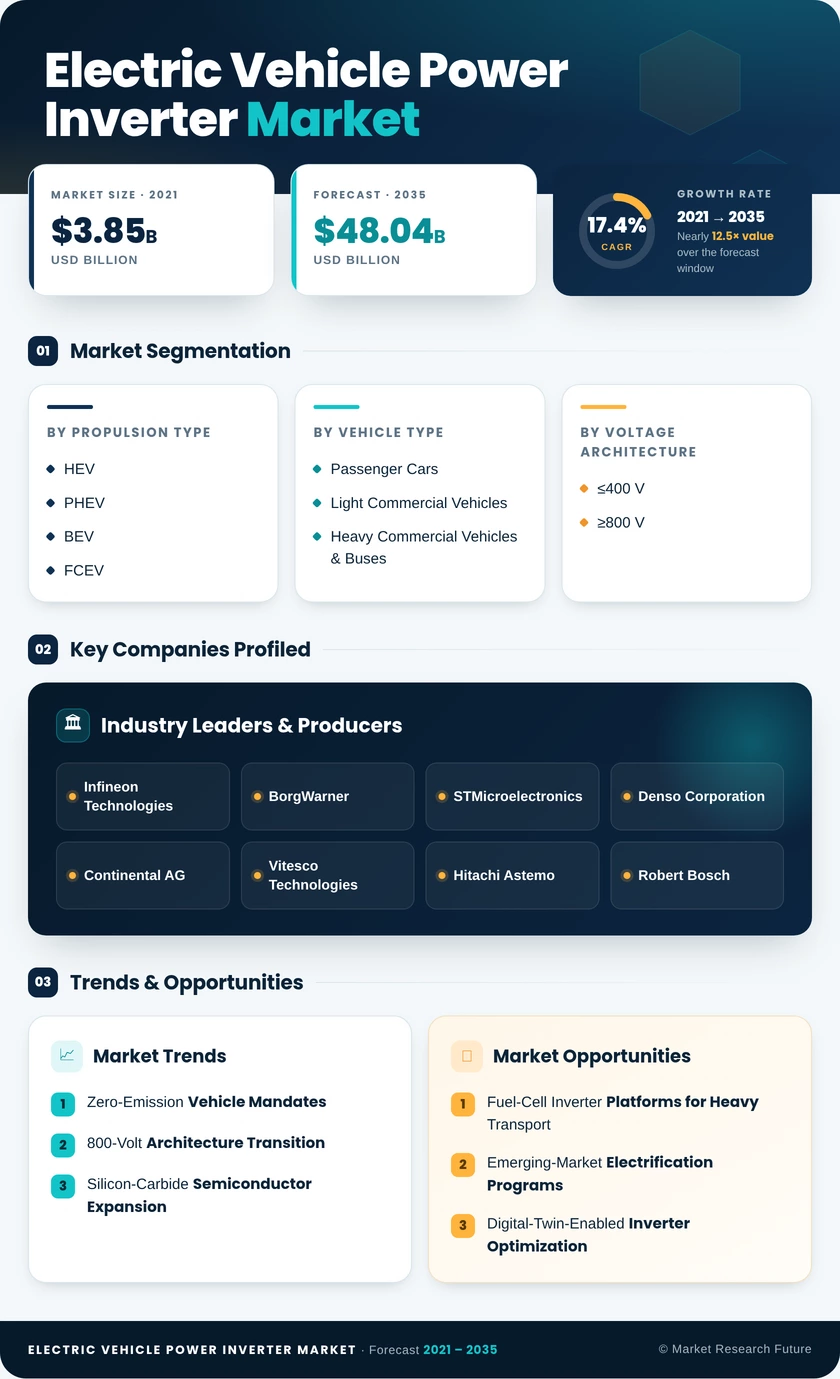
Market Size
Forecast Period2026-2035
CAGR (2026-2035)17.4%
2026 Market SizeUSD 11.34 Billion
2035 Market SizeUSD 48.04 Billion
Key Players
Infineon Technologies
BorgWarner
STMicroelectronics
Denso Corporation
Continental AG
Vitesco Technologies
Opportunities
  • Fuel-Cell Inverter Platforms for Heavy Transport
  • Emerging-Market Electrification Programs
  • Digital-Twin-Enabled Inverter Optimization
  1. 1 Market Overview |
    1. 1.1 Study Assumptions & Market Definition |
    2. 1.2 Scope of the Study |
    3. 1.3 Research Methodology
  2. 2 Market Summary & Key Takeaways
  3. 3 Market Dynamics |
    1. 3.1 Market Drivers Analysis | |
      1. 3.1.1 Zero-Emission Vehicle Mandates | |
      2. 3.1.2 800-Volt Architecture Transition | |
      3. 3.1.3 Silicon-Carbide Semiconductor Expansion | |
      4. 3.1.4 Integrated E-Axle Consolidation | |
      5. 3.1.5 Commercial Fleet Electrification | |
      6. 3.1.6 Battery Cost Deflation | |
      7. 3.1.7 Autonomous Driving Power Demands |
    2. 3.2 Market Restraints Analysis | |
      1. 3.2.1 SiC Wafer Supply Constraints | |
      2. 3.2.2 Thermal Management Complexity | |
      3. 3.2.3 Legacy IGBT Overcapacity | |
      4. 3.2.4 Grid Infrastructure Deficits | |
      5. 3.2.5 Semiconductor Export Controls |
    3. 3.3 Market Opportunity Analysis | |
      1. 3.3.1 Fuel-Cell Inverter Platforms for Heavy Transport | |
      2. 3.3.2 Emerging-Market Electrification Programs | |
      3. 3.3.3 Digital-Twin-Enabled Inverter Optimization | |
      4. 3.3.4 Bidirectional Vehicle-to-Grid Inverter Architectures | |
      5. 3.3.5 GaN-on-SiC Hybrid Power Modules |
    4. 3.4 Industry Value Chain Analysis |
    5. 3.5 Porter's Five Forces Analysis
  4. 4 Global Electric Vehicle Power Inverter Market Size & Forecast (2021–2035) |
    1. 4.1 Historical Market Size (2021–2025) |
    2. 4.2 Current & Forecast Market Size (2026–2035) |
    3. 4.3 Market Size by Revenue (USD Billion) |
    4. 4.4 Year-over-Year Growth Analysis
  5. 5 Segmentation Analysis |
    1. 5.1 By Propulsion Type | |
      1. 5.1.1 HEV | |
      2. 5.1.2 PHEV | |
      3. 5.1.3 BEV | |
      4. 5.1.4 FCEV |
    2. 5.2 By Vehicle Type | |
      1. 5.2.1 Passenger Cars | |
      2. 5.2.2 Light Commercial Vehicles | |
      3. 5.2.3 Heavy Commercial Vehicles & Buses |
    3. 5.3 By Voltage Architecture | |
      1. 5.3.1 ≤400 V | |
      2. 5.3.2 ≥800 V |
    4. 5.4 By Semiconductor Material | |
      1. 5.4.1 Silicon IGBT | |
      2. 5.4.2 SiC MOSFET |
    5. 5.5 By Integration Level | |
      1. 5.5.1 Stand-Alone | |
      2. 5.5.2 E-Axle | |
      3. 5.5.3 CIDD (Charger-Inverter-DC/DC)
  6. 6 Regional Analysis |
    1. 6.1 North America | |
      1. 6.1.1 United States | |
      2. 6.1.2 Canada | |
      3. 6.1.3 Mexico |
    2. 6.2 Europe | |
      1. 6.2.1 Germany | |
      2. 6.2.2 United Kingdom | |
      3. 6.2.3 France | |
      4. 6.2.4 Italy | |
      5. 6.2.5 Spain | |
      6. 6.2.6 Nordic Countries | |
      7. 6.2.7 Russia | |
      8. 6.2.8 Rest of Europe |
    3. 6.3 Asia-Pacific | |
      1. 6.3.1 China | |
      2. 6.3.2 India | |
      3. 6.3.3 Japan | |
      4. 6.3.4 South Korea | |
      5. 6.3.5 ASEAN | |
      6. 6.3.6 Rest of Asia-Pacific |
    4. 6.4 South America | |
      1. 6.4.1 Brazil | |
      2. 6.4.2 Argentina | |
      3. 6.4.3 Rest of South America |
    5. 6.5 Middle East & Africa | |
      1. 6.5.1 Saudi Arabia | |
      2. 6.5.2 UAE | |
      3. 6.5.3 South Africa | |
      4. 6.5.4 Egypt | |
      5. 6.5.5 Rest of MEA
  7. 7 Competitive Landscape |
    1. 7.1 Market Share Analysis (2025) |
    2. 7.2 Competitive Benchmarking Matrix |
    3. 7.3 Company Profiles | |
      1. 7.3.1 Infineon Technologies | |
      2. 7.3.2 BorgWarner | |
      3. 7.3.3 STMicroelectronics | |
      4. 7.3.4 Denso Corporation | |
      5. 7.3.5 Continental AG | |
      6. 7.3.6 Vitesco Technologies | |
      7. 7.3.7 Hitachi Astemo | |
      8. 7.3.8 Robert Bosch | |
      9. 7.3.9 Hyundai Mobis | |
      10. 7.3.10 Dana Incorporated
  8. 8 Future Outlook & Strategic Recommendations (2026–2035) |
    1. 8.1 Near-Term Outlook (2026–2028) |
    2. 8.2 Medium-Term Outlook (2029–2031) |
    3. 8.3 Long-Term Outlook (2032–2035)
  9. 9 Recent Developments & News
  10. 10 Frequently Asked Questions (FAQs)
  11. 11 Report Scope & Methodology |
    1. 11.1 Study Period & Base Year |
    2. 11.2 Data Sources & Citations |
    3. 11.3 Abbreviations
  12. 12 LIST OF TABLES |
  13. TABLE 1 Global Electric Vehicle Power Inverter Market Size & Forecast, by Revenue (USD Billion), 2021–2035 |
  14. TABLE 2 Global Electric Vehicle Power Inverter Market — Year-over-Year Growth Analysis, 2021–2035 |
  15. TABLE 3 Driver Impact Analysis — Electric Vehicle Power Inverter Market |
  16. TABLE 4 Restraint Impact Analysis — Electric Vehicle Power Inverter Market |
  17. TABLE 5 Regional Market Summary — Electric Vehicle Power Inverter Market, 2025 |
  18. TABLE 6 North America Electric Vehicle Power Inverter Market Size, by Country, 2021–2035 (USD Billion) |
  19. TABLE 7 Europe Electric Vehicle Power Inverter Market Size, by Country, 2021–2035 (USD Billion) |
  20. TABLE 8 Asia-Pacific Electric Vehicle Power Inverter Market Size, by Country, 2021–2035 (USD Billion) |
  21. TABLE 9 South America Electric Vehicle Power Inverter Market Size, by Country, 2021–2035 (USD Billion) |
  22. TABLE 10 Middle East & Africa Electric Vehicle Power Inverter Market Size, by Country, 2021–2035 (USD Billion) |
  23. TABLE 11 Global Electric Vehicle Power Inverter Market Size, by Propulsion Type, 2021–2035 (USD Billion) |
  24. TABLE 12 Global Electric Vehicle Power Inverter Market Size, by Vehicle Type, 2021–2035 (USD Billion) |
  25. TABLE 13 Global Electric Vehicle Power Inverter Market Size, by Voltage Architecture, 2021–2035 (USD Billion) |
  26. TABLE 14 Global Electric Vehicle Power Inverter Market Size, by Semiconductor Material, 2021–2035 (USD Billion) |
  27. TABLE 15 Global Electric Vehicle Power Inverter Market Size, by Integration Level, 2021–2035 (USD Billion) |
  28. TABLE 16 Competitive Benchmarking Matrix — Electric Vehicle Power Inverter Market, 2025 |
  29. TABLE 17 Company Profiles — Key Players, Electric Vehicle Power Inverter Market |
  30. TABLE 18 Recent Developments & Strategic Announcements, 2023–2025 |
  31. TABLE 19 Report Scope & Methodology Summary |
  32. TABLE 20 Detailed Sources and Citations
  33. 13 LIST OF FIGURES |
  34. FIGURE 1 Electric Vehicle Power Inverter Market Dynamics — Drivers, Restraints & Opportunities |
  35. FIGURE 2 Industry Value Chain Analysis — Electric Vehicle Power Inverter Market |
  36. FIGURE 3 Porter's Five Forces Analysis — Electric Vehicle Power Inverter Market |
  37. FIGURE 4 Global Electric Vehicle Power Inverter Market Size Trend (USD Billion), 2021–2035 |
  38. FIGURE 5 Electric Vehicle Power Inverter Market Share, by Propulsion Type, 2025 |
  39. FIGURE 6 Electric Vehicle Power Inverter Market Share, by Vehicle Type, 2025 |
  40. FIGURE 7 Electric Vehicle Power Inverter Market Share, by Voltage Architecture, 2025 |
  41. FIGURE 8 Electric Vehicle Power Inverter Market Share, by Semiconductor Material, 2025 |
  42. FIGURE 9 Electric Vehicle Power Inverter Market Share, by Integration Level, 2025 |
  43. FIGURE 10 Electric Vehicle Power Inverter Market Share, by Region, 2025 |
  44. FIGURE 11 North America Electric Vehicle Power Inverter Market Share, by Country, 2025 |
  45. FIGURE 12 Europe Electric Vehicle Power Inverter Market Share, by Country, 2025 |
  46. FIGURE 13 Asia-Pacific Electric Vehicle Power Inverter Market Share, by Country, 2025 |
  47. FIGURE 14 South America Electric Vehicle Power Inverter Market Share, by Country, 2025 |
  48. FIGURE 15 Middle East & Africa Electric Vehicle Power Inverter Market Share, by Country, 2025 |
  49. FIGURE 16 Competitive Landscape — Electric Vehicle Power Inverter Market, 2025

Segmentation Quick Reference

DimensionSub-SegmentsDominant SegmentFastest Growing Segment
Propulsion TypeHEV, PHEV, BEV, FCEVBEVFCEV
Vehicle TypePassenger Cars, Light Commercial Vehicles, Heavy Commercial Vehicles & BusesPassenger CarsHeavy Commercial Vehicles & Buses
Voltage Architecture≤400 V, ≥800 V≤400 V≥800 V
Semiconductor MaterialSilicon IGBT, SiC MOSFETSilicon IGBTSiC MOSFET
Integration LevelStand-Alone, E-Axle, CIDDStand-AloneE-Axle


Market Segmentation Overview

By Propulsion Type

Sub-SegmentKey Trend
HEVStable demand driven by mild-hybrid mandates in Europe and Japan; 48 V systems dominate
PHEVTransitional segment sustained by Chinese extended-range EV preferences; declining share in Europe
BEVVolume leader supported by global ICE phase-out timelines; 800 V migration underway
FCEVFastest growth fueled by hydrogen heavy-truck corridors in EU and South Korea


Battery-electric vehicles anchor the propulsion landscape, accounting for the majority of inverter shipments globally. Fuel-cell models represent a smaller base but are growing rapidly as hydrogen infrastructure matures for long-haul commercial applications.

By Vehicle Type

Sub-SegmentKey Trend
Passenger CarsDominant volume segment; SiC adoption highest in premium BEV platforms
Light Commercial VehiclesRising fast on last-mile delivery electrification from Amazon, DHL, and JD.com fleets
Heavy Commercial Vehicles & BusesFastest growth; municipal zero-emission bus mandates in 30+ cities worldwide


Passenger cars lead on volume, while commercial segments command higher per-unit inverter content and are the fastest-growing category.

By Voltage Architecture

Sub-SegmentKey Trend
≤400 VLegacy standard; remains dominant in entry-level and mid-range BEVs
≥800 VRapid adoption in premium platforms; enables ultra-fast charging and cable-mass reduction


The industry is transitioning from 400 V to 800 V architectures, driven by consumer demand for faster charging and OEM pursuit of wiring-harness weight savings.

By Semiconductor Material

Sub-SegmentKey Trend
Silicon IGBTCost-effective incumbent; preferred in sub-150 kW applications and price-sensitive markets
SiC MOSFETHigh-efficiency device gaining share; supported by major fab expansions through 2028


Silicon IGBTs retain a cost advantage in lower-power applications, but wide-bandgap SiC devices are rapidly gaining ground as manufacturing scale drives unit costs down.

By Integration Level

Sub-SegmentKey Trend
Stand-AloneCurrent dominant format; offers sourcing flexibility across OEM platforms
E-AxleMotor-inverter-gearbox integration; trending toward cost parity by 2029
CIDDCompact charger-inverter-converter integration for small-footprint BEVs


Stand-alone inverters provide OEMs with multi-platform sourcing flexibility, while e-Axle integration is the strategic direction for high-volume next-generation platforms.


 

Download PDF ×

We do not share your information with anyone. However, we may send you emails based on your report interest from time to time. You may contact us at any time to opt-out.