Segmentation Quick Reference
| Dimension | Sub-Segments | Dominant Segment | Fastest Growing Segment |
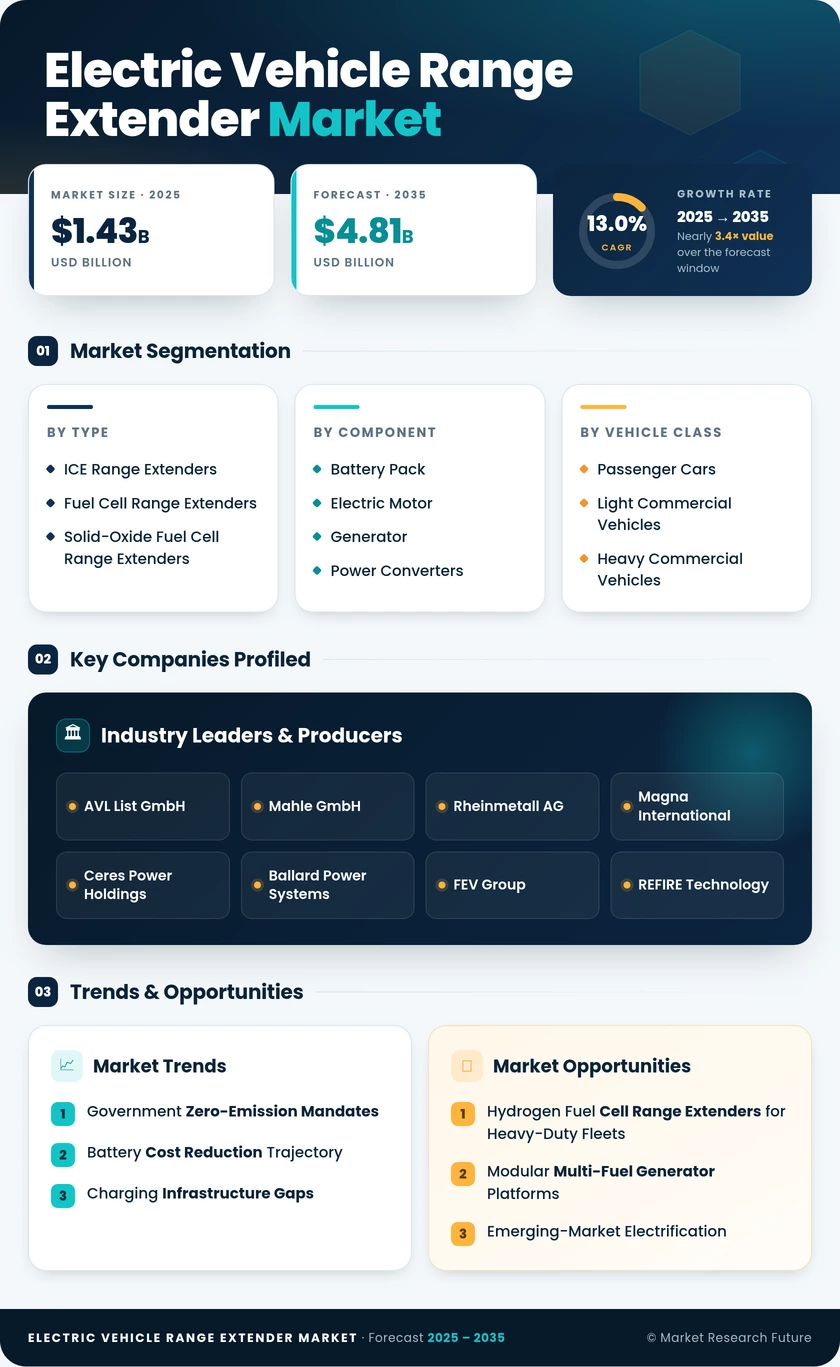
| Technology Type | ICE Range Extenders; Fuel Cell Range Extenders; Solid-Oxide Fuel Cell Range Extenders | ICE Range Extenders (71.2% share, 2025) | Fuel Cell Range Extenders (23.8% CAGR) |
| Component | Battery Pack; Electric Motor; Generator; Power Converters | Battery Pack (46.1% share, 2025) | Power Converters (19.9% CAGR) |
| Vehicle Class | Passenger Cars; Light Commercial Vehicles; Heavy Commercial Vehicles | Passenger Cars (66.2% share, 2025) | Heavy Commercial Vehicles (22.1% CAGR) |
| Power Output | Less Than 30 kW; 30–60 kW; 60–100 kW; Above 100 kW | 30–60 kW (43.7% share, 2025) | Above 100 kW (27.0% CAGR) |
| Region | North America; Europe; Asia-Pacific; South America; Middle East & Africa | Europe (36.3% share, 2025) | Asia-Pacific (20.4% CAGR) |
Market Segmentation Overview
By Technology Type
| Sub-Segment | Key Trend |
| ICE Range Extenders | Compact rotary and three-cylinder engines achieving sub-30 kg weight targets for passenger car integration |
| Fuel Cell Range Extenders | PEM fuel cell stacks scaling for heavy-duty commercial applications as hydrogen costs decline |
| Solid-Oxide Fuel Cell Range Extenders | High-efficiency (55–60%) stacks crossing over from stationary power to marine and specialty vehicle markets |
ICE range extenders maintain dominance through cost advantage and manufacturing maturity, yet fuel cell variants are closing the gap as government hydrogen strategies and falling electrolyzer costs improve total cost of ownership. Solid-oxide systems serve niche applications where fuel flexibility and high electrical efficiency outweigh slower start-up characteristics.
By Component
| Sub-Segment | Key Trend |
| Battery Pack | Declining cell costs enabling smaller, lighter packs optimized for range-extender duty cycles |
| Electric Motor | Dual-use motor-generator architectures reducing component count and system weight |
| Generator | Micro-turbine and Wankel rotary designs competing with traditional reciprocating generators |
| Power Converters | SiC and GaN wide-bandgap semiconductors improving conversion efficiency and thermal performance |
Battery packs remain the highest-value component, though their cost share is declining faster than other subsystems. Power converters are emerging as a critical differentiator, with wide-bandgap semiconductor adoption enabling smaller, lighter, and more efficient power electronics packages.
By Vehicle Class
| Sub-Segment | Key Trend |
| Passenger Cars | Chinese EREV SUVs driving volume; European premium brands developing next-generation platforms |
| Light Commercial Vehicles | Last-mile delivery operators adopting range extenders to guarantee daily route completion |
| Heavy Commercial Vehicles | Mining, defense, and construction sectors requiring high-output, continuous-duty generation systems |
Passenger cars drive the majority of unit volume, but heavy commercial vehicles contribute disproportionately to revenue per unit due to higher power output requirements and premium pricing for ruggedized, duty-rated systems.
By Power Output
| Sub-Segment | Key Trend |
| Less Than 30 kW | City cars and micro-mobility platforms using ultra-compact generators for urban duty cycles |
| 30–60 kW | Sweet spot for mid-size passenger vehicles, balancing highway performance and packaging constraints |
| 60–100 kW | Growing segment for SUVs and light trucks requiring sustained highway-speed generation |
| Above 100 kW | Heavy-duty mining trucks, military logistics vehicles, and marine applications demanding continuous high output |
The 30–60 kW bracket serves the largest installed base, reflecting the passenger car segment's dominance. Above-100 kW systems are expanding rapidly as electrification reaches heavy industrial and defense verticals where no practical alternative to onboard high-power generation currently exists.
By Region
| Sub-Segment | Key Trend |
| North America | Fleet electrification mandates and the NEVI infrastructure program driving commercial adoption |
| Europe | Euro 7 compliance, clean-air zones, and OEM R&D investment anchoring the largest regional market |
| Asia-Pacific | China's EREV boom and expanding domestic supply chains fueling the fastest regional growth |
| South America | Flex-fuel range extender compatibility with Brazil's ethanol infrastructure creating unique demand |
| Middle East & Africa | Mining and defense fleet decarbonization programs under Vision 2030 and ESG pressure |
Europe leads on revenue share through its combination of stringent emission regulations and OEM engineering investment. Asia-Pacific's growth trajectory reflects China's consumer-driven EREV adoption wave and the scaling of domestic component manufacturers, positioning the region to potentially surpass Europe in absolute market size before 2035.