Embedded Analytics Market Summary
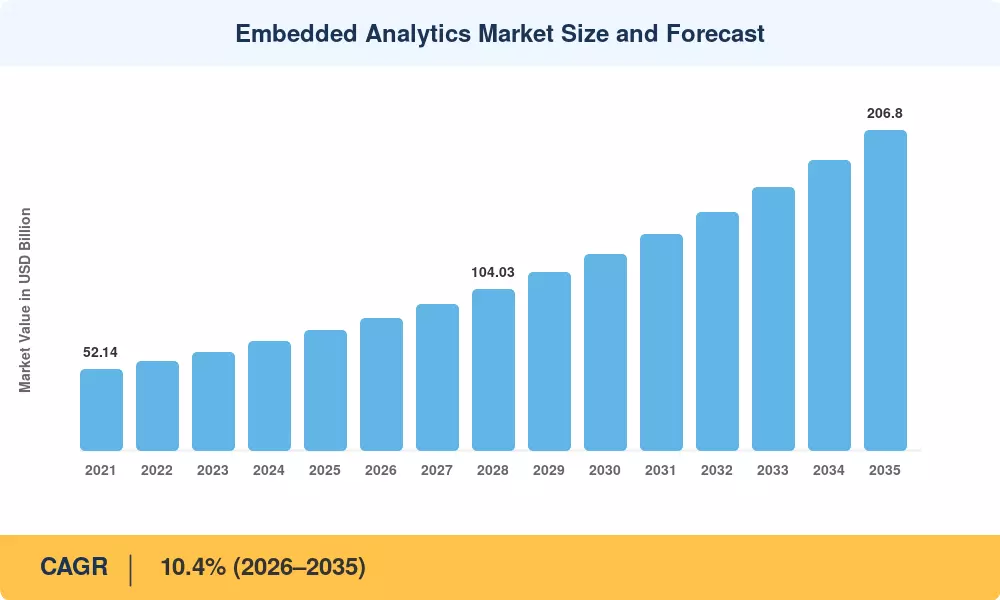
The global Embedded Analytics Market reached an estimated USD 77.5 billion in 2025 and is projected to grow from USD 85.6 billion in 2026 to USD 206.8 billion by 2035, registering a CAGR of 10.4% during the forecast period (2026–2035). This expansion is anchored in the accelerating shift toward data-driven decision-making inside operational workflows — enterprise software buyers now expect self-service BI embedded in applications as a baseline capability, not a premium add-on. The U.S. CHIPS and Science Act's emphasis on domestic technology sovereignty has channeled over USD 52 billion into semiconductor and software infrastructure, indirectly catalyzing demand for embedded real-time dashboard solutions across manufacturing execution systems and supply-chain platforms [2].
A fundamental transformation is underway across the Embedded Analytics Market as legacy standalone BI tools give way to white-label analytics embedded in SaaS products. Organizations that once exported data to third-party dashboards are now integrating analytics directly into their CRM, ERP, and HCM applications using OEM analytics integration for software vendors. Gartner estimates that by 2027, more than 60% of all new business applications will ship with embedded analytics capabilities, up from roughly 33% in 2023 [3]. This shift is compressing the traditional BI sales cycle and driving platform vendors to acquire or build no-code embedded reporting tools that can be deployed in weeks rather than months.
North America commands approximately 38% of the Embedded Analytics Market, powered by a dense SaaS ecosystem and mature data governance frameworks. Asia-Pacific stands as the fastest-growing region at a projected CAGR of 13.1%, fueled by India's Digital India program and China's enterprise-software modernization wave. Europe holds the second-largest share at roughly 27%, where GDPR-compliant analytics architectures give European vendors a distinct competitive edge. As AI copilots and natural-language query interfaces reshape user expectations, the Embedded Analytics Market is set to become the primary interface through which non-technical workers consume intelligence
Key Report Takeaways
• By Component
- Self-service BI embedded in applications accounted for the dominant component share at approximately 41% in 2025, driven by enterprises demanding drag-and-drop dashboards inside their daily workflows
- No-code embedded reporting tools represent the fastest-growing component at a CAGR of 13.8%, as ISVs compress time-to-value for their end users
- Embedded real-time dashboard solutions generated approximately USD 18.2 billion in 2025 revenue, reflecting the operational analytics surge
• By End-User Vertical
- The BFSI sector leads the Embedded Analytics Market with an estimated 22% vertical share, anchored by fraud-detection dashboards and regulatory reporting
- Healthcare analytics deployments are expanding at a CAGR of 12.6%, the fastest among verticals, propelled by value-based care mandates
• By Region
- North America generated approximately USD 29.5 billion in 2025 Embedded Analytics Market revenue
- Asia-Pacific's 13.1% CAGR makes it the fastest-growing region, with India and China each surpassing USD 5 billion in embedded analytics spending by 2025
- Europe's Embedded Analytics Market held roughly 27% global share, supported by GDPR-aligned data residency architectures
Embedded Analytics Market Size & Forecast (2021–2035)
Market sizing combines bottom-up revenue modeling from vendor disclosures, SEC filings, and primary interviews with top-down validation against macroeconomic IT spending benchmarks published by IDC and Gartner. Historical figures (2021–2024) draw on audited financial statements, while the forecast trajectory (2026–2035) is calibrated against enterprise software adoption curves and verified through expert panel consensus.


.webp?v=1782888027)