Energy Retrofit Systems Market (2026 - 2035)

Energy Retrofit Systems Market Research Report By Technology (HVAC Systems, Building Envelope, Lighting Systems, Building Automation & Controls, Renewable Energy Integration), By Application (Commercial Buildings, Residential Buildings, Industrial Facilities, Institutional Buildings), By End User (Building Owners/Operators, ESCOs, Government Agencies, Real Estate Developers), By Retrofit Depth (Deep Energy Retrofits, Shallow/Light Energy Retrofits) and By Regional (North America, Europe, South America, Asia Pacific, Middle East and Africa) - Industry Forecast to 2035
ID: MRFR/EnP/10238-HCR
128 Pages
Anshula Mandaokar
Last Updated: July 10, 2026
Energy Retrofit Systems Market
Market Size
Forecast Period2026-2035
CAGR (2026-2035)7.3%
2025 Market SizeUSD 81.4 Billion
2035 Market SizeUSD 164.3 Billion
Key Players
Johnson Controls
Honeywell
Siemens
Schneider Electric
Trane Technologies
Ameresco
Opportunities
  • Emerging Market Retrofit Programs
  • Digital Twin and AI-Driven Retrofit Optimization
  • Net-Zero Whole-Building Retrofit Packages

Energy Retrofit Systems Market Summary

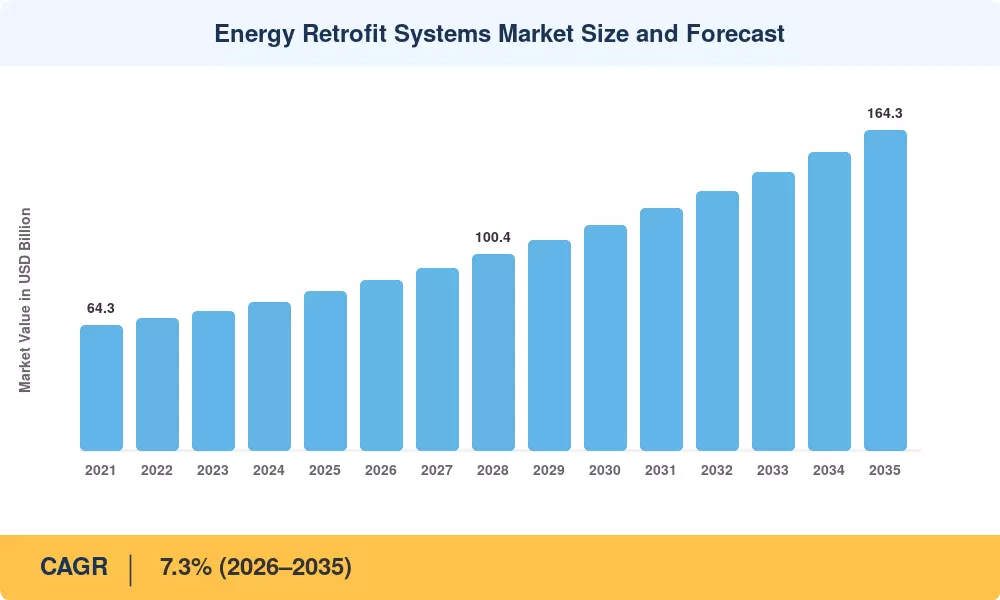
The global Energy Retrofit Systems Market reached an estimated USD 81.4 billion in 2025 and is projected to grow from USD 87.3 billion in 2026 to USD 164.3 billion by 2035, registering a CAGR of 7.3% during the forecast period (2026–2035). Buildings account for roughly 37% of global energy-related CO₂ emissions, and governments from the EU to the United States have responded with aggressive decarbonization mandates that funnel capital directly into retrofit activity [1]. The U.S. Inflation Reduction Act alone earmarked over USD 9 billion in rebates and tax credits for residential and commercial energy upgrades, creating a powerful demand catalyst for the Energy Retrofit Systems Market through 2032 [2].

Legacy heating systems, single-pane windows, outdated lighting, and inefficient building controls represent a global installed base worth trillions of dollars — and much of it is now being replaced. The European Union's Energy Performance of Buildings Directive (EPBD) recast in 2024 mandates that the worst-performing 15% of non-residential buildings undergo renovation by 2030, accelerating the transition from fossil-fuel boilers to heat pumps and from conventional lighting to intelligent LED arrays [3]. Private-sector energy service companies (ESCOs) have scaled their project pipelines by more than 22% year-over-year since 2022, deploying performance-based contracts that remove upfront cost barriers for building owners [4].

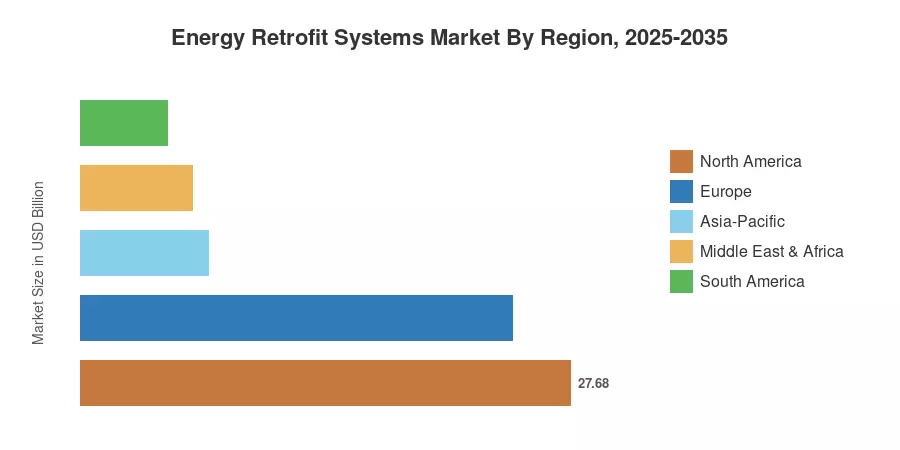
North America commands the largest share of the Energy Retrofit Systems Market at roughly 34% of global revenue, driven by federal incentive programs and stringent state-level building codes in California and New York. Asia-Pacific is the fastest-growing region with a projected CAGR of 8.9%, fueled by China's aggressive building energy efficiency targets and India's Energy Conservation Building Code updates [5]. Europe holds approximately 30% market share, anchored by the EU Renovation Wave strategy targeting 35 million building units by 2030 [6]. As aging building stock across all major economies approaches critical replacement thresholds, the retrofit value chain is poised for sustained double-digit investment growth in several sub-segments through 2035.


Key Report Takeaways

• By Technology

  • HVAC system retrofits command the largest technology share at approximately 36% of the Energy Retrofit Systems Market, reflecting the global push to replace fossil-fuel heating with electric heat pump solutions.
  • Building envelope upgrades — including insulation, fenestration, and air-sealing — are forecast to grow at a CAGR of 8.4% through 2035, the fastest rate among technology segments.
  • Lighting retrofit solutions account for an estimated USD 12.8 billion in 2025 revenue, driven by commercial building conversions to networked LED systems.

• By Application

  • Commercial buildings represent the dominant application segment in the Energy Retrofit Systems Market, holding approximately 42% revenue share in 2025.
  • Residential retrofit activity is growing at a projected CAGR of 7.8%, supported by government rebate programs in North America and Europe.
  • Industrial facility retrofits generated approximately USD 11.4 billion in 2025 as manufacturers pursue ISO 50001 energy management certification.

• By Region

  • North America leads the Energy Retrofit Systems Market with a 34% share, anchored by U.S. federal tax credits and utility demand-side management programs.
  • Asia-Pacific is forecast to reach a CAGR of 8.9% from 2026 to 2035, led by China, Japan, and India.
  • Europe maintains the second-largest revenue share at 30%, underpinned by the EU's Renovation Wave and national building performance standards.


Energy Retrofit Systems Market Size and Forecast (2021–2035)

Market sizing combines bottom-up revenue aggregation across five technology verticals and four building-use categories with top-down cross-validation against IEA building-sector investment data and ESCO industry revenue disclosures. Historical figures (2021–2024) are derived from company filings, national energy agency reports, and trade-association databases. Forecast projections (2026–2035) apply a compound growth model calibrated to policy implementation timelines, technology cost curves, and regional building-stock age distributions [1][4][7].
Energy Retrofit Systems Market Size and Forecast
Our Impact
Enabled $4.3B Revenue Impact for Fortune 500 and Leading Multinationals
Partnering with 2000+ Global Organizations Each Year
30K+ Citations by Top-Tier Firms in the Industry

Driver Impact Analysis

Driver ~% Impact on CAGR Geographic Relevance Impact Timeline
Government decarbonization mandates and building codes +1.8% Global Long-term (≥4 yr)
Federal and state tax credits and rebates +1.4% North America, Europe Short-term (≤2 yr)
Rising commercial energy costs +1.1% Global Medium-term (2–4 yr)
ESCO model expansion and performance contracting +0.9% North America, Europe Medium-term (2–4 yr)
Heat pump cost reduction and technology maturation +0.8% Europe, Asia-Pacific Long-term (≥4 yr)
ESG reporting and green building certification demand +0.7% Global Medium-term (2–4 yr)
Smart building integration and IoT-driven controls +0.6% North America, Asia-Pacific Long-term (≥4 yr)


Government Decarbonization Mandates and Building Codes

Regulatory pressure is the single most influential growth driver for the Energy Retrofit Systems Market. The EU's revised EPBD requires member states to establish minimum energy performance standards that will force renovation of approximately 15% of the worst-performing non-residential buildings by 2030, with residential buildings following by 2033 [3]. In the United States, New York City's Local Law 97 imposes escalating carbon penalties on buildings over 25,000 square feet starting in 2024, with fines exceeding USD 268 per metric ton of CO₂ above threshold — a cost structure that makes retrofitting cheaper than non-compliance for most large commercial properties [13]. Japan's revised Energy Conservation Act similarly tightens performance benchmarks for existing commercial structures, requiring owners to submit and implement energy reduction plans or face administrative penalties [10].

Federal and State Tax Credits and Rebates

Direct financial incentives significantly shorten the payback times for retrofits and increase demand from building owners who are cost-conscious. In addition to extending the 179D business building deduction to USD 5.36 per square foot for projects with 25% or more energy reduction, the U.S. IRA offers Home Energy Rebates of up to USD 5,000 per home [2][9]. For buildings meeting the Efficiency House 55 criteria, Germany's KfW program provides subsidized loans up to 50% of rehabilitation costs; in 2023 alone, the program disbursed nearly EUR 14 billion [14]. For building categories that were previously unprofitable to retrofit, these incentive mechanisms are pushing project economics into favorable territory.


Rising Commercial Energy Costs

Between 2021 and 2024, the average increase in commercial power prices across OECD countries was 28%, which greatly boosted the simple-payback value of energy efficiency projects [7]. Energy bills are the second-largest operational expense behind labor for major commercial portfolios, especially in the healthcare, education, and hospitality sectors. According to IEA estimates, HVAC and building envelope improvements can cut commercial energy use by 30 to 50%, resulting in payback periods of less than five years at current energy costs in the majority of industrialized nations [1]. Many previously postponed maintenance projects are now active retrofit commitments due to this pricing dynamic.


ESCO Model Expansion and Performance Contracting

Energy service companies have transformed the retrofit market by absorbing project performance risk and eliminating upfront capital requirements for building owners. The U.S. ESCO industry generated approximately USD 9.5 billion in revenue in 2023, with federal ESPC (Energy Savings Performance Contracts) representing roughly 35% of total volume [4]. The model is expanding rapidly in Asia-Pacific and Latin America, where institutional and government building owners face tight capital budgets but hold substantial deferred maintenance backlogs. Performance-based contracting effectively monetizes future energy savings, creating a self-funding mechanism that scales the addressable Energy Retrofit Systems Market well beyond what traditional capital expenditure budgets would support.


Restraints Impact Analysis

The restraint percentages below are directional estimates reflecting each factor's dampening effect on the Energy Retrofit Systems Market growth trajectory. These figures are not directly subtracted from the CAGR and serve as qualitative indicators of relative constraint severity [7].

Restraint ~% Impact on CAGR Geographic Relevance Impact Timeline
High upfront capital costs and long payback periods −1.2% Global Short-term (≤2 yr)
Skilled labor shortages in building trades −0.9% North America, Europe Medium-term (2–4 yr)
Split-incentive problem in tenant-landlord relationships −0.7% Global Long-term (≥4 yr)
Disruption to building operations during retrofit work −0.5% Global Short-term (≤2 yr)
Fragmented regulatory standards across jurisdictions −0.4% Global Long-term (≥4 yr)


High Upfront Capital Costs

Despite favorable long-term economics, the initial investment required for comprehensive building retrofits remains a significant barrier across the Energy Retrofit Systems Market. A deep energy retrofit of a mid-size commercial building typically costs USD 25–75 per square foot, with total project costs regularly exceeding USD 1 million for properties over 50,000 square feet [15]. While ESCOs and green financing mechanisms have expanded access, small and mid-size building owners — who collectively own the majority of commercial square footage in most markets — often lack the credit profiles or project scale to qualify for performance-based contracts. The IEA estimates that closing the global building efficiency investment gap requires tripling current annual spending to approximately USD 270 billion by 2030 [1].

Skilled Labor Shortages

Retrofit project throughput is hampered by a severe labor shortage in the building services and construction industries. Industry assessments indicate that in order to meet market demand, the U.S. construction industry must hire between 350,000 and 450,000 net new workers yearly until 2027 [16]. For specialized trades like automated controls engineers, high-performance building envelope installers, and HVAC professionals, this scarcity is especially severe. Similar limitations apply to European markets; in Germany, the number of unfilled energy-technology installation posts has consistently increased year over year, and the gap is growing as federal decarbonization measures pick up speed [14]. The Energy Retrofit Systems Market is unable to turn its large project pipeline into timely, finished installations due to these labor constraints, which essentially create a bottleneck.


Split-Incentive Problem

A misalignment that discourages investment decisions occurs in leased business and multifamily residential properties, when building owners pay for retrofits, but renters benefit from energy savings through reduced utility bills. According to World Bank estimates, more than 40% of commercial floor space worldwide is impacted by this split-incentive issue [15]. Adoption of cost-recovery strategies and green lease terms is still unequal across jurisdictions and property types, despite their emergence as solutions to this obstacle.


Energy Retrofit Systems Market Opportunities

Emerging Market Retrofit Programs

Developing economies across Southeast Asia, Latin America, and sub-Saharan Africa hold vast stocks of energy-inefficient buildings that represent greenfield territory for retrofit service providers. India's Bureau of Energy Efficiency estimated that retrofitting just 30% of the country's existing commercial buildings could yield annual energy savings of over USD 3.5 billion [5]. International development banks, including the World Bank and Asian Development Bank, have committed over USD 12 billion in building efficiency lending facilities through 2030, creating a financing backbone for emerging market expansion of the Energy Retrofit Systems Market.

Digital Twin and AI-Driven Retrofit Optimization

Advanced building analytics platforms that combine digital twin technology with machine learning algorithms can identify optimal retrofit sequences and predict energy savings with greater than 90% accuracy, reducing project risk and compressing sales cycles [12]. Companies that integrate sensor data, utility billing history, and building information modeling (BIM) into automated retrofit specification tools can capture premium margins while scaling project delivery. This technology layer transforms the Energy Retrofit Systems Market from a project-by-project business into a platform-enabled recurring-revenue model.

Net-Zero Whole-Building Retrofit Packages

Regulatory evolution toward operational carbon targets — rather than simple energy efficiency metrics — is creating demand for integrated retrofit packages that combine envelope, mechanical, controls, and on-site renewable generation into single turnkey solutions. The U.S. DOE's Better Buildings Initiative reported that whole-building approaches achieve 40–60% energy reduction compared to 15–25% for single-measure retrofits [9]. Contractors and ESCOs that can deliver multi-measure packages under a single performance guarantee hold a structural competitive advantage.

Data Monetization Through Benchmarking Platforms

Building performance data generated during retrofit projects — including pre- and post-retrofit energy profiles, equipment specifications, and cost benchmarks — carries significant commercial value when aggregated and anonymized. Platforms that compile retrofit outcome data across thousands of projects can sell benchmarking insights to real estate investors, insurers, and municipal planning agencies. This business model creates a new revenue stream adjacent to the physical Energy Retrofit Systems Market.

Electrification of Space and Water Heating

As natural gas phase-out policies accelerate across Europe and coastal North American cities, the mandatory electrification of building heating systems is creating a multi-decade retrofit wave. The IEA projects that global heat pump installations must reach 600 million units by 2030 to align with net-zero pathways, up from approximately 190 million in 2022 [8]. This electrification supercycle represents one of the largest single-technology opportunities within the Energy Retrofit Systems Market over the forecast period.


Energy Retrofit Systems Market Future Outlook

AI-Driven Building Performance Optimization

Artificial intelligence is shifting retrofit decision-making from engineering-estimate models to data-driven optimization. By 2030, the IEA projects that over 40% of commercial buildings in developed economies will use AI-based energy management systems that continuously identify retrofit opportunities, prioritize interventions by ROI, and verify savings post-installation [12]. For the Energy Retrofit Systems Market, this means faster project identification, reduced measurement-and-verification costs, and the emergence of "autonomous retrofit" platforms that can specify and procure upgrade packages with minimal human engineering input.

Electrification Supercycle and Grid-Interactive Buildings

The transition from fossil-fuel heating to electric heat pumps represents a structural transformation that will drive retrofit volumes for at least two decades. The IEA estimates that 1.8 billion heat pumps must be installed globally by 2050 to meet Paris Agreement targets, with the majority replacing existing gas and oil boilers in retrofit applications [8]. Beyond simple fuel switching, grid-interactive efficient buildings (GEBs) that can modulate their energy consumption in response to grid signals represent the next evolution of the Energy Retrofit Systems Market — turning individual building retrofits into grid-scale demand flexibility assets.

ESG Reporting and Green Building Certification Pressure

Mandatory climate-related financial disclosures — including the EU's Corporate Sustainability Reporting Directive (CSRD) and the U.S. SEC's climate disclosure rules — are compelling real estate portfolio owners to quantify and reduce building-level emissions [11]. GRESB participation among major real estate investment trusts exceeded 1,800 entities in 2024, and the scoring framework explicitly rewards measured retrofit investments. This transparency regime effectively transforms the Energy Retrofit Systems Market from a facilities-management concern into a board-level capital allocation priority.

Industrialized Retrofit and Prefabrication

Traditional retrofit projects are labor-intensive, disruptive, and difficult to standardize. Industrialized approaches — including prefabricated facade panels, modular mechanical rooms, and factory-integrated window-and-insulation assemblies — can reduce on-site installation time by 50–70% and improve quality consistency [16]. The Energiesprong model pioneered in the Netherlands has demonstrated that net-zero whole-house retrofits can be completed in under 10 working days using prefabricated components, and the approach is scaling to France, the UK, and North America. This industrialization trend will expand the addressable Energy Retrofit Systems Market by making retrofits viable for building categories previously considered too disruptive or costly to upgrade.


Energy Retrofit Systems Market Segmentation

By Technology

Segment Key Metric Primary Demand Driver
HVAC Systems 36% share (2025) Heat pump adoption mandates
Building Envelope CAGR 8.4% Insulation standards tightening
Lighting Systems USD 12.8 B (2025) LED conversion cycles
Building Automation & Controls CAGR 9.1% Smart building integration
Renewable Energy Integration 8% share (2025) On-site solar + storage mandates


HVAC system retrofits represent the largest technology segment in the Energy Retrofit Systems Market, reflecting the global urgency to decarbonize space heating and cooling. Heat pump installations across Europe grew by over 38% in 2023 compared to 2022, driven by gas price volatility and national subsidy programs [8]. Commercial rooftop unit replacements and variable refrigerant flow (VRF) system installations dominate the North American segment, where aging equipment reaching end-of-life creates natural replacement cycles that building owners increasingly use as opportunities for efficiency upgrades rather than like-for-like substitutions.

Building automation and controls is the fastest-growing technology segment, propelled by declining sensor costs and cloud-based analytics platforms that enable real-time energy optimization. Advanced building management systems can reduce HVAC energy consumption by 15–30% through automated scheduling, fault detection, and demand-controlled ventilation, often delivering payback periods under two years in commercial applications [12].

By Application

Segment Key Metric Primary Demand Driver
Commercial Buildings 42% share (2025) Compliance mandates, ESG pressure
Residential Buildings CAGR 7.8% Consumer rebates, electrification
Industrial Facilities USD 11.4 B (2025) ISO 50001, energy cost reduction
Institutional Buildings CAGR 7.1% Government ESPC contracts


Commercial buildings dominate the Energy Retrofit Systems Market by application, driven by a convergence of regulatory mandates, ESG reporting requirements, and favorable project economics at scale. Office buildings, retail centers, and hotels typically offer the largest energy savings potential per dollar invested, with deep retrofits routinely achieving 30–50% energy reduction [1]. Performance-based contracting through ESCOs has made commercial retrofits accessible even to owners with limited capital budgets, and municipal building performance standards in cities like New York, Boston, and Washington, D.C. are converting voluntary upgrades into compliance requirements.

Residential retrofit activity is accelerating as government rebate programs lower consumer cost barriers. The U.S. Home Energy Rebates program provides up to USD 8,000 per household for heat pump installations and up to USD 1,600 for insulation upgrades, with income-based bonuses increasing total available incentives for qualifying households [2].

By End User

Segment Key Metric Primary Demand Driver
Building Owners/Operators 48% share (2025) Direct energy cost savings
ESCOs CAGR 8.6% Performance contracting expansion
Government Agencies USD 9.8 B (2025) Federal ESPC mandates
Real Estate Developers CAGR 6.9% Green certification premiums


Building owners and operators account for the largest end-user share of the Energy Retrofit Systems Market, as they bear direct exposure to rising energy costs and regulatory compliance obligations. Large portfolio owners — including REITs and institutional investors — are increasingly treating retrofit spending as a value-creation strategy rather than a maintenance expense, driven by evidence that energy-efficient buildings command 6–14% rental premiums and 10–25% sale-price premiums over comparable unretrofitted properties [11].


Regional Market Share Analysis

Region Key Metric Primary Investment Themes
North America 34% share (2025) IRA incentives, LL97 compliance, utility DSM programs
Europe 30% share (2025) Renovation Wave, EPBD mandates, heat pump transition
Asia-Pacific CAGR 8.9% (2026–2035) Urban building boom, energy code tightening, industrial upgrades
South America USD 4.9 B (2025) Green financing facilities, commercial building modernization
Middle East & Africa CAGR 7.8% (2026–2035) Cooling efficiency, district energy, government building programs
Total USD 81.4 B (2025)

The Energy Retrofit Systems Market exhibits distinct regional dynamics shaped by building stock age, regulatory frameworks, energy pricing structures, and climate conditions. North America and Europe together account for roughly 64% of global revenue, reflecting mature regulatory environments and established ESCO industries, while Asia-Pacific is closing the gap rapidly.


North America

Country Key Metric Key Driver
United States 82% of regional revenue IRA rebates, state building performance standards
Canada CAGR 7.6% Greener Homes Grant, carbon pricing escalation
Mexico USD 1.1 B (2025) CONUEE commercial building programs


The United States dominates the North American Energy Retrofit Systems Market, driven by a layered incentive structure combining federal IRA tax credits with state and utility programs. California's Title 24 standards, New York's Local Law 97, and Washington state's Clean Buildings Performance Standard collectively cover over 1.2 billion square feet of commercial space under mandatory performance requirements [2][13]. Canada's federal carbon price, scheduled to reach CAD 170 per tonne by 2030, is making fossil-fuel heating systems increasingly uneconomic and driving accelerated heat pump adoption across provinces.

Europe

Country Key Metric Key Driver
Germany 26% of regional share KfW renovation subsidies, Gebäudeenergiegesetz
France CAGR 7.5% MaPrimeRénov' program, décret tertiaire
United Kingdom USD 4.2 B (2025) Social Housing Decarbonisation Fund, Boiler Upgrade Scheme
Rest of Europe 34% of regional share EU Renovation Wave, national transposition of EPBD


Europe's Energy Retrofit Systems Market benefits from the strongest regulatory framework globally. The EPBD recast mandates zero-emission buildings for new construction by 2030 and requires member states to establish national renovation trajectories targeting the worst-performing building segments [3][6]. Germany alone disbursed over EUR 14 billion in renovation subsidies through KfW in 2023, while France's MaPrimeRénov' program processed over 700,000 household applications in the same year [14]. The UK's commitment to phase out new gas boiler installations by 2035 is creating a structural demand shift toward heat pump retrofits across its 28 million residential dwellings.

Asia-Pacific

Country Key Metric Key Driver
China 44% of regional revenue 14th Five-Year Plan building efficiency targets
Japan CAGR 8.2% Energy Conservation Act revisions, ZEB standards
India USD 2.8 B (2025) ECBC updates, PAT scheme for commercial buildings
South Korea CAGR 7.9% Green New Deal, Building Retrofit Roadmap 2050
Rest of Asia-Pacific 18% of regional share ASEAN building codes, ADB financing facilities


Asia-Pacific represents the fastest-growing region in the Energy Retrofit Systems Market, driven by a combination of rapid urbanization, tightening energy codes, and government-backed financing programs. China's 14th Five-Year Plan set explicit targets for green building retrofits covering over 350 million square meters of existing public buildings by 2025 [10]. Japan's ZEB (Zero Energy Building) roadmap targets net-zero energy performance for all new commercial buildings by 2030, with existing building retrofit subsidies through METI supporting the transition pathway. India's updated Energy Conservation Building Code mandates minimum performance standards for commercial buildings exceeding 500 kW of connected load [5].

South America

Country Key Metric Key Driver
Brazil 52% of regional share PROCEL program, commercial building efficiency mandates
Chile CAGR 8.1% National Energy Efficiency Plan, retrofit financing
Rest of South America USD 1.7 B (2025) IDB Green Building programs


South America's Energy Retrofit Systems Market remains relatively nascent but is gaining momentum through multilateral development bank programs and national energy efficiency strategies. Brazil's PROCEL program has expanded its commercial building labeling scheme, driving retrofit demand among property owners seeking A-class energy ratings to attract premium tenants [17]. Chilean government programs provide subsidized energy audits and co-financing for commercial and public building retrofits, with particular emphasis on lighting and HVAC system upgrades.

Middle East & Africa

Country Key Metric Key Driver
UAE 38% of regional revenue Dubai Green Building Code, Estidama Pearl Rating
Saudi Arabia CAGR 8.5% Vision 2030, SEEC programs
Rest of MEA USD 1.8 B (2025) AfDB financing, government building programs


Extreme cooling loads and subsidized energy pricing create a distinctive retrofit dynamic in the Middle East, where air conditioning can represent over 60% of building energy consumption. The UAE's Demand Side Management Strategy targets a 30% reduction in energy and water demand by 2030, with building retrofits serving as the primary delivery mechanism [18]. Saudi Arabia's SEEC (Saudi Energy Efficiency Center) has implemented mandatory energy performance standards for government and commercial buildings, creating a wave of HVAC efficiency upgrades that is reshaping the regional Energy Retrofit Systems Market.


Energy Retrofit Systems Market By Region, 2025-2035

Competitive Benchmarking

The Energy Retrofit Systems Market is moderately fragmented, with an estimated Herfindahl-Hirschman Index (HHI) below 600 and the top five players collectively holding approximately 22–28% of global revenue. The competitive field spans multinational building technology conglomerates, specialized ESCOs, large engineering-procurement-construction firms, and regional contractors. Scale advantages accrue primarily through technology portfolios, project financing capabilities, and installed-base relationships rather than manufacturing capacity.

Company Est. Revenue Share Range Key Offerings for Energy Retrofit Systems Market Strategic Positioning
Johnson Controls ~5–7% OpenBlue platform, HVAC systems, building controls Integrated controls + services
Honeywell ~4–6% Forge platform, energy management, BMS Technology-led solutions
Siemens ~4–6% Desigo CC, building automation, smart infrastructure Digital twin integration
Schneider Electric ~3–5% EcoStruxure, energy management, microgrid systems Software-centric portfolio
Trane Technologies ~3–5% HVAC systems, Trane Intelligent Services Climate-focused OEM
Ameresco ~2–4% ESPC contracts, distributed energy, federal programs Pure-play ESCO model
Carrier Global ~2–4% HVAC equipment, Abound platform, controls Commercial HVAC focus
Daikin Industries ~2–3% Heat pumps, VRF systems, air handling Heat pump technology leader
AECOM ~1–3% Engineering services, building performance consulting Program management scale
Eaton Corporation ~1–2% Electrical systems, lighting controls, power management Electrical infrastructure


Recent News & Developments

  • Johnson Controls (September 2024): Launched the OpenBlue Net Zero Advisor platform, an AI-driven tool that generates building-specific retrofit roadmaps and ROI projections for commercial portfolio owners [Ref: Johnson Controls press release].


  • March 2026: Mitsubishi Heavy Industries Asia Pacific Pte received an award from Singapore's National Environment Agency (NEA). Ltd. received a contract for boiler refurbishment work at the Tuas South Incineration Plant (TSIP) in the Tuas region of western Singapore. The purpose of this upgrade is to extend the facility's operational life and stabilize the stoker-type incinerator's waste processing capacity (Note).


  • In order to improve household and light-commercial energy management, ABB and Samsung Electronics combined ABB's InSite platform with SmartThings in February 2025.
  • ABB made an investment in Toronto-based Edgecom, a generative AI energy management firm, in January 2025. The company's cutting-edge energy management technology, which makes use of artificial intelligence, enables commercial and industrial users to efficiently control and reduce power consumption peaks.


Energy Retrofit Systems Market Report Scope

Parameter Details
Market Scope Global Energy Retrofit Systems Market covering HVAC, building envelope, lighting, controls, and renewable energy integration technologies
Study Period 2021–2035
Historical Period 2021–2024
Base Year 2025
Forecast Period 2026–2035
CAGR (Forecast) 7.3% (2026–2035)
Market Size (2025) USD 81.4 Billion
Market Size (2035) USD 164.3 Billion
Fastest Growing Segment Building Automation & Controls (CAGR 9.1%)
Fastest Growing Region Asia-Pacific (CAGR 8.9%)
Companies Profiled Johnson Controls, Honeywell, Siemens, Schneider Electric, Trane Technologies, Ameresco, Carrier Global, Daikin Industries, AECOM, Eaton Corporation
Valuation Currency USD (Billion)


FAQs

How do performance-based retrofit contracts allocate risk between building owners and ESCOs?
ESCOs guarantee a minimum energy savings level over the contract term (typically 10–20 years), absorbing performance risk and financing the project from projected savings [4]. Building owners pay nothing upfront and share savings according to negotiated split ratios, usually 70–80% owner / 20–30% ESCO.
What measurement and verification protocols ensure retrofit energy savings are accurately tracked?
The International Performance Measurement and Verification Protocol (IPMVP) provides four standardized options ranging from engineering calculations to whole-building metering [9]. Most commercial retrofit contracts specify IPMVP Option C or D, which use utility billing regression analysis adjusted for weather and occupancy variables.
How do building owners prioritize which retrofit measures to implement first?
ASHRAE Level II energy audits rank measures by simple payback period, typically starting with lighting and controls (under two years) before progressing to envelope and HVAC upgrades (three to seven years) [23]. Sequencing maximizes near-term cash flow to fund deeper interventions.
What role do green building certifications play in driving retrofit investment decisions?
LEED, BREEAM, and NABERS certifications create measurable asset-value premiums of 6–14% in rental rates, motivating portfolio owners to invest in qualifying retrofit measures [11]. Certification also satisfies ESG reporting requirements for institutional investors.
How does refrigerant transition regulation affect HVAC retrofit planning?
The Kigali Amendment mandates an 85% phase-down of high-GWP HFCs by 2036, forcing building owners to factor refrigerant availability into equipment replacement timing [8]. Early adopters of low-GWP systems avoid stranded-asset risk and future compliance costs.
What financing mechanisms beyond ESCOs are expanding access to building retrofits?
Commercial Property Assessed Clean Energy (C-PACE) loans attach repayment to the property tax bill rather than the borrower's credit, enabling retrofits on properties with complex ownership structures [15]. Green bonds and on-bill financing programs complement PACE in broadening access.
How do digital building twins improve retrofit project outcomes?
Digital twins simulate retrofit scenarios against real operating data before construction begins, reducing design errors and improving savings prediction accuracy to above 90% [12]. Post-installation, they enable continuous commissioning that sustains performance gains over time.    
Author
Author
Author Profile
Anshula Mandaokar LinkedIn
Team Lead - Research
Anshula Mandaokar holds an academic degree in Chemical Engineering and has been contributing to the field for more than 5 years. She has expertise in Market Research and Business Consulting and serves as a Team Lead for a reputed Market Research firm under the Chemicals and Materials domain spectrum. She has worked on multiple projects, generating explicit results in a quick turnaround time. Her understanding of data interpretation justifies her role as a leader.

Research Approach


Secondary Research

The secondary research process involved comprehensive analysis of regulatory databases, peer-reviewed engineering journals, industry publications, and authoritative energy organizations. Key sources included the US Department of Energy (DOE), International Energy Agency (IEA), US Environmental Protection Agency (EPA), European Commission Directorate-General for Energy (ENER), National Institute of Standards and Technology (NIST), American Society of Heating, Refrigerating and Air-Conditioning Engineers (ASHRAE), US Energy Information Administration (EIA), European Environment Agency (EEA), International Renewable Energy Agency (IRENA), Lawrence Berkeley National Laboratory (LBNL), National Renewable Energy Laboratory (NREL), World Green Building Council (WorldGBC), LEED/U.S. Green Building Council (USGBC), Building Research Establishment (BRE), EU Eurostat Energy Database, UN Framework Convention on Climate Change (UNFCCC), and national energy ministry reports from key markets. These sources were used to collect building energy consumption statistics, carbon emission regulations, energy efficiency standards (ASHRAE 90.1, EPBD), green building certification data, incentive program analysis, and technology adoption trends for envelope retrofit systems, LED retrofit lighting, HVAC retrofit systems, and energy-efficient appliances.

Additional sources included Building Performance Institute (BPI), Residential Energy Services Network (RESNET), American Council for an Energy-Efficient Economy (ACEEE), Alliance to Save Energy, International Performance Measurement and Verification Protocol (IPMVP), Energy Star Program, Database of State Incentives for Renewables & Efficiency (DSIRE), and utility regulatory commission reports. Industry-specific sources comprised Johnson Controls Energy Efficiency Indicators Survey, Siemens Infrastructure & Cities Research, Schneider Electric Sustainability Research Institute, Honeywell Building Technologies Analytics, Trane Technologies Market Intelligence, Carrier Global Market Reports, Lennox International Industry Outlooks, and Philips Signify Lighting Research for product-level insights on envelope retrofits, LED lighting retrofits, HVAC energy retrofits, and appliance upgrades.


Primary Research

In order to gather both qualitative and quantitative insights, supply-side and demand-side stakeholders were interviewed during the primary research process. CEOs, vice presidents of engineering and product development, chief sustainability officers (CSOs), heads of regulatory affairs, and commercial directors from energy service companies (ESCOs), HVAC producers, suppliers of building envelope materials, suppliers of LED lighting solutions, and integrators of building automation systems were examples of supply-side sources. Facility managers, energy managers, sustainability directors, building owners, property developers, architectural engineers, mechanical engineers, procurement leads from commercial real estate firms, government building administrators, healthcare facility managers, educational institution facility directors, and industrial plant engineers from both residential and non-residential sectors were among the demand-side sources. The market segmentation by product (envelope, LED retrofit lighting, HVAC retrofit, appliances), technology roadmap timelines, and regulatory compliance patterns, energy savings performance contracting models, financing mechanisms (PACE financing, utility rebates, green bonds), and implementation barriers across retrofit project types were all validated by primary research.

Primary Respondent Breakdown:

By Designation: C-level Primaries (28%), Director Level (35%), Others (37%)

By Region: North America (32%), Europe (30%), Asia-Pacific (33%), Rest of World (5%)


Market Size Estimation

Global market valuation was derived through revenue mapping and retrofit project volume analysis. The methodology included:

Identification of 60+ key manufacturers and ESCOs across North America, Europe, Asia-Pacific, and Latin America

Product mapping across envelope energy retrofit systems (insulation, air sealing, window/door upgrades, cool roofs), LED retrofit lighting (fixtures, controls, smart lighting), HVAC energy retrofit systems (chillers, boilers, heat pumps, VRF systems, building automation), and appliances (energy-efficient equipment retrofits)

Analysis of reported and modeled annual revenues specific to energy retrofit product portfolios and energy savings performance contracts (ESPCs)

Coverage of manufacturers and service providers representing 75-80% of global market share in 2024

Extrapolation using bottom-up approach (retrofit project volume × average project value by building type and region) and top-down approach (manufacturer revenue validation and ESCO contract value aggregation) to derive segment-specific valuations for residential and non-residential applications

Data Triangulation: Market estimates were validated through cross-verification of secondary research data, primary interview insights, and analyst estimates of market trends, regulatory impacts, and technology substitution effects in the building energy efficiency sector.

Download Free Sample

Kindly complete the form below to receive a free sample of this Report

Download PDF ×

We do not share your information with anyone. However, we may send you emails based on your report interest from time to time. You may contact us at any time to opt-out.
















