Segmentation Quick Reference
| Dimension | Sub-Segments | Dominant Segment | Fastest Growing Segment |
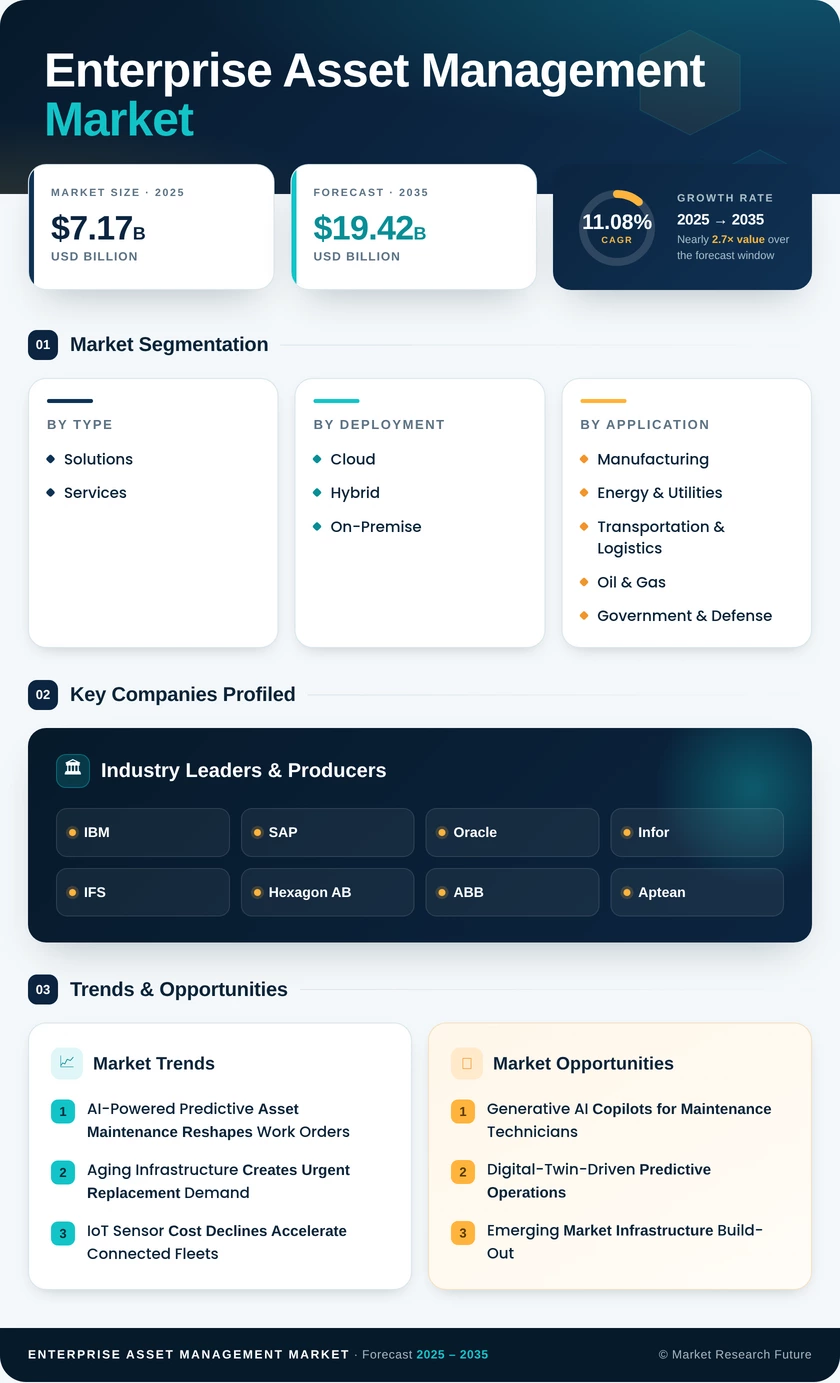
| By Type | Solutions, Services | Solutions | Services |
| By Deployment | Cloud, Hybrid, On-Premise | Cloud | Cloud |
| By End-User Enterprise Size | Large Enterprises, SMEs | Large Enterprises | SMEs |
| By End-User Industry | Manufacturing, Energy & Utilities, Transportation & Logistics, Oil & Gas, Government & Defense, IT & Telecom, Enterprise Asset Management Market, Others | Manufacturing | Enterprise Asset Management Market |
| By Geography | North America, Europe, Asia-Pacific, South America, Middle East & Africa | North America | Asia-Pacific |
Market Segmentation Overview
By Type
| Sub-Segment | Key Trend |
| Solutions | AI module bundling drives higher average contract values; SaaS delivery now exceeds perpetual licensing. |
| Services | Managed-service contracts grow as organizations outsource EAM administration and analytics operations. |
The solutions category remains the revenue backbone, accounting for the majority of Enterprise Asset Management Market spend. Services growth is accelerating as implementation complexity and the need for continuous optimization favor long-term consulting and managed-service engagements.
By Deployment
| Sub-Segment | Key Trend |
| Cloud | Multi-tenant SaaS platforms reduce TCO by 25–35% versus on-premise; API-first architectures simplify IoT integration. |
| Hybrid | Bridges data-sovereignty requirements with cloud analytics; favored by utilities and government agencies |
| On-Premise | Declining share but stable in defense and nuclear sectors, where air-gapped networks are mandatory |
Cloud deployment is the fastest-growing model, enabled by hyperscaler partnerships (AWS, Azure, GCP) that embed EAM workloads within broader enterprise cloud strategies. Hybrid remains a pragmatic middle ground for organizations navigating regulatory transitions.
By End-User Enterprise Size
| Sub-Segment | Key Trend |
| Large Enterprises | Multi-site rollouts with global license agreements; heavy integration with ERP, SCM, and financial systems |
| SMEs | Cloud-first, template-driven deployments with lower customization; rapid adoption driven by IoT sensor cost declines |
Large enterprises set the pace for feature development, but SMEs represent the untapped volume opportunity. Pre-configured industry templates and usage-based pricing are removing historical adoption barriers for smaller organizations.
By End-User Industry
| Sub-Segment | Key Trend |
| Manufacturing | OEE optimization, shop-floor IoT integration, quality compliance automation |
| Energy & Utilities | Grid modernization, renewable asset management, NERC CIP compliance |
| Transportation & Logistics | Fleet lifecycle management, rail safety digitization and port-asset monitoring |
| Oil & Gas | Upstream integrity management, digital oilfield programs, offshore platform safety |
| Government & Defense | Military readiness, public-works stewardship, and interoperability mandates |
| IT & Telecom | Data-center cooling-system management, cell-tower lifecycle tracking |
| Enterprise Asset Management Market | Biomedical equipment compliance, patient-safety asset tracking, JCAHO accreditation |
| Others | Education, hospitality and real estate — emerging adopters with basic asset tracking needs |
Manufacturing and energy remain the two largest verticals by revenue, while healthcare and government & defense exhibit the strongest growth trajectories driven by compliance mandates and modernization funding.