Request Free Sample ×

Kindly complete the form below to receive a free sample of this Report

* Please use a valid business email

Leading companies partner with us for data-driven Insights

clients tt-cursor
Hero Background

Europe Fire Protection Systems Market

ID: MRFR/SEM/55452-HCR
200 Pages
Apoorva Priyadarshi
Last Updated: April 24, 2026
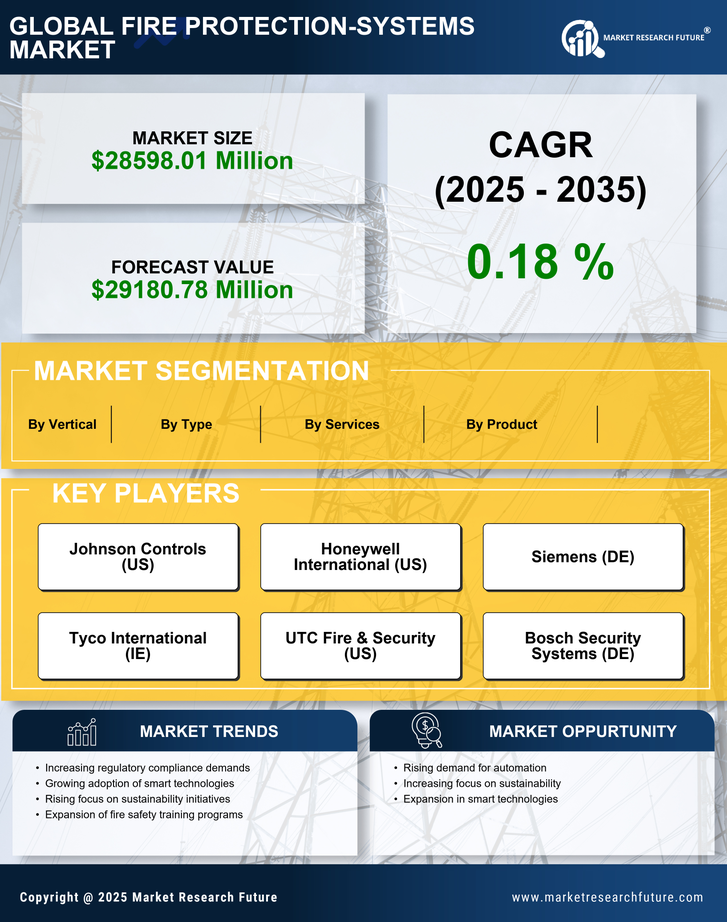
Europe Fire Protection Systems Market Size, Share and Research Report: By Type (Active Fire Protection Systems, Passive Fire Protection Systems), By Product (Fire Suppression, Fire Sprinklers, Fire Detection, Fire Response, Fire Analysis), By Services (Installation and Design Services, Maintenance Services, Managed Services), By Vertical (Commercial, Residential, Manufacturing, Transportation & Logistics, Energy & Power, Government, Oil & Gas, Others) andBy Regional (Germany, UK, France, Russia, Italy, Spain, Rest of Europe)- Industry Forecast Till 2035
Download PDF ×

We do not share your information with anyone. However, we may send you emails based on your report interest from time to time. You may contact us at any time to opt-out.

  1. 1 SECTION I: EXECUTIVE SUMMARY AND KEY HIGHLIGHTS
    1. 1.1 EXECUTIVE SUMMARY
      1. 1.1.1 Market Overview
      2. 1.1.2 Key Findings
      3. 1.1.3 Market Segmentation
      4. 1.1.4 Competitive Landscape
      5. 1.1.5 Challenges and Opportunities
      6. 1.1.6 Future Outlook
  2. 2 SECTION II: SCOPING, METHODOLOGY AND MARKET STRUCTURE
    1. 2.1 MARKET INTRODUCTION
      1. 2.1.1 Definition
      2. 2.1.2 Scope of the study
        1. 2.1.2.1 Research Objective
        2. 2.1.2.2 Assumption
        3. 2.1.2.3 Limitations
    2. 2.2 RESEARCH METHODOLOGY
      1. 2.2.1 Overview
      2. 2.2.2 Data Mining
      3. 2.2.3 Secondary Research
      4. 2.2.4 Primary Research
        1. 2.2.4.1 Primary Interviews and Information Gathering Process
        2. 2.2.4.2 Breakdown of Primary Respondents
      5. 2.2.5 Forecasting Model
      6. 2.2.6 Market Size Estimation
        1. 2.2.6.1 Bottom-Up Approach
        2. 2.2.6.2 Top-Down Approach
      7. 2.2.7 Data Triangulation
      8. 2.2.8 Validation
  3. 3 SECTION III: QUALITATIVE ANALYSIS
    1. 3.1 MARKET DYNAMICS
      1. 3.1.1 Overview
      2. 3.1.2 Drivers
      3. 3.1.3 Restraints
      4. 3.1.4 Opportunities
    2. 3.2 MARKET FACTOR ANALYSIS
      1. 3.2.1 Value chain Analysis
      2. 3.2.2 Porter's Five Forces Analysis
        1. 3.2.2.1 Bargaining Power of Suppliers
        2. 3.2.2.2 Bargaining Power of Buyers
        3. 3.2.2.3 Threat of New Entrants
        4. 3.2.2.4 Threat of Substitutes
        5. 3.2.2.5 Intensity of Rivalry
      3. 3.2.3 COVID-19 Impact Analysis
        1. 3.2.3.1 Market Impact Analysis
        2. 3.2.3.2 Regional Impact
        3. 3.2.3.3 Opportunity and Threat Analysis
  4. 4 SECTION IV: QUANTITATIVE ANALYSIS
    1. 4.1 Semiconductor & Electronics, BY Application (USD Million)
      1. 4.1.1 Fire Detection
      2. 4.1.2 Fire Suppression
      3. 4.1.3 Fire Alarm
      4. 4.1.4 Fire Safety Equipment
      5. 4.1.5 Fire Control Systems
    2. 4.2 Semiconductor & Electronics, BY End Use (USD Million)
      1. 4.2.1 Residential
      2. 4.2.2 Commercial
      3. 4.2.3 Industrial
      4. 4.2.4 Government
      5. 4.2.5 Transportation
    3. 4.3 Semiconductor & Electronics, BY Product Type (USD Million)
      1. 4.3.1 Fire Extinguishers
      2. 4.3.2 Fire Sprinklers
      3. 4.3.3 Fire Hoses
      4. 4.3.4 Fire Blankets
      5. 4.3.5 Fire Detection Systems
    4. 4.4 Semiconductor & Electronics, BY Technology (USD Million)
      1. 4.4.1 Conventional Systems
      2. 4.4.2 Addressable Systems
      3. 4.4.3 Wireless Systems
      4. 4.4.4 Smart Fire Protection Systems
      5. 4.4.5 Integrated Fire Protection Systems
    5. 4.5 Semiconductor & Electronics, BY Service Type (USD Million)
      1. 4.5.1 Installation Services
      2. 4.5.2 Maintenance Services
      3. 4.5.3 Consulting Services
      4. 4.5.4 Training Services
      5. 4.5.5 Inspection Services
  5. 5 SECTION V: COMPETITIVE ANALYSIS
    1. 5.1 Competitive Landscape
      1. 5.1.1 Overview
      2. 5.1.2 Competitive Analysis
      3. 5.1.3 Market share Analysis
      4. 5.1.4 Major Growth Strategy in the Semiconductor & Electronics
      5. 5.1.5 Competitive Benchmarking
      6. 5.1.6 Leading Players in Terms of Number of Developments in the Semiconductor & Electronics
      7. 5.1.7 Key developments and growth strategies
        1. 5.1.7.1 New Product Launch/Service Deployment
        2. 5.1.7.2 Merger & Acquisitions
        3. 5.1.7.3 Joint Ventures
      8. 5.1.8 Major Players Financial Matrix
        1. 5.1.8.1 Sales and Operating Income
        2. 5.1.8.2 Major Players R&D Expenditure. 2023
    2. 5.2 Company Profiles
      1. 5.2.1 Tyco International (IE)
        1. 5.2.1.1 Financial Overview
        2. 5.2.1.2 Products Offered
        3. 5.2.1.3 Key Developments
        4. 5.2.1.4 SWOT Analysis
        5. 5.2.1.5 Key Strategies
      2. 5.2.2 Johnson Controls (IE)
        1. 5.2.2.1 Financial Overview
        2. 5.2.2.2 Products Offered
        3. 5.2.2.3 Key Developments
        4. 5.2.2.4 SWOT Analysis
        5. 5.2.2.5 Key Strategies
      3. 5.2.3 Siemens (DE)
        1. 5.2.3.1 Financial Overview
        2. 5.2.3.2 Products Offered
        3. 5.2.3.3 Key Developments
        4. 5.2.3.4 SWOT Analysis
        5. 5.2.3.5 Key Strategies
      4. 5.2.4 Honeywell (US)
        1. 5.2.4.1 Financial Overview
        2. 5.2.4.2 Products Offered
        3. 5.2.4.3 Key Developments
        4. 5.2.4.4 SWOT Analysis
        5. 5.2.4.5 Key Strategies
      5. 5.2.5 Bosch Security Systems (DE)
        1. 5.2.5.1 Financial Overview
        2. 5.2.5.2 Products Offered
        3. 5.2.5.3 Key Developments
        4. 5.2.5.4 SWOT Analysis
        5. 5.2.5.5 Key Strategies
      6. 5.2.6 Schneider Electric (FR)
        1. 5.2.6.1 Financial Overview
        2. 5.2.6.2 Products Offered
        3. 5.2.6.3 Key Developments
        4. 5.2.6.4 SWOT Analysis
        5. 5.2.6.5 Key Strategies
      7. 5.2.7 UTC Fire & Security (GB)
        1. 5.2.7.1 Financial Overview
        2. 5.2.7.2 Products Offered
        3. 5.2.7.3 Key Developments
        4. 5.2.7.4 SWOT Analysis
        5. 5.2.7.5 Key Strategies
      8. 5.2.8 Eaton Corporation (IE)
        1. 5.2.8.1 Financial Overview
        2. 5.2.8.2 Products Offered
        3. 5.2.8.3 Key Developments
        4. 5.2.8.4 SWOT Analysis
        5. 5.2.8.5 Key Strategies
      9. 5.2.9 Minimax Viking (DE)
        1. 5.2.9.1 Financial Overview
        2. 5.2.9.2 Products Offered
        3. 5.2.9.3 Key Developments
        4. 5.2.9.4 SWOT Analysis
        5. 5.2.9.5 Key Strategies
    3. 5.3 Appendix
      1. 5.3.1 References
      2. 5.3.2 Related Reports
  6. 6 LIST OF FIGURES
    1. 6.1 MARKET SYNOPSIS
    2. 6.2 EUROPE MARKET ANALYSIS BY APPLICATION
    3. 6.3 EUROPE MARKET ANALYSIS BY END USE
    4. 6.4 EUROPE MARKET ANALYSIS BY PRODUCT TYPE
    5. 6.5 EUROPE MARKET ANALYSIS BY TECHNOLOGY
    6. 6.6 EUROPE MARKET ANALYSIS BY SERVICE TYPE
    7. 6.7 KEY BUYING CRITERIA OF SEMICONDUCTOR & ELECTRONICS
    8. 6.8 RESEARCH PROCESS OF MRFR
    9. 6.9 DRO ANALYSIS OF SEMICONDUCTOR & ELECTRONICS
    10. 6.10 DRIVERS IMPACT ANALYSIS: SEMICONDUCTOR & ELECTRONICS
    11. 6.11 RESTRAINTS IMPACT ANALYSIS: SEMICONDUCTOR & ELECTRONICS
    12. 6.12 SUPPLY / VALUE CHAIN: SEMICONDUCTOR & ELECTRONICS
    13. 6.13 SEMICONDUCTOR & ELECTRONICS, BY APPLICATION, 2024 (% SHARE)
    14. 6.14 SEMICONDUCTOR & ELECTRONICS, BY APPLICATION, 2024 TO 2035 (USD Million)
    15. 6.15 SEMICONDUCTOR & ELECTRONICS, BY END USE, 2024 (% SHARE)
    16. 6.16 SEMICONDUCTOR & ELECTRONICS, BY END USE, 2024 TO 2035 (USD Million)
    17. 6.17 SEMICONDUCTOR & ELECTRONICS, BY PRODUCT TYPE, 2024 (% SHARE)
    18. 6.18 SEMICONDUCTOR & ELECTRONICS, BY PRODUCT TYPE, 2024 TO 2035 (USD Million)
    19. 6.19 SEMICONDUCTOR & ELECTRONICS, BY TECHNOLOGY, 2024 (% SHARE)
    20. 6.20 SEMICONDUCTOR & ELECTRONICS, BY TECHNOLOGY, 2024 TO 2035 (USD Million)
    21. 6.21 SEMICONDUCTOR & ELECTRONICS, BY SERVICE TYPE, 2024 (% SHARE)
    22. 6.22 SEMICONDUCTOR & ELECTRONICS, BY SERVICE TYPE, 2024 TO 2035 (USD Million)
    23. 6.23 BENCHMARKING OF MAJOR COMPETITORS
  7. 7 LIST OF TABLES
    1. 7.1 LIST OF ASSUMPTIONS
  8. 7.1.1
    1. 7.2 Europe MARKET SIZE ESTIMATES; FORECAST
      1. 7.2.1 BY APPLICATION, 2026-2035 (USD Million)
      2. 7.2.2 BY END USE, 2026-2035 (USD Million)
      3. 7.2.3 BY PRODUCT TYPE, 2026-2035 (USD Million)
      4. 7.2.4 BY TECHNOLOGY, 2026-2035 (USD Million)
      5. 7.2.5 BY SERVICE TYPE, 2026-2035 (USD Million)
    2. 7.3 PRODUCT LAUNCH/PRODUCT DEVELOPMENT/APPROVAL
  9. 7.3.1
    1. 7.4 ACQUISITION/PARTNERSHIP
  10. 7.4.1

Europe Semiconductor & Electronics Market Segmentation

Semiconductor & Electronics By Application (USD Million, 2022-2035)

  • Fire Detection
  • Fire Suppression
  • Fire Alarm
  • Fire Safety Equipment
  • Fire Control Systems

Semiconductor & Electronics By End Use (USD Million, 2022-2035)

  • Residential
  • Commercial
  • Industrial
  • Government
  • Transportation

Semiconductor & Electronics By Product Type (USD Million, 2022-2035)

  • Fire Extinguishers
  • Fire Sprinklers
  • Fire Hoses
  • Fire Blankets
  • Fire Detection Systems

Semiconductor & Electronics By Technology (USD Million, 2022-2035)

  • Conventional Systems
  • Addressable Systems
  • Wireless Systems
  • Smart Fire Protection Systems
  • Integrated Fire Protection Systems

Semiconductor & Electronics By Service Type (USD Million, 2022-2035)

  • Installation Services
  • Maintenance Services
  • Consulting Services
  • Training Services
  • Inspection Services