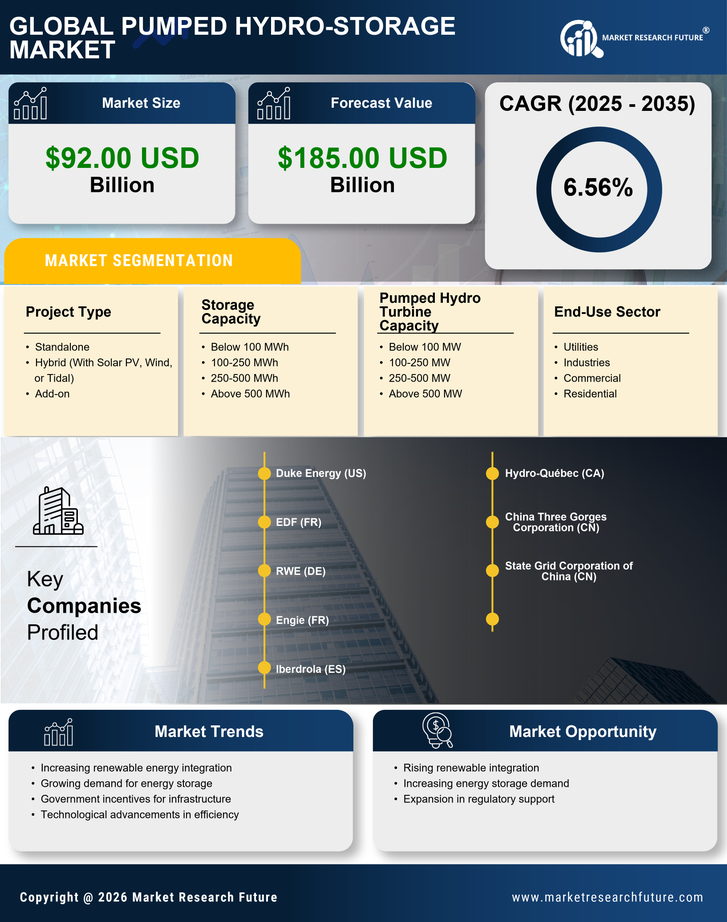
Request Free Sample ×

Kindly complete the form below to receive a free sample of this Report

* Please use a valid business email

Leading companies partner with us for data-driven Insights

clients tt-cursor
Hero Background

Europe Pumped Hydro Storage Market

ID: MRFR/EnP/61749-CR
111 Pages
Chitranshi Jaiswal
Last Updated: May 04, 2026
Europe Pumped Hydro Storage Market Research Report Information by Plant Configuration (Open-Loop Systems, Closed-Loop Systems), by Capacity (Small-Scale Plants, Medium-Scale Plants, Large-Scale Plants), by End Use (Residential, Commercial, Industrial, Utility) and Country (Germany, UK, France, Russia, Italy, Spain, Netherlands, Switzerland, Norway, Rest of Europe) - Forecast till 2035
Download PDF ×

We do not share your information with anyone. However, we may send you emails based on your report interest from time to time. You may contact us at any time to opt-out.

  1. 1 SECTION I: EXECUTIVE SUMMARY AND KEY HIGHLIGHTS
    1. 1.1 EXECUTIVE SUMMARY
      1. 1.1.1 Market Overview
      2. 1.1.2 Key Findings
      3. 1.1.3 Market Segmentation
      4. 1.1.4 Competitive Landscape
      5. 1.1.5 Challenges and Opportunities
      6. 1.1.6 Future Outlook
  2. 2 SECTION II: SCOPING, METHODOLOGY AND MARKET STRUCTURE
    1. 2.1 MARKET INTRODUCTION
      1. 2.1.1 Definition
      2. 2.1.2 Scope of the study
        1. 2.1.2.1 Research Objective
        2. 2.1.2.2 Assumption
        3. 2.1.2.3 Limitations
    2. 2.2 RESEARCH METHODOLOGY
      1. 2.2.1 Overview
      2. 2.2.2 Data Mining
      3. 2.2.3 Secondary Research
      4. 2.2.4 Primary Research
        1. 2.2.4.1 Primary Interviews and Information Gathering Process
        2. 2.2.4.2 Breakdown of Primary Respondents
      5. 2.2.5 Forecasting Model
      6. 2.2.6 Market Size Estimation
        1. 2.2.6.1 Bottom-Up Approach
        2. 2.2.6.2 Top-Down Approach
      7. 2.2.7 Data Triangulation
      8. 2.2.8 Validation
  3. 3 SECTION III: QUALITATIVE ANALYSIS
    1. 3.1 MARKET DYNAMICS
      1. 3.1.1 Overview
      2. 3.1.2 Drivers
      3. 3.1.3 Restraints
      4. 3.1.4 Opportunities
    2. 3.2 MARKET FACTOR ANALYSIS
      1. 3.2.1 Value chain Analysis
      2. 3.2.2 Porter's Five Forces Analysis
        1. 3.2.2.1 Bargaining Power of Suppliers
        2. 3.2.2.2 Bargaining Power of Buyers
        3. 3.2.2.3 Threat of New Entrants
        4. 3.2.2.4 Threat of Substitutes
        5. 3.2.2.5 Intensity of Rivalry
      3. 3.2.3 COVID-19 Impact Analysis
        1. 3.2.3.1 Market Impact Analysis
        2. 3.2.3.2 Regional Impact
        3. 3.2.3.3 Opportunity and Threat Analysis
  4. 4 SECTION IV: QUANTITATIVE ANALYSIS
    1. 4.1 Medical Device, BY Storage Capacity (USD Billion)
      1. 4.1.1 Below 100 MWh
      2. 4.1.2 100-250 MWh
      3. 4.1.3 250-500 MWh
      4. 4.1.4 Above 500 MWh
    2. 4.2 Medical Device, BY Pumped Hydro Turbine Capacity (USD Billion)
      1. 4.2.1 Below 100 MW
      2. 4.2.2 100-250 MW
      3. 4.2.3 250-500 MW
      4. 4.2.4 Above 500 MW
    3. 4.3 Medical Device, BY Project Type (USD Billion)
      1. 4.3.1 Standalone
      2. 4.3.2 Hybrid (With Solar PV, Wind, or Tidal)
      3. 4.3.3 Add-on
    4. 4.4 Medical Device, BY End-Use Sector (USD Billion)
      1. 4.4.1 Utilities
      2. 4.4.2 Industries
      3. 4.4.3 Commercial
      4. 4.4.4 Residential
  5. 5 SECTION V: COMPETITIVE ANALYSIS
    1. 5.1 Competitive Landscape
      1. 5.1.1 Overview
      2. 5.1.2 Competitive Analysis
      3. 5.1.3 Market share Analysis
      4. 5.1.4 Major Growth Strategy in the Medical Device
      5. 5.1.5 Competitive Benchmarking
      6. 5.1.6 Leading Players in Terms of Number of Developments in the Medical Device
      7. 5.1.7 Key developments and growth strategies
        1. 5.1.7.1 New Product Launch/Service Deployment
        2. 5.1.7.2 Merger & Acquisitions
        3. 5.1.7.3 Joint Ventures
      8. 5.1.8 Major Players Financial Matrix
        1. 5.1.8.1 Sales and Operating Income
        2. 5.1.8.2 Major Players R&D Expenditure. 2023
    2. 5.2 Company Profiles
      1. 5.2.1 Duke Energy (US)
        1. 5.2.1.1 Financial Overview
        2. 5.2.1.2 Products Offered
        3. 5.2.1.3 Key Developments
        4. 5.2.1.4 SWOT Analysis
        5. 5.2.1.5 Key Strategies
      2. 5.2.2 EDF (FR)
        1. 5.2.2.1 Financial Overview
        2. 5.2.2.2 Products Offered
        3. 5.2.2.3 Key Developments
        4. 5.2.2.4 SWOT Analysis
        5. 5.2.2.5 Key Strategies
      3. 5.2.3 RWE (DE)
        1. 5.2.3.1 Financial Overview
        2. 5.2.3.2 Products Offered
        3. 5.2.3.3 Key Developments
        4. 5.2.3.4 SWOT Analysis
        5. 5.2.3.5 Key Strategies
      4. 5.2.4 Engie (FR)
        1. 5.2.4.1 Financial Overview
        2. 5.2.4.2 Products Offered
        3. 5.2.4.3 Key Developments
        4. 5.2.4.4 SWOT Analysis
        5. 5.2.4.5 Key Strategies
      5. 5.2.5 Iberdrola (ES)
        1. 5.2.5.1 Financial Overview
        2. 5.2.5.2 Products Offered
        3. 5.2.5.3 Key Developments
        4. 5.2.5.4 SWOT Analysis
        5. 5.2.5.5 Key Strategies
      6. 5.2.6 Hydro-Québec (CA)
        1. 5.2.6.1 Financial Overview
        2. 5.2.6.2 Products Offered
        3. 5.2.6.3 Key Developments
        4. 5.2.6.4 SWOT Analysis
        5. 5.2.6.5 Key Strategies
      7. 5.2.7 China Three Gorges Corporation (CN)
        1. 5.2.7.1 Financial Overview
        2. 5.2.7.2 Products Offered
        3. 5.2.7.3 Key Developments
        4. 5.2.7.4 SWOT Analysis
        5. 5.2.7.5 Key Strategies
      8. 5.2.8 State Grid Corporation of China (CN)
        1. 5.2.8.1 Financial Overview
        2. 5.2.8.2 Products Offered
        3. 5.2.8.3 Key Developments
        4. 5.2.8.4 SWOT Analysis
        5. 5.2.8.5 Key Strategies
    3. 5.3 Appendix
      1. 5.3.1 References
      2. 5.3.2 Related Reports
  6. 6 LIST OF FIGURES
    1. 6.1 MARKET SYNOPSIS
    2. 6.2 EUROPE MARKET ANALYSIS BY STORAGE CAPACITY
    3. 6.3 EUROPE MARKET ANALYSIS BY PUMPED HYDRO TURBINE CAPACITY
    4. 6.4 EUROPE MARKET ANALYSIS BY PROJECT TYPE
    5. 6.5 EUROPE MARKET ANALYSIS BY END-USE SECTOR
    6. 6.6 KEY BUYING CRITERIA OF MEDICAL DEVICE
    7. 6.7 RESEARCH PROCESS OF MRFR
    8. 6.8 DRO ANALYSIS OF MEDICAL DEVICE
    9. 6.9 DRIVERS IMPACT ANALYSIS: MEDICAL DEVICE
    10. 6.10 RESTRAINTS IMPACT ANALYSIS: MEDICAL DEVICE
    11. 6.11 SUPPLY / VALUE CHAIN: MEDICAL DEVICE
    12. 6.12 MEDICAL DEVICE, BY STORAGE CAPACITY, 2024 (% SHARE)
    13. 6.13 MEDICAL DEVICE, BY STORAGE CAPACITY, 2024 TO 2035 (USD Billion)
    14. 6.14 MEDICAL DEVICE, BY PUMPED HYDRO TURBINE CAPACITY, 2024 (% SHARE)
    15. 6.15 MEDICAL DEVICE, BY PUMPED HYDRO TURBINE CAPACITY, 2024 TO 2035 (USD Billion)
    16. 6.16 MEDICAL DEVICE, BY PROJECT TYPE, 2024 (% SHARE)
    17. 6.17 MEDICAL DEVICE, BY PROJECT TYPE, 2024 TO 2035 (USD Billion)
    18. 6.18 MEDICAL DEVICE, BY END-USE SECTOR, 2024 (% SHARE)
    19. 6.19 MEDICAL DEVICE, BY END-USE SECTOR, 2024 TO 2035 (USD Billion)
    20. 6.20 BENCHMARKING OF MAJOR COMPETITORS
  7. 7 LIST OF TABLES
    1. 7.1 LIST OF ASSUMPTIONS
  8. 7.1.1
    1. 7.2 Europe MARKET SIZE ESTIMATES; FORECAST
      1. 7.2.1 BY STORAGE CAPACITY, 2025-2035 (USD Billion)
      2. 7.2.2 BY PUMPED HYDRO TURBINE CAPACITY, 2025-2035 (USD Billion)
      3. 7.2.3 BY PROJECT TYPE, 2025-2035 (USD Billion)
      4. 7.2.4 BY END-USE SECTOR, 2025-2035 (USD Billion)
    2. 7.3 PRODUCT LAUNCH/PRODUCT DEVELOPMENT/APPROVAL
  9. 7.3.1
    1. 7.4 ACQUISITION/PARTNERSHIP
  10. 7.4.1

Europe Medical Device Market Segmentation

Medical Device By Storage Capacity (USD Billion, 2025-2035)

  • Below 100 MWh
  • 100-250 MWh
  • 250-500 MWh
  • Above 500 MWh

Medical Device By Pumped Hydro Turbine Capacity (USD Billion, 2025-2035)

  • Below 100 MW
  • 100-250 MW
  • 250-500 MW
  • Above 500 MW

Medical Device By Project Type (USD Billion, 2025-2035)

  • Standalone
  • Hybrid (With Solar PV, Wind, or Tidal)
  • Add-on

Medical Device By End-Use Sector (USD Billion, 2025-2035)

  • Utilities
  • Industries
  • Commercial
  • Residential