Europe Renewable Energy Market (2026 - 2035)

Europe Renewable Energy Market Research Report By Technology (Solar Energy, Wind Energy, Hydropower, Bioenergy, Geothermal, Ocean Energy), By End-User (Utilities, Commercial and Industrial, Residential) and By Regional (Europe) - Forecast to 2035
ID: MRFR/EnP/20042-CR
141 Pages
Chitranshi Jaiswal
Last Updated: August 24, 2026
Europe Renewable Energy Market
Market Size
Forecast Period2026-2035
CAGR (2026-2035)7.9%
2025 Market Size1,188 GW
2035 Market Size2,540 GW
Key Players
Vestas Wind Systems
Siemens Energy
Ørsted
Enel Green Power
Iberdrola
EDP Renewables
Opportunities
  • Floating Offshore Wind Commercialization
  • Hybrid Renewable-Plus-Storage Projects
  • Green Hydrogen Production Scale-Up

Europe Renewable Energy Market Summary

The Europe Renewable Energy Market reached an installed capacity of 1,188 GW in 2025 and is projected to grow from 1,282 GW in 2026 to approximately 2,540 GW by 2035, registering a CAGR of 7.9% during the forecast period. This expansion is anchored in the European Commission's binding target of at least 42.5% renewable share in gross final energy consumption by 2030, backed by over EUR 210 billion in public and private investment commitments made between 2022 and 2024 alone [1]. The policy architecture underpinning this trajectory makes the Europe Renewable Energy Market one of the most structurally supported clean energy buildouts globally.

A generational shift is underway across Europe's power sector. Coal-fired plants that once supplied over 25% of the continent's electricity are being decommissioned at an accelerating rate, replaced by utility-scale solar farms, onshore and offshore wind arrays, and increasingly by hybrid installations that pair generation with battery storage. The European Investment Bank committed EUR 36 billion to climate-related projects in 2023 [2], channeling capital directly into the infrastructure displacing legacy thermal assets.

Germany commands the largest share of the Europe Renewable Energy Market, accounting for roughly 24% of total installed capacity thanks to its Energiewende program and aggressive solar rooftop mandates. The Netherlands is the fastest-growing country market with a projected CAGR of 10.2%, driven by offshore wind expansion in the North Sea. Spain holds the second-largest capacity share at approximately 16%, leveraging its solar irradiance advantage and streamlined permitting reforms. By 2035, cumulative capacity additions across Europe are expected to exceed 1,250 GW of new installations.

Key Report Takeaways

• By Technology

  • Solar Energy dominates the Europe Renewable Energy Market with an estimated 38% share of total installed capacity in 2025, driven by distributed rooftop and utility-scale photovoltaic deployment across southern and central Europe.
  • Wind Energy — combining onshore and offshore segments — is the fastest-growing technology at a projected CAGR of 9.4% through 2035, supported by North Sea and Baltic Sea project pipelines.
  • Hydropower retains a stable capacity base of approximately 235 GW, primarily concentrated in Nordic countries and the Alpine region.

• By End-User

  • The Utilities segment accounts for the largest share of the Europe Renewable Energy Market, representing roughly 62% of installed capacity as large-scale generation projects dominate procurement.
  • Commercial and Industrial end-users are expanding at a CAGR of 8.7%, with corporate power purchase agreements driving on-site and near-site installations.

• By Geography

  • Germany leads the Europe Renewable Energy Market with a capacity share of approximately 24%, followed by Spain at 16%.
  • The Netherlands is projected to register the highest country-level CAGR of 10.2% between 2026 and 2035.

Market Size and Forecast (2021–2035)

Market Research Future's sizing methodology integrates bottom-up capacity tracking from national grid operators, IRENA's Renewable Capacity Statistics database, and Eurostat energy balance sheets. Historical figures (2021–2024) reflect actual installed capacity; forecast years (2026–2035) are modeled using a compound growth approach calibrated to policy-driven deployment schedules and grid interconnection timelines [3].
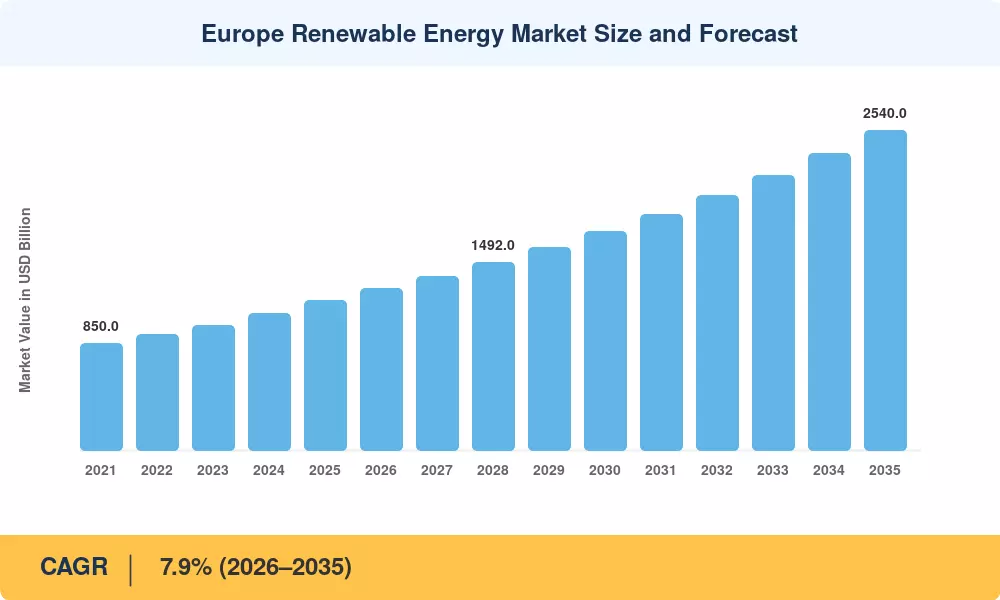

Europe Renewable Energy Market Size and Forecast
Our Impact
Enabled $4.3B Revenue Impact for Fortune 500 and Leading Multinationals
Partnering with 2000+ Global Organizations Each Year
30K+ Citations by Top-Tier Firms in the Industry

Driver Impact Analysis

Driver ~% Impact on CAGR Geographic Relevance Impact Timeline
EU regulatory mandates and RED targets ~22% Pan-European Long-term (≥4 yr)
Offshore wind project pipeline expansion ~18% North Sea, Baltic Medium-term (2–4 yr)
Corporate PPA demand acceleration ~15% Western Europe Short-term (≤2 yr)
Solar module cost deflation ~14% Southern/Central Europe Short-term (≤2 yr)
Grid modernization and interconnection ~12% Pan-European Long-term (≥4 yr)
Electrification of transport and heating ~10% Northern/Western Europe Medium-term (2–4 yr)
Green hydrogen electrolyzer demand ~9% Germany, Netherlands, Denmark Long-term (≥4 yr)


EU Regulatory Mandates and Binding Deployment Targets

The revised Renewable Energy Directive (RED III) raised the EU's 2030 renewable energy target to a minimum of 42.5%, with an aspirational goal of 45% [1]. This legislative anchor compels member states to accelerate permitting, designate renewable acceleration areas, and guarantee grid connection timelines for approved projects. The directive's binding nature — with infringement procedures for non-compliant states — gives the Europe Renewable Energy Market a structural policy floor that few other global markets enjoy. Germany's amended EEG 2023 alone allocates roughly EUR 28 billion in annual feed-in premiums through 2028 [6].

Offshore Wind Pipeline Expansion

Europe's offshore wind installed base is set to more than triple by 2035, with committed lease areas in the North Sea, Baltic Sea, and Atlantic representing over 120 GW of potential capacity [8]. The Esbjerg Declaration (2022) and the Ostend Declaration (2023) collectively pledged 300 GW of offshore wind by 2050 across nine European nations. Near-term, projects like Dogger Bank (UK, 3.6 GW) and Hollandse Kust (Netherlands, 1.5 GW) are pulling capital and supply chain investment into European port infrastructure at unprecedented scale [12].

Corporate PPA Demand Acceleration

Corporate renewable energy procurement surged past 15 GW of contracted volume in Europe during 2024, up from just 3 GW in 2019 [10]. Technology firms, automotive manufacturers, and consumer goods companies are signing 10–15 year fixed-price agreements that de-risk developer financing and accelerate project completion. This demand-side pull reinforces the Europe Renewable Energy Market by creating bankable offtake certainty independent of government subsidy cycles.

Solar Module Cost Deflation

Average crystalline silicon module prices in Europe fell below EUR 0.12 per watt in late 2024, a 40% decline from 2022 peaks [4]. This cost compression has unlocked residential and small-commercial segments that were previously uneconomic without subsidies, adding distributed capacity volumes that augment utility-scale builds.

Restraints Impact Analysis

The restraint impacts below are directional estimates reflecting drag effects on the market's growth trajectory. They do not subtract linearly from the headline CAGR.

Restraint ~% Drag on CAGR Geographic Relevance Impact Timeline
Grid congestion and curtailment ~–20% Germany, Spain, UK Medium-term (2–4 yr)
Permitting delays and local opposition ~–18% France, Italy, Germany Short-term (≤2 yr)
Supply chain bottlenecks (turbines, transformers) ~–16% Pan-European Short-term (≤2 yr)
Rising interest rates and financing costs ~–14% Pan-European Medium-term (2–4 yr)
Land use constraints and biodiversity mandates ~–12% Western/Northern Europe Long-term (≥4 yr)


Grid Congestion and Curtailment

Europe's transmission network was designed for centralized thermal generation, not dispersed renewable input. Germany alone curtailed over 8 TWh of renewable electricity in 2023 due to grid bottlenecks between the wind-rich north and industrial south [9]. Transmission system operators estimate that EUR 580 billion in grid investment is required across the EU by 2030 to accommodate planned capacity additions. Until this infrastructure catches up, curtailment will cap the effective utilization of new installations and dampen developer returns in the Europe Renewable Energy Market.

Permitting Delays and Local Opposition

Average permitting timelines for onshore wind projects in France and Italy still exceed four years, compared to under 18 months in Denmark [15]. Local opposition — driven by visual impact concerns, noise complaints, and biodiversity objections — adds further uncertainty. While the EU's Emergency Regulation (2022) and subsequent RED III provisions attempted to streamline approvals, implementation at the national level remains uneven and is a persistent drag on deployment rates.

Supply Chain Bottlenecks

European wind turbine manufacturers reported order backlogs exceeding 18 months for offshore-grade nacelles as of mid-2024, while high-voltage transformer lead times stretched to 36 months [16]. These supply constraints create project delays that cascade through interconnection schedules and financing milestones across the Europe Renewable Energy Market.

Europe Renewable Energy Market Opportunities

Floating Offshore Wind Commercialization

Floating wind technology opens vast deep-water sites in the Atlantic, Mediterranean, and Norwegian continental shelf that fixed-bottom foundations cannot reach. With over 250 GW of technically exploitable floating potential across Europe, early commercial projects in Portugal, France, and Norway could establish the region as the global technology leader by 2030 [12].

Hybrid Renewable-Plus-Storage Projects

Co-located solar-storage and wind-storage installations are emerging as the dominant project architecture for new capacity tenders across Spain, Italy, and Germany. These hybrid configurations improve grid dispatchability, reduce curtailment, and capture value across intraday price spreads — creating an attractive investment profile for the Europe Renewable Energy Market.

Green Hydrogen Production Scale-Up

Electrolyzer deployment in Europe is projected to reach 17.5 GW by 2030 under the EU Hydrogen Strategy, requiring approximately 40 GW of dedicated renewable generation capacity [14]. This creates a parallel demand channel for solar and wind installations in coastal industrial clusters across Germany, the Netherlands, and Belgium.

Energy-as-a-Service and Digital Platforms

New business models — including virtual power plants, peer-to-peer energy trading, and AI-optimized asset management platforms — are monetizing data from distributed renewable installations. Companies like Sonnen (Shell), Next Kraftwerke (Shell), and Tibber are aggregating residential and C&I assets into tradeable portfolios, offering recurring revenue streams beyond kilowatt-hour generation.

Central and Eastern European Capacity Catch-Up

Poland, Romania, and the Czech Republic collectively hold less than 6% of Europe's installed renewable capacity despite representing over 15% of the continent's electricity demand [3]. EU cohesion funds, the Recovery and Resilience Facility, and declining technology costs are converging to unlock rapid deployment in these underpenetrated markets through 2035.

Country-Level Market Share and Analysis

Country/Region Key Metric Primary Investment Themes
Germany ~24% capacity share Solar rooftop mandates, offshore wind, Energiewende
Spain ~16% capacity share Utility-scale solar, hybrid projects
France CAGR 8.1% (2026–2035) Offshore wind, nuclear-renewable complementarity
Italy ~11% capacity share Agrivoltaics, southern solar corridor
United Kingdom ~14% capacity share Offshore wind leadership, CfD auctions
Netherlands CAGR 10.2% (2026–2035) North Sea offshore wind, electrolyzer demand
Denmark ~4% capacity share Offshore wind hub, energy islands
Sweden CAGR 7.5% (2026–2035) Onshore wind, industrial decarbonization
Rest of Europe ~13% capacity share Poland, Romania, CEE catch-up
**Total** **1,188 GW (2025)**


Germany

Sub-Market Key Metric Key Driver
Solar ~145 GW installed (2025) Rooftop mandates on new buildings
Onshore Wind CAGR 6.8% 2% federal land allocation target
Offshore Wind ~12% of country capacity North Sea/Baltic pipeline
Bioenergy ~52 GW installed Agricultural waste-to-energy programs


Germany's Renewable Energy Sources Act (EEG) amendments target 80% renewable electricity by 2030, requiring annual solar additions of 22 GW and onshore wind additions of 10 GW [6]. The federal government's designation of priority areas and streamlined permitting for wind repowering are critical to meeting these volumes. Germany's position as the dominant country in the Europe Renewable Energy Market reflects both its early-mover advantage and the scale of its industrial electricity demand.

United Kingdom

Sub-Market Key Metric Key Driver
Offshore Wind ~38% of UK capacity Contracts for Difference auctions
Solar CAGR 9.8% Ground-mount and rooftop growth
Onshore Wind ~22% of UK capacity Scotland planning reforms


The UK government's target of 50 GW of offshore wind by 2030 anchors the country's renewable strategy [8]. The Contracts for Difference (CfD) auction mechanism — now in its sixth allocation round — has proven effective at driving down strike prices and guaranteeing investor returns. Scotland's abundant wind resources and reformed planning framework continue to attract significant developer interest.

Spain

Sub-Market Key Metric Key Driver
Solar PV ~52% of national capacity Irradiance advantage, cost parity
Onshore Wind ~28 GW installed Legacy fleet with repowering upside
Hybrid Projects CAGR 12.3% Co-located storage mandates


Spain added a record 8.4 GW of solar PV capacity in 2023, driven by some of the highest solar irradiance levels in Europe and competitive tender pricing below EUR 25/MWh [5]. The country's PNIEC 2030 plan targets 81 GW of wind and solar combined, positioning Spain as the continent's second-largest Europe Renewable Energy Market by installed base.

France, Italy, and Nordic Markets

France is accelerating offshore wind with six major projects totaling 8 GW in development along its Atlantic and Channel coasts [8]. Italy is leveraging agrivoltaic systems — solar panels integrated with agricultural land — to overcome land use constraints and targets 50 GW of solar by 2030. Denmark's energy island project in the North Sea and Sweden's onshore wind buildout for industrial electrification round out the Nordic contribution to the Europe Renewable Energy Market.

Netherlands, Denmark, Sweden, and Rest of Europe

The Netherlands leads Europe in offshore wind ambition relative to its size, targeting 21 GW by 2030 [8]. Poland's first offshore wind projects in the Baltic Sea, coupled with Romania's onshore pipeline, represent the most significant near-term capacity additions in Central and Eastern Europe. These emerging country markets collectively add a growth dimension that supports the broader Europe Renewable Energy Market trajectory through 2035.

Europe Renewable Energy Market Future Outlook

AI-Optimized Grid Management and Forecasting

Artificial intelligence is reshaping how renewable generation integrates with European grids. Machine learning models now forecast wind and solar output with 95%+ accuracy at 24-hour horizons, reducing balancing costs and curtailment [19]. By 2030, autonomous grid management systems using real-time AI optimization are expected to unlock 15–20% more effective renewable utilization across interconnected European networks, directly benefiting the Europe Renewable Energy Market's capacity factor economics.

Electrification Supercycle in Transport and Heating

Europe's ban on new internal combustion engine sales from 2035 and the rapid deployment of heat pumps — over 3 million units installed in 2023 alone — are creating an electricity demand supercycle that requires proportionally larger renewable generation fleets [13]. The IEA projects European electricity demand will grow 35% between 2025 and 2035, with renewables expected to supply virtually all incremental generation [20].

Cross-Border Market Integration and Energy Islands

Denmark's planned energy islands and the North Sea interconnector expansions will transform Europe's renewable energy architecture from a collection of national systems into an integrated continental grid. The planned North Sea Wind Power Hub could concentrate 12 GW of offshore generation on artificial islands, distributing power across multiple countries simultaneously [9]. These infrastructure mega-projects reshape the competitive dynamics of the Europe Renewable Energy Market.

ESG Reporting and Taxonomy-Driven Capital Allocation

The EU Taxonomy and Corporate Sustainability Reporting Directive (CSRD) are channeling institutional capital toward renewable assets. IRENA estimates that annual renewable energy investment in Europe needs to reach USD 170 billion by 2030 to meet climate targets [21]. Listed European utilities with high renewable portfolio shares are already trading at valuation premiums of 15–25% over fossil-weighted peers, reinforcing the financial case for continued capacity buildout.

Europe Renewable Energy Market Segmentation

By Technology

Technology Segment Key Metric Primary Demand Driver
Solar Energy ~38% capacity share Module cost deflation, rooftop mandates
Wind Energy CAGR 9.4% Offshore pipeline, repowering
Hydropower ~235 GW installed (2025) Alpine/Nordic base, pumped storage
Bioenergy ~7% capacity share Agricultural waste, CHP plants
Geothermal CAGR 6.2% District heating in Iceland, Italy
Ocean Energy <1% capacity share Pre-commercial tidal/wave pilots


Solar Energy maintains the largest share of the Europe Renewable Energy Market by installed capacity, reflecting a decade of aggressive cost reductions that brought utility-scale solar LCOE below EUR 30/MWh across most of southern Europe by 2024 [4]. Germany, Spain, and Italy together account for over 60% of the continent's solar base. Distributed rooftop installations, spurred by mandatory solar requirements on new buildings in Germany, France, and Austria, are adding 15–20 GW annually and shifting the deployment mix toward smaller-scale assets.

Wind Energy — comprising both onshore and offshore segments — represents the fastest-growing technology in the Europe Renewable Energy Market. Offshore wind alone is projected to grow from approximately 35 GW in 2025 to over 110 GW by 2035, powered by committed project pipelines in the North Sea, Baltic Sea, and Atlantic [8]. Onshore wind growth, while more mature, is being revitalized by repowering programs that replace aging sub-3 MW turbines with modern 6–7 MW platforms.

By End-User

End-User Segment Key Metric Primary Demand Driver
Utilities ~62% capacity share Large-scale tenders, CfD mechanisms
Commercial and Industrial CAGR 8.7% Corporate PPAs, on-site generation
Residential ~12% capacity share Rooftop solar, feed-in tariffs


The Utilities segment dominates the Europe Renewable Energy Market as national energy companies and independent power producers drive the bulk of capacity additions through competitive auction mechanisms. Ørsted, Iberdrola, and RWE collectively operate or develop over 45 GW of European renewable capacity. The Commercial and Industrial segment is the fastest-growing end-user category, propelled by corporate sustainability commitments and the economic advantage of locking in electricity costs through long-term PPAs in a volatile wholesale market.

Competitive Benchmarking

The Europe Renewable Energy Market exhibits low market concentration, consistent with a fragmented competitive structure. The top five players collectively hold an estimated 18–24% of installed capacity, with the remaining share distributed across hundreds of regional developers, municipal utilities, and independent power producers. The estimated Herfindahl-Hirschman Index (HHI) sits below 400, confirming a competitive and open market.

Company Est. Revenue Share Range Key Offerings Strategic Positioning
Vestas Wind Systems ~4–6% Onshore/offshore wind turbines, service contracts Global wind turbine leader with European manufacturing base
Siemens Energy (Siemens Gamesa) ~3–5% Offshore wind turbines, grid technology Dominant offshore turbine supplier for North Sea projects
Ørsted ~3–5% Offshore wind development, green hydrogen World's largest offshore wind developer
Enel Green Power ~3–4% Solar, wind, geothermal development Vertically integrated Italian multinational
Iberdrola ~3–5% Onshore wind, offshore wind, solar Spanish utility with major UK/European portfolio
EDP Renewables ~2–4% Onshore wind, solar, offshore wind Portuguese developer with Iberian and CEE presence
RWE Renewables ~3–4% Offshore wind, solar, storage German utility pivoting from coal to renewables
Vattenfall ~2–3% Offshore wind, onshore wind, solar Swedish state-owned, North Sea pipeline focus
Statkraft ~2–3% Hydropower, onshore wind, market trading Europe's largest renewable energy generator by volume
TotalEnergies Renewables ~2–3% Solar, offshore wind, battery storage Oil major diversifying into integrated energy
Engie ~2–3% Solar, wind, green hydrogen, storage French multinational with decentralized energy strategy
SSE Renewables ~1–3% Offshore wind, onshore wind, hydro UK/Ireland focused developer with Dogger Bank stake


Recent News & Developments

  • Ørsted (September 2024): Announced final investment decision on the 2.9 GW Hornsea 3 offshore wind project in the UK — Europe's largest single offshore wind farm upon completion — signaling continued commitment to the Europe Renewable Energy Market despite rising capital costs [22].
  • European Commission (November 2023): Adopted the Wind Power Package, introducing measures to accelerate permitting, improve auction design, and strengthen European wind turbine supply chains against rising import competition [15].
  • RWE (March 2024): Completed acquisition of Con Edison Clean Energy Businesses and redirected EUR 15 billion in capital expenditure toward European offshore wind and solar projects through 2030 [23].
  • Iberdrola (June 2024): Commissioned the 476 MW Baltic Eagle offshore wind farm in Germany, its first German offshore project, expanding its European footprint beyond Iberia and the UK [8].
  • Siemens Gamesa (January 2025): Unveiled the SG 14-236 DD offshore wind turbine rated at 15 MW, designed specifically for North Sea conditions and expected to reduce levelized cost of energy by 8% compared to its predecessor [16].
  • Vattenfall (August 2023): Paused development of the 1.4 GW Norfolk Boreas offshore wind project in the UK, citing 40% cost inflation since the CfD was awarded — a high-profile case that prompted the UK government to raise CfD strike prices in subsequent auctions [17].
  • European Investment Bank (February 2024): Approved EUR 4.2 billion in financing for cross-border renewable energy and grid infrastructure projects across six EU member states, reinforcing the bankability of the Europe Renewable Energy Market [2].


Europe Renewable Energy Market Report Scope

Parameter Detail
Market Scope Europe Renewable Energy Market — installed capacity across solar, wind, hydropower, bioenergy, geothermal, and ocean energy
Study Period 2021–2035
CAGR 7.9% (2026–2035)
Base Year Market Size 1,188 GW (2025)
Forecast Endpoint 2,540 GW (2035)
Fastest Growing Technology Wind Energy (CAGR 9.4%)
Fastest Growing Country Netherlands (CAGR 10.2%)
Companies Profiled 12
Valuation Metric Installed Capacity (GW)

FAQs

How do Contracts for Difference (CfD) mechanisms affect renewable project bankability in Europe?
CfDs guarantee a fixed strike price for generated electricity over 15–20 years, insulating developers from wholesale price volatility. This long-term revenue certainty lowers the weighted average cost of capital by 150–250 basis points, directly improving project returns [17].
What permitting bottleneck most delays wind farm commissioning across the Europe Renewable Energy Market?
Environmental impact assessments, particularly those involving avian migration studies, extend permitting by 12–24 months. Despite RED III streamlining provisions, inconsistent national implementation keeps average approval timelines above three years in several member states [15].
How does the Europe Renewable Energy Market address intermittency without baseload alternatives?
Grid operators rely on interconnector capacity, demand-side response programs, and a growing fleet of battery storage assets. By 2030, Europe is expected to deploy over 50 GW of battery storage to smooth renewable output variability [11].
What role do auction price caps play in Europe Renewable Energy Market investment decisions?
Price caps set maximum CfD strike prices that developers can bid. When caps lag behind input cost inflation, projects become uneconomic, as demonstrated by the UK's AR5 round in 2023 where zero offshore wind bids were received [17].
How do repowering programs differ from greenfield wind development in Europe?
Repowering replaces aging turbines on existing permitted sites with larger modern units, bypassing lengthy permitting and grid connection processes. A repowered site can triple output using fewer turbines on proven foundations [8].
What financing structures dominate utility-scale solar procurement across the Europe Renewable Energy Market?
Project finance with non-recourse debt represents approximately 70% of utility-scale solar transactions, supplemented by green bonds and corporate PPA-backed financing. Institutional investors increasingly acquire operational assets through yieldco structures [10].
How do grid connection queues impact new renewable capacity timelines in the Europe Renewable Energy Market?
Connection queues in markets like Spain and Germany exceed five years for new applications. This backlog forces developers to secure grid access early in project development, often before securing full planning consent [9].
Author
Author
Author Profile
Chitranshi Jaiswal LinkedIn
Team Lead - Research
Chitranshi is a Team Leader in the Chemicals & Materials (CnM) and Energy & Power (EnP) domains, with 6+ years of experience in market research. She leads and mentors teams to deliver cross-domain projects that equip clients with actionable insights and growth strategies. She is skilled in market estimation, forecasting, competitive benchmarking, and both primary & secondary research, enabling her to turn complex data into decision-ready insights. An engineer and MBA professional, she combines technical expertise with strategic acumen to solve dynamic market challenges. Chitranshi has successfully managed projects that support market entry, investment planning, and competitive positioning, while building strong client relationships. Certified in Advanced Excel & Power BI she leverages data-driven approaches to ensure accuracy, clarity, and impactful outcomes.
Download Free Sample

Kindly complete the form below to receive a free sample of this Report

* Please use a valid business email

Download PDF ×

We do not share your information with anyone. However, we may send you emails based on your report interest from time to time. You may contact us at any time to opt-out.
















