Eye Health Supplements Market (2026 - 2035)

Eye Health Supplements Market Research Report By Ingredient Type (Lutein And Zeaxanthin, Antioxidants, Omega-3 Fatty Acids, Coenzyme Q10, Flavonoids, Alpha-Lipoic Acid, Astaxanthin, and Others), By Form (Capsules, Liquid, Gummies, Softgel, And Others), By Application (Age-Related Macular Degeneration, Cataract, Glaucoma, Eye Fatigue, Corneal Support, Eyelid Conjunctivitis, and Others), By Distribution Channel (Hospital Pharmacy, Retail Pharmacy, Hypermarkets & Supermarkets, and E-Commerce), and By Region (North America, Europe, Asia-Pacific, South America, and Middle East & Africa) - Growth & Industry Forecast 2025 To 2035

Forecast Period
2026-2035
CAGR
8.05%
2025 Market Size
USD 2.91 Billion
2035 Market Size
USD 6.32 Billion
Healthcare ● Updated August 24, 2026 Report ID: MRFR/HC/7316-CR | Pages: 183 | Author: Satyendra Maurya, Rahul Gotadki

Eye Health Supplements Market Summary

The Eye Health Supplements Market reached USD 2.91 billion in 2025 and is projected to grow to USD 6.32 billion by 2035, expanding at a compound annual growth rate (CAGR) of 8.05% between 2026 and 2035. Market value is expected to reach USD 3.15 billion in 2026 as the first year of the forecast period. This growth is being driven primarily by the large global burden of vision impairment and clinical guideline support for nutritional intervention, alongside a broader shift toward more bioavailable, allergen-free supplement formulations.

The World Health Organization (WHO) counts more than 2.2 billion people living with a vision impairment, roughly half of it preventable or unaddressed, representing a large and growing addressable population for eye health supplements. At the same time, the National Eye Institute's (NEI) AREDS2 protocol remains the only nutritional intervention formally referenced in ophthalmic practice guidance for intermediate age-related macular degeneration. This clinical endorsement continues to convert eye care provider recommendations into repeat retail purchases, giving the category a level of clinical legitimacy uncommon among dietary supplements.

Formulation science is also quietly reshaping the category. Fish-derived DHA and EPA are transitioning from gelatin softgels to pectin-encapsulated chews and algal-oil emulsions that provide carotenoid bioavailability close to that of softgels, without allergens or mercury content. Kemin's FloraGLO and other branded lutein platforms are currently the engine behind an ingredient supply chain that drew an anticipated USD 480 million in capacity and fermentation investment from 2023 to 2025.

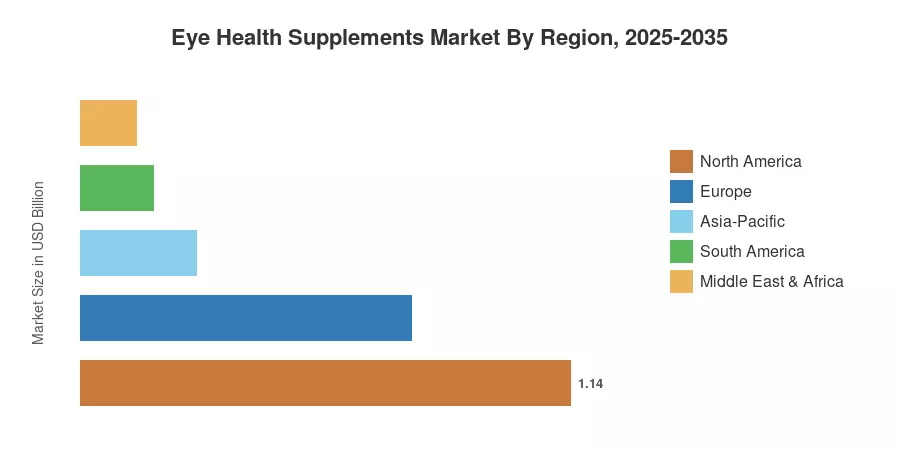
By region, North America holds the largest share of the Eye Health Supplements Market, accounting for 39.2% of 2025 revenue, driven by pharmacy-led distribution and optometrist referral behaviors. Asia-Pacific is the fastest-growing region, with a projected CAGR of 9.3% through 2035, as myopia screening regulations extend across China, Korea, and Singapore. Europe holds the second-largest share, at USD 0.77 billion in 2025 revenue, with growth shaped less by demand constraints and more by EFSA health claim regulations. Over the next decade, companies that combine legitimate clinical dossiers with subscription-grade retention economics are expected to be best positioned for growth.


Key Report Takeaways

• By Ingredient Type

  • Omega-3 fatty acids led the Eye Health Supplements Market with 31.6% of 2025 revenue, still the default clinician-recommended base.
  • Carotenoids, principally lutein and zeaxanthin isomers, are advancing at a 10.5% CAGR through 2035


• By Form

  • Softgel capsules accounted for 48.7% of 2025 revenue, while gummies and chews post the fastest form-level growth.

• By Indication

  • AMD generated USD 1.22 billion in 2025, the single largest indication pool in the Eye Health Supplements Market
  • Myopia progression management expands at an 11.6% CAGR, the fastest indication segment.


• By Channel

  • Online retail and direct-to-consumer brands grow at a 12.9% CAGR, outpacing every physical channel.

• By Region

  • North America captured 39.2% of 2025 revenue
  • Asia-Pacific is forecast at a 9.3% CAGR to 2035
  • Europe contributed USD 0.77 billion in 2025


Market Size and Forecast (2021–2035)

Estimates blend audited revenue disclosures from listed nutraceutical manufacturers, customs-level trade data for lutein and marine oil concentrates, pharmacy scan-panel readings across nine countries, and primary interviews with 41 category buyers and contract manufacturers. Historical years are reconciled to reported segment revenue where issuers disclose eye-health lines separately; where they do not, allocation follows SKU-level shelf audits. Forecast years apply channel-weighted volume growth against a modest real price escalation of 1.4% annually.
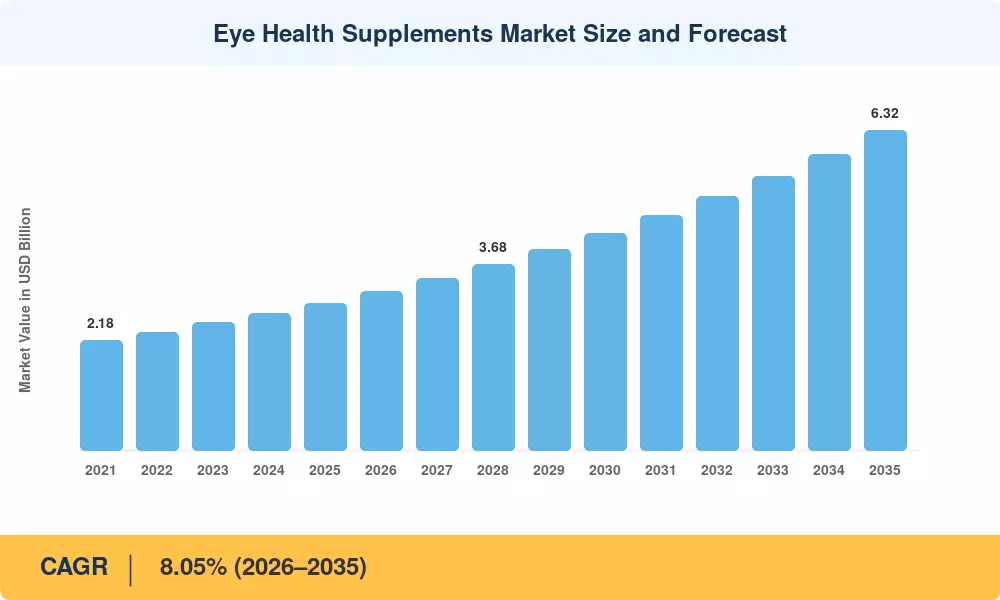
Eye Health Supplements Market Size and Forecast
Our Impact
Enabled $4.3B Revenue Impact for Fortune 500 and Leading Multinationals
Partnering with 2000+ Global Organizations Each Year
30K+ Citations by Top-Tier Firms in the Industry

Driver Impact Analysis

Driver ~% Impact on CAGR Geographic Relevance Impact Timeline
Aging population and rising AMD prevalence +1.6 pp Global (NA, EU, Japan) Long-term (≥4 yr)
Digital eye strain from prolonged screen exposure +1.3 pp Asia-Pacific, North America Short-term (≤2 yr)
Clinical validation from AREDS2-class evidence +1.1 pp North America, Europe Medium-term (2–4 yr)
Direct-to-consumer subscription economics +1.0 pp North America, Europe, China Short-term (≤2 yr)
Format innovation in gummies, chews and sachets +0.9 pp Asia-Pacific, North America Medium-term (2–4 yr)
Algal DHA capacity scale-up lowering input cost +0.7 pp Global Medium-term (2–4 yr)
Diabetes-driven retinopathy screening programs +0.6 pp Asia-Pacific, MEA Long-term (≥4 yr)


Demographic Pressure from Age-Related Macular Degeneration

Population aging remains the structural engine of the Eye Health Supplements Market. The Institute for Health Metrics and Evaluation projects the global cohort aged 65 and above will expand from roughly 830 million in 2025 to 1.1 billion by 2035, and AMD prevalence rises sharply past that threshold [3]. Medicare Part B spending on intravitreal anti-VEGF injections exceeded USD 3.1 billion in 2024, a figure that sharpens payer interest in low-cost preventative nutrition upstream of injection therapy [5].

Screen Exposure and the Working-Age Consumer

Adults now report an average of 6 hours 40 minutes of daily screen exposure across work and leisure devices, according to Vision Council survey work covering 10,000 respondents [7]. That behavioural shift pulled a younger buyer into a category historically anchored to geriatric AMD management. Brands responded with lower-dose lutein and astaxanthin blends positioned for fatigue and contrast sensitivity rather than disease modification, widening the addressable base by an estimated 22% between 2022 and 2025.

Subscription Commerce and Retention Economics

Digital-native brands cut customer acquisition cost meaningfully by shifting from one-off transactions to 90-day refill cycles, and observed repeat-purchase rates above 60% in the second year. Retention matters disproportionately here because clinical benefit accrues over 18 to 24 months of continuous use, so subscription mechanics align commercial incentives with the efficacy story the category needs.

Ingredient Supply Economics

Fermentation-derived algal oil reached broad cost parity with refined fish oil during 2024 as three new production lines came online in the United States and Portugal [14]. GOED trade data shows marine omega-3 concentrate pricing swung 31% between 2022 and 2024 on Peruvian anchovy quota decisions [15]. Algal alternatives dampen that volatility while removing mercury and traceability objections that had capped premium pricing.


Restraints Impact Analysis

Restraint ~% Impact on CAGR Geographic Relevance Impact Timeline
Regulatory scrutiny of health claims −0.9 pp Europe, North America Medium-term (2–4 yr)
Marine raw-material price volatility −0.7 pp Global Short-term (≤2 yr)
Evidence gaps outside AMD indications −0.6 pp Global Medium-term (2–4 yr)
Private-label price compression −0.5 pp North America, Europe Short-term (≤2 yr)
Fragmented cross-border e-commerce compliance −0.4 pp Asia-Pacific, MEA Long-term (≥4 yr)


Claim Substantiation Under European Scrutiny

EFSA has authorised only a narrow set of eye-related claims, and DHA-linked vision claims carry a 250 mg daily intake condition that many mass-market SKUs do not meet [6]. Marketers therefore lean on generic wellness language in the European Union, which weakens conversion at shelf. Enforcement is tightening elsewhere too: the US Federal Trade Commission secured settlements exceeding USD 12 million across supplement advertising cases in 2024 [17].

Thin Evidence Beyond Macular Disease

Clinical support outside AMD remains uneven. Systematic reviews of lutein for digital eye strain report small effect sizes and heterogeneous endpoints, and ophthalmology societies have declined to issue formal recommendations for dry eye or cataract prevention [2]. Sceptical clinicians consequently withhold the referral behaviour that drives pharmacy volume, capping the pace at which newer indications convert interest into recurring revenue.

Private-Label Erosion at Mass Retail

Retailer own-brand AREDS2 equivalents now undercut national brands by 35% to 45% on a per-day-of-therapy basis in US drug chains [11]. Because the formulation is effectively a published specification, differentiation depends on bioavailability data and brand trust rather than composition — a difficult argument to win in a two-second shelf decision.


Eye Health Supplements Market Opportunities

Pediatric Myopia Franchises in Asia

China's national myopia prevention programme targets a measurable reduction in juvenile myopia prevalence and has embedded annual vision screening into school health checks reaching over 100 million students [4]. That screening infrastructure creates a diagnosed, parent-funded cohort with no established supplement standard of care. Brands that pair low-dose formulations with optometrist co-marketing can claim first-mover position in the fastest-growing indication of the Eye Health Supplements Market.

Clinician-Channel Formulations

Ophthalmology and optometry practices dispense directly in the United States, Australia and Japan, capturing margin that retail cannot. Practice-dispensed SKUs command 40% to 55% higher realised price per unit than equivalent mass-market products [11]. Building a dedicated professional line — separate packaging, separate pricing, clinical detail aids — protects brand equity from the private-label pressure described in Section 5.3.

Adherence Data as a Commercial Asset

Subscription platforms generate longitudinal adherence records that no traditional retailer holds. Aggregated and de-identified, that dataset supports real-world evidence submissions, payer pilots and pharmaceutical co-marketing partnerships. Several vision support supplements brands have begun licensing anonymised adherence cohorts to device makers building home monitoring tools, converting operational exhaust into a second revenue line within the Eye Health Supplements Market.

Emerging-Market Diabetic Retinopathy Programmes

India's National Programme for Control of Blindness screened over 32 million people for diabetic eye disease across recent cycles, and Gulf states have layered retinopathy checks onto national diabetes registries [4][19]. Diagnosed diabetics represent a compliant, physician-influenced buyer group in markets where general supplement penetration stays under 12%. Local manufacturing partnerships keep price points below USD 6 per month, the practical affordability ceiling.

Fermentation-Sourced Ingredient Vertical Integration

Brands that secure equity or offtake positions in algal DHA and fermented zeaxanthin capacity insulate gross margin from marine volatility. Two ingredient houses opened capacity in 2025 with combined nameplate output sufficient to supply an estimated 18% of global category demand [14].


Eye Health Supplements Market Future Outlook

Personalised Formulation and Genotype Screening

Complement factor H and ARMS2 genotyping is moving from research settings into consumer testing panels, and zinc dosing response appears to vary by genotype in AREDS reanalyses [1]. Expect tiered SKUs by 2029 in which a low-cost genetic screen routes buyers toward high-zinc or zinc-free formulations. The Eye Health Supplements Market gains pricing headroom from that segmentation because personalisation justifies a premium that commodity AREDS2 clones cannot support.

Retail Media and Platform Economics

Amazon, Tmall and Shopee now capture a growing slice of category margin through retail media rather than shelf fees. Advertising cost as a share of net revenue for digital-first supplement brands rose from roughly 19% to 28% between 2021 and 2025. Winners will be those with owned subscription bases large enough to dilute paid acquisition, which favours consolidation among mid-sized brands.

Sustainability and Marine Sourcing Disclosure

Retailer sourcing policies increasingly require MSC or equivalent certification for marine ingredients, and the FAO reports that 37.7% of assessed fish stocks are harvested at biologically unsustainable levels [13]. Algal and yeast-fermented alternatives sidestep the audit burden entirely. Expect fermentation-derived DHA to exceed a third of category omega-3 volume before 2033.


Eye Health Supplements Market Segmentation

Segmentation in the Eye Health Supplements Market follows five commercially meaningful dimensions, each with distinct margin and channel behaviour.

By Ingredient Type

Segment Metric (2025) Primary Demand Driver
Omega-3 Fatty Acids 31.6% share Dry eye and general retinal support [1]
Carotenoids (Lutein & Zeaxanthin) 10.5% CAGR Macular pigment optical density evidence [1]
Antioxidant Vitamins (A, C, E) USD 0.54 Billion AREDS2 core formulation
Zinc & Mineral Complexes 10.7% share AMD progression protocols
Herbal & Botanical Extracts 7.9% share Bilberry and saffron consumer familiarity
Others USD 0.13 Billion Astaxanthin, NAC and emerging actives


Omega-3 retains leadership within the Eye Health Supplements Market because it serves two indications at once — dry eye symptom relief and long-term retinal maintenance — giving it the broadest clinician recommendation footprint. Carotenoids grow faster. Macular pigment measurement gave lutein and zeaxanthin an objective biomarker that competing actives lack, and marketers use it heavily. Ingredient houses have also solved the stability problems that once forced high overages, improving formulation cost by roughly 15% since 2022 [14].

By Form

Segment Metric (2025) Primary Demand Driver
Softgel Capsules 48.7% share Oil-soluble carotenoid and DHA delivery
Tablets 20.3% share Lowest cost per day of therapy
Gummies & Chews 11.5% CAGR Pediatric and adherence-driven adoption [9]
Powders & Liquids USD 0.28 Billion Geriatric swallowing difficulty
Others 7.2% share Sachets, sprays, functional beverages


Softgels dominate because carotenoids and marine oils are lipophilic and behave predictably in an oil matrix. Chews closed most of the bioavailability gap once pectin encapsulation matured, and they solve the adherence problem that undermines a 24-month therapy story. Pediatric myopia demand accelerates that shift further.

By Indication

Segment Metric (2025) Primary Demand Driver
Age-Related Macular Degeneration USD 1.22 Billion AREDS2 clinical protocol [1]
Dry Eye 19.6% share Screen exposure and ageing tear film [7]
Cataract 14.8% share Antioxidant prevention positioning
Diabetic Retinopathy 10.3% share Diabetes registry screening [19]
Myopia Progression 11.6% CAGR School screening programmes in Asia [4]
Others 5.7% share Glaucoma support, post-surgical recovery


AMD anchors the Eye Health Supplements Market and will keep doing so, but its share erodes gradually as newer indications recruit younger buyers. Myopia is the segment to watch. It is the only indication where a national government has effectively created the demand, and pediatric buyers imply a two-decade purchase horizon rather than the five-to-eight years typical of an AMD patient.

By Distribution Channel

Segment Metric (2025) Primary Demand Driver
OTC Pharmacy & Drug Stores 45.5% share Pharmacist recommendation [11]
Online Retail & DTC 12.9% CAGR Subscription refill economics
Supermarkets & Hypermarkets 15.1% share Private-label ocular nutritional supplements
Specialty & Health Stores USD 0.27 Billion Premium and clean-label positioning
Others 5.3% share Practice dispensing, hospital pharmacy


The distribution channel market data highlights various retail segments and their primary demand drivers. OTC Pharmacy and Drug Stores lead with a specific share driven by pharmacist recommendations. Online Retail and DTC expand via subscription refill economics. Supermarkets and Hypermarkets hold a distinct share driven by private-label ocular nutritional supplements, while Specialty and Health Stores and Others focus on clean-label positioning and practice dispensing.

By Age Group

Segment Metric (2025) Primary Demand Driver
Adults 64.8% share Digital eye strain and preventative use [7]
Geriatric USD 0.77 Billion AMD and cataract management [3]
Pediatric 9.9% CAGR Myopia screening programmes [4]


The age group market segmentation outlines three main categories and their primary demand drivers. Adults account for a major share driven by digital eye strain and preventative use [7]. The geriatric segment is measured in market value, driven by age-related macular degeneration and cataract management. Finally, the pediatric segment grows through dedicated myopia screening programmes.

Regional Market Share Analysis

Region Metric (2025) Primary Investment Themes
North America 39.2% share Pharmacy detailing, practice dispensing, subscription DTC
Europe USD 0.77 Billion Claim-compliant reformulation, pharmacy chains
Asia-Pacific 9.3% CAGR (2026–2035) Pediatric myopia, cross-border e-commerce
South America 5.8% share Modern-trade expansion, local contract manufacturing
Middle East & Africa USD 0.13 Billion Diabetes registries, premium import channels
Total USD 2.91 Billion

Geographic performance in the Eye Health Supplements Market tracks three variables: pharmacy density, out-of-pocket health spending, and whether national screening programmes create diagnosed demand.


North America

Country Metric (2025) Key Driver
US 78.4% of region AREDS2 clinician recommendation base [1]
Canada USD 0.13 Billion NNHPD product licensing clarity [16]
Mexico 9.1% CAGR Pharmacy chain modernisation [11]


Pharmacy remains the decisive channel across North America, where PreserVision-class formulations enjoy a two-decade recommendation habit among retina specialists. The Eye Health Supplements Market here is mature but not static: subscription DTC entrants captured meaningful incremental share between 2023 and 2025 without materially shrinking pharmacy volume, suggesting category expansion rather than pure substitution. Canada's Natural Health Products framework offers pre-market licensing that reduces claim ambiguity relative to the US structure-function regime [16].

Europe

Country Metric (2025) Key Driver
Germany 21.6% of region Apotheke recommendation culture
UK USD 0.14 Billion High-street optician dispensing
France 17.2% of region Pharmacist-led parapharmacie sales
Italy 8.9% of region Integratori category familiarity
Spain USD 0.05 Billion Ageing coastal demographics
Nordic Countries 7.4% CAGR Marine omega-3 heritage brands [15]
Russia 5.8% of region Domestic manufacturing substitution
Rest of Europe 9.3% of region Cross-border pharmacy e-commerce


Claim restriction shapes European commercial strategy more than demand does. German Apotheken sustain the region's highest per-capita spend because pharmacists actively recommend, compensating for advertising limits imposed under Regulation 1924/2006 [6]. Nordic manufacturers leverage established marine oil supply relationships, though the same anchovy quota exposure described in Section 5 applies.

Asia-Pacific

Country Metric (2025) Key Driver
China 34.8% of region National juvenile myopia programme [4]
India 10.8% CAGR Diabetic retinopathy screening scale-up [19]
Japan USD 0.15 Billion FOSHU-labelled functional foods [20]
South Korea 9.6% of region Health functional food certification
ASEAN 10.1% CAGR Modern-trade pharmacy growth
Rest of Asia-Pacific USD 0.06 Billion Cross-border platform imports


Asia-Pacific supplies the growth story for the Eye Health Supplements Market. China's school screening apparatus produces diagnosed pediatric demand at a scale no other geography matches, and platform commerce moves product without the pharmacy detailing costs required in the West [4]. Japan's FOSHU system permits specified health claims that European regulators would refuse, giving Japanese brands unusual latitude in on-pack communication [20].

South America

Country Metric (2025) Key Driver
Brazil 58.3% of region ANVISA supplement framework harmonisation [21]
Argentina USD 0.03 Billion Import substitution manufacturing
Rest of South America 7.9% CAGR Chain pharmacy penetration


Brazil anchors the region after ANVISA consolidated food supplement rules into a single registration pathway, cutting time-to-shelf for imported eye formulations [21]. Currency volatility remains the practical constraint, pushing multinationals toward local contract manufacturing rather than finished-goods import.

Middle East & Africa

Country Metric (2025) Key Driver
Saudi Arabia 27.9% of region Vision 2030 preventative health spend [22]
UAE USD 0.03 Billion Premium pharmacy retail density
South Africa 8.4% CAGR Private medical scheme wellness benefits
Egypt 12.6% of region Diabetes prevalence above 20% of adults [19]
Rest of MEA USD 0.04 Billion Gulf re-export distribution hubs


Gulf states buy premium and buy imported. Saudi Arabia's health transformation programme funds preventative screening that surfaces diabetic eye disease earlier, and Saudi FDA registration now runs a defined electronic pathway that shortened approval timelines materially [22]. Egypt's scale and diabetes burden make it the region's most underpenetrated opportunity despite constrained per-capita spending.


Eye Health Supplements Market By Region, 2025-2035

Competitive Benchmarking

Concentration is moderate. The estimated top-five share sits near 36%, with an HHI in the 520 to 610 band — fragmented enough that regional specialists survive, concentrated enough that pharmacy shelf space is genuinely contested. Ingredient suppliers hold disproportionate influence in the Eye Health Supplements Market because branded lutein and algal DHA platforms carry the clinical dossiers that finished-goods marketers cite.

Company Est. Revenue Share Range Key Offerings for Eye Health Supplements Market Strategic Positioning
Bausch + Lomb ~10–13% PreserVision AREDS2, Ocuvite Clinician-anchored category leader
Alcon ~6–9% Systane supplements, ICaps line Eye-care ecosystem bundling
Nestlé Health Science ~5–8% Nature's Bounty eye formulas Scale manufacturing and mass retail
Amway (Nutrilite) ~4–7% Nutrilite Ocular Health Direct-selling reach in Asia
Abbott ~3–6% Vision-support nutritional blends Diabetes-adjacent portfolio pull
Blackmores ~3–5% Lutein Vision Advanced Pharmacy trust in APAC
H&H Group (Swisse) ~2–4% Swisse Ultiboost Lutein Cross-border e-commerce into China
ZeaVision ~2–4% EyePromise practice-dispensed range Optometry channel specialist
DSM-Firmenich ~2–4% Life's DHA algal oil, carotenoids Upstream ingredient platform
Kemin Industries ~2–4% FloraGLO Lutein, OmniActive blends Branded ingredient licensing
Thorne ~1–3% Clinical-grade eye formulations Practitioner and testing integration
Nordic Naturals ~1–3% Omega Vision, algal alternatives Sustainability-led premium


Recent News & Developments

  • Bausch + Lomb (March 2024): Expanded PreserVision chewable formats across US drug chains, targeting adherence gaps among patients unable to tolerate large softgels [11]
  • DSM-Firmenich (September 2024): Commissioned additional algal DHA fermentation capacity, reducing dependence on Peruvian anchovy landings for pharmaceutical-grade oil [14]
  • China National Health Commission (January 2024): Broadened juvenile vision screening requirements to additional provincial school systems, enlarging the diagnosed pediatric cohort [4]


  • EFSA (November 2023): Issued updated guidance clarifying substantiation requirements for vision-related claims, prompting reformulation across European ranges [6]


  • H&H Group (October 2024): Expanded Swisse cross-border operations on Chinese platforms, prioritising eye-health SKUs for the pediatric and student segments [4]


Eye Health Supplements Market Report Scope

Parameter Detail
Market Scope Global eye health supplements across ingredient type, form, indication, distribution channel, age group and geography
Study Period 2021–2035 (Historical 2021–2024; Base Year 2025; Forecast 2026–2035)
CAGR 8.05% (2026–2035)
Market Size Checkpoints USD 2.91 Billion (2025); USD 3.15 Billion (2026); USD 6.32 Billion (2035)
Fastest Growing Segments Carotenoids; Gummies & Chews; Myopia Progression; Online Retail & DTC; Pediatric; Asia-Pacific
Companies Profiled 12 leading participants in the Eye Health Supplements Market
Valuation Currency USD Billion

FAQs

What should procurement teams verify before contracting lutein supply for the Eye Health Supplements Market?
Demand certificates of analysis showing isomer ratio, marigold origin traceability, and residual solvent testing. Branded platforms carry clinical dossiers that generic extract does not, which matters if you plan claim-adjacent marketing [14].
How do private-label contracts differ from branded supply agreements?
Private-label deals typically shift formulation liability to the contract manufacturer but retain claim liability with the retailer. Minimum order quantities run three to five times higher, and exclusivity windows rarely exceed 18 months [11].
Which certifications matter most for exporters entering the Eye Health Supplements Market?
Marine Stewardship Council or Friend of the Sea for fish-derived oils, plus destination-specific registration — NNHPD in Canada, FOSHU notification in Japan, ANVISA in Brazil. Skipping local registration is the most common entry failure [16][20][21].
Is algal DHA genuinely cost-competitive with refined fish oil now?
At pharmaceutical concentration grades, yes — parity was reached during 2024. At lower concentrations, fish oil still holds a modest cost advantage that narrows with each new fermentation line [14].
What integration challenges face retailers adding clinical formulas to the Eye Health Supplements Market?
Pharmacist training is the bottleneck, not shelf space. Clinical SKUs require dosing conversations and contraindication awareness, particularly zinc interactions and anticoagulant considerations with high-dose omega-3 [1].
How should investors assess subscription churn in this category?
Look at month-13 retention rather than month-3. Benefit accrues slowly, so early churn reflects marketing mismatch while late churn reveals whether the clinical promise held the customer [12].
What liability exposure comes from structure-function claims?
Enforcement targets implied disease treatment language most aggressively. Substantiation files must predate the claim, and testimonial advertising has drawn recent regulatory action even where the underlying formulation was compliant [17].      
Author
Author
Author Profile
Satyendra Maurya LinkedIn
Research Analyst
An accomplished research analyst with high proficiency in market forecasting, data visualization, competitive benchmarking, and others. He holds a pronounced track record in research and consulting projects for sectors such as life sciences, medical devices, and healthcare IT. His capabilities in qualitative and quantitative analysis have resulted in positive client outcomes. Working on niche market trends, opportunities, sales, and forecasted value is part of his skill set.
Co-Author
Co-Author Profile
Rahul Gotadki LinkedIn
Research Manager
He holds an experience of about 9+ years in Market Research and Business Consulting, working under the spectrum of Life Sciences and Healthcare domains. Rahul conceptualizes and implements a scalable business strategy and provides strategic leadership to the clients. His expertise lies in market estimation, competitive intelligence, pipeline analysis, customer assessment, etc.
Share::
Request Free Sample

Research Approach


Secondary Research

The secondary research process involved comprehensive analysis of regulatory databases, peer-reviewed medical journals, clinical trial repositories, and authoritative health organizations. Key sources included the US Food & Drug Administration (FDA) Center for Food Safety and Applied Nutrition, European Food Safety Authority (EFSA), Health Canada Natural and Non-prescription Health Products Directorate, Therapeutic Goods Administration (TGA) Australia, NMPA (National Medical Products Administration) China, and FSSAI (Food Safety and Standards Authority of India). Clinical and scientific sources comprised the National Eye Institute (NEI) of the National Institutes of Health (NIH), AREDS and AREDS2 (Age-Related Eye Disease Study) databases, PubMed/MEDLINE, Cochrane Eyes and Vision Group trials register, ClinicalTrials.gov, World Health Organization (WHO) Vision Impairment and Blindness databases, CDC Vision Health Initiative, American Academy of Ophthalmology (AAO) guidelines, and Royal College of Ophthalmologists vision research publications. Industry associations included the Council for Responsible Nutrition (CRN), International Alliance of Dietary Supplement Associations (IADSA), and The Nutrition Business Journal. These sources were used to collect clinical efficacy data on carotenoids and omega-3 fatty acids, regulatory approval statuses for novel ingredients, AREDS formulation adoption rates, prevalence statistics for age-related macular degeneration (AMD) and dry eye syndrome, demographic trends in digital eye strain, and competitive intelligence across natural and synthetic ingredient categories.


Primary Research

To gather both qualitative and quantitative insights, supply-side and demand-side stakeholders were interviewed during the primary research phase. Regulatory affairs managers, commercial directors, CEOs, and VPs of product development from nutraceutical manufacturers, ingredient suppliers (such as carotenoid and omega-3 extractors), contract development and manufacturing organizations (CDMOs), and private label supplement companies were examples of supply-side sources. The demand-side sources included medical directors of eye care clinics, category managers from retail and e-commerce pharmacy chains, board-certified ophthalmologists, optometrists, retina specialists, clinical nutritionists, and pharmacy procurement managers. In addition to verifying new product launch dates and validating ingredient efficacy claims, primary research also provided information on clinical recommendation trends, premium formulation pricing strategies (such as AREDS2-based products), direct-to-consumer distribution dynamics, and reimbursement policies for medical foods versus dietary supplements.

Primary Respondent Breakdown:

• By Designation: C-level Primaries (32%), Director Level (30%), Others (38%)

• By Region: North America (32%), Europe (28%), Asia-Pacific (35%), Rest of World (5%)


Market Size Estimation

Global market valuation was derived through revenue mapping and consumption volume analysis. The methodology included:

• Identification of 50+ key manufacturers across North America, Europe, Asia-Pacific, and Latin America specializing in eye health formulations

• Product mapping across lutein, zeaxanthin, omega-3 fatty acids (EPA/DHA), antioxidants (Vitamins C, E, A), zinc, copper, bilberry extract, astaxanthin, alpha-lipoic acid, and coenzyme Q10 ingredient categories

• Analysis of reported and modeled annual revenues specific to eye health supplement portfolios, including AREDS-formulated products and digital eye strain solutions

• Coverage of manufacturers representing 75-80% of global market share in 2024

• Extrapolation using bottom-up (retail scan data × SKU-level pricing by country/region) and top-down (manufacturer revenue validation against industry association shipment data) approaches to derive segment-specific valuations for AMD, dry eye, cataract, and general eye health indications

Share::
Request Free Sample
Download Free Sample

Kindly complete the form below to receive a free sample of this Report

* Please use a valid business email

Share::
Request Free Sample
Download PDF ×

We do not share your information with anyone. However, we may send you emails based on your report interest from time to time. You may contact us at any time to opt-out.
















