Eyewear Market (2026 - 2035)

Eyewear Market Size, Share, Industry Trend & Analysis Research Report By Product Type (Spectacles, Sunglasses, Contact Lenses, Other Product Types), By Category (Mass, Premium), By End User (Men, Women, Unisex), By Distribution Channel (Offline Stores, Online Stores) - Forecast to 2035
ID: MRFR/CG/6527-HCR
128 Pages
Pradeep Nandi
Last Updated: July 02, 2026
Eyewear Market
Market Size
Forecast Period2026-2035
CAGR (2026-2035)5.95%
2025 Market SizeUSD 174.15 billion
2035 Market SizeUSD 310.42 billion
Key Players
EssilorLuxottica
Johnson & Johnson Vision
Carl Zeiss AG
Hoya Corporation
CooperVision
Safilo Group
Opportunities
  • Virtual Try-On and AI-Driven Retail Personalization
  • Smart Glasses and Wearable Computing
  • Emerging Market Expansion Through Subsidized Vision Programs

Eyewear Market Summary

The global Eyewear Market reached an estimated USD 174.15 billion in 2025 and is projected to expand from USD 184.51 billion in 2026 to USD 310.42 billion by 2035, registering a CAGR of 5.95% during the forecast period. This growth is anchored in a convergence of clinical need and consumer preference — the World Health Organization estimates that over 2.2 billion people globally live with some form of vision impairment, and national health programs in countries like India (Rashtriya Netra Jyoti Yojana) and China have accelerated subsidized corrective lens distribution [1]. Workplace safety mandates in the EU and North America, which increasingly require protective and screen-optimized eyewear, are adding a regulatory tailwind to an already strong demand base [2].

The eyewear market is witnessing a technology-led change that is changing production and retail. “Advanced polymer and photochromic materials are displacing traditional glass-based lenses, while 3D-printed frames and AI-based virtual try-on platforms are reducing design-to-shelf lead times. EssilorLuxottica also committed over EUR 700 million in R&D in 2024, focused on smart lens integration and individualized vision solutions [3]. The Ray-Ban Meta cooperation highlights the way wearables are blurring the lines between functional eyeglasses and consumer electronics, bringing up brand new revenue sources.


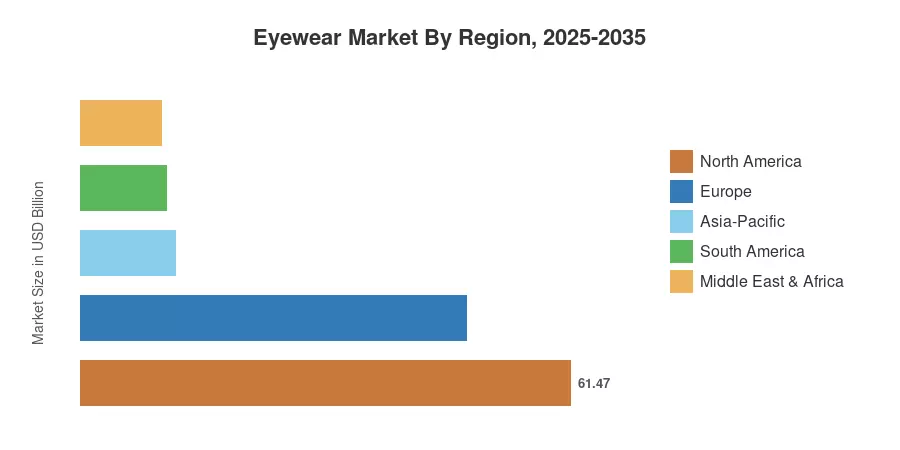
High per-capita spending and insurance-covered vision care are predicted to boost the North American eyewear market at 35.3% in 2025. Asia-Pacific is expected to be the fastest-growing area with a CAGR of around 6.8% till 2035. Factors such as the increasing prevalence of myopia among school age population and the growing organized retail would drive the growth. Europe is the second largest market with a share of roughly 27.8%. The region has a high demand for luxury eyeglasses in countries such as France, Italy and Germany. Digital screen penetration across all demographics continues to grow, providing a decade of stable growth for the Eyewear Market.


Key Report Takeaways

• By Product Type

  • Spectacles accounted for approximately 70.8% of Eyewear Market revenue in 2025, reinforced by rising refractive error diagnoses and aging populations across developed economies.
  • Sunglasses are expected to expand at a CAGR of 7.18% through 2035, driven by UV-awareness campaigns and fashion-driven replacement cycles.

• By Category

  • The mass segment represented around 72.2% of the Eyewear Market in 2025, underpinned by affordable optical chains and government-subsidized vision programs in emerging economies.
  • Premium eyewear is projected to grow at a 6.54% CAGR to 2035 as luxury branding and designer collaborations attract younger consumers.

• By End User

  • Unisex frames captured an estimated 44.5% of Eyewear Market share in 2025, reflecting gender-neutral design trends.
  • Women's eyewear is advancing at a CAGR of 6.29% through 2035, propelled by social media influence and expanding product assortments.

• By Distribution Channel

  • Offline stores represented approximately 77.3% of Eyewear Market sales in 2025, anchored by the need for in-person fitting and prescription verification.
  • Online channels are forecast to post a CAGR of 7.33% to 2035, accelerated by virtual try-on technology and direct-to-consumer brands.

• By Geography

  • North America led the Eyewear Market with a 35.3% revenue share in 2025, backed by robust vision insurance coverage.
  • Asia-Pacific is poised for the fastest expansion, driven by surging myopia prevalence and rising disposable incomes across China, India, and Southeast Asia.


Eyewear Market Size and Forecast (2021–2035)

MRFR’s size technique is a combination of bottom-up and top-down approaches that includes the use of optometry rates, retail sell-through data, and trade statistics cross-validated with top-down macroeconomic factors and company-reported revenues. Historical numbers (2021–2024) are sourced from audited financials and customs data; future values (2026–2035) use a calibrated CAGR with adjustments for projected regulatory and demographic developments.
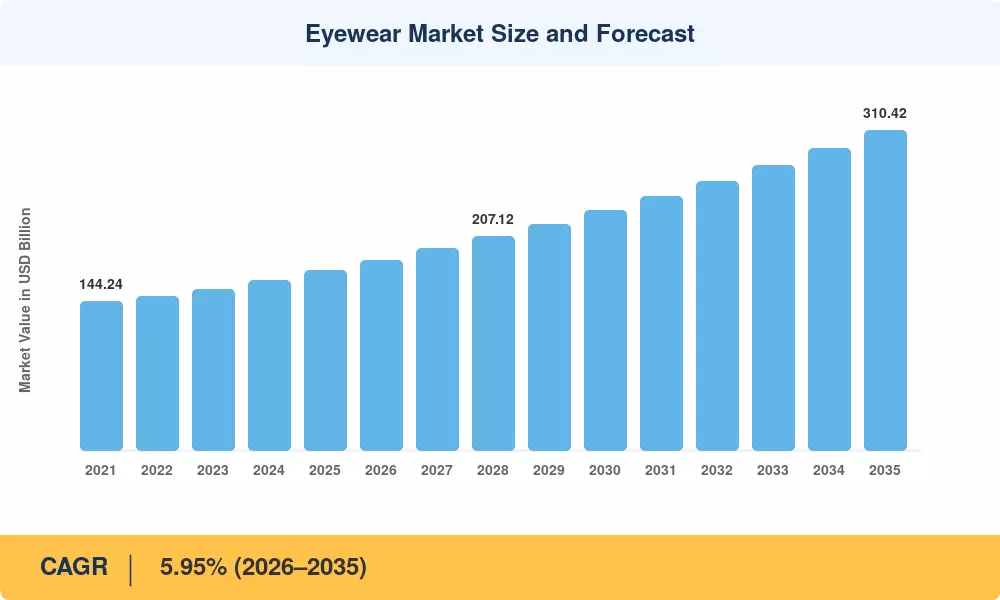
Eyewear Market Size and Forecast
Our Impact
Enabled $4.3B Revenue Impact for Fortune 500 and Leading Multinationals
Partnering with 2000+ Global Organizations Each Year
30K+ Citations by Top-Tier Firms in the Industry

Driver Impact Analysis

Driver ~% Impact on CAGR Geographic Relevance Impact Timeline
Rising prevalence of myopia and refractive errors ~22% Global Long-term (≥4 yr)
Increasing digital screen time and eye strain ~18% Global Short-term (≤2 yr)
Fashion and lifestyle positioning of eyewear ~16% North America, Europe Medium-term (2–4 yr)
Aging global population (presbyopia demand) ~15% Europe, Asia-Pacific Long-term (≥4 yr)
UV protection and outdoor/sports eyewear adoption ~12% Global Medium-term (2–4 yr)
Smart glasses and wearable technology integration ~10% North America, Asia-Pacific Long-term (≥4 yr)
Government vision care subsidies and mandates ~7% Asia-Pacific, South America Medium-term (2–4 yr)


Rising Prevalence of Myopia and Refractive Errors

Myopia alone affects an estimated 2.6 billion people worldwide, and the International Myopia Institute projects that figure could reach 4.8 billion by 2050, which would represent roughly half the global population [1]. In East Asia, myopia rates among teenagers already exceed 80% in countries like South Korea and China, creating a structural floor for corrective lens demand. This epidemiological trend guarantees a baseline consumption of prescription spectacle frames and lenses regardless of economic cycles, making it the single most durable growth driver for the Eyewear Market.

Increasing Digital Screen Time and Eye Strain

The average adult now spends over seven hours per day on digital devices, a figure that jumped 30% between 2019 and 2024 according to DataReportal estimates [6]. Prolonged screen exposure is accelerating demand for screen-optimized lenses, particularly among working-age adults in office environments. Employer wellness programs in the United States and the EU are increasingly covering annual eye examinations and screen-use eyewear, transforming what was once a discretionary purchase into a workplace benefit that broadens the addressable market.

Fashion and Lifestyle Positioning

Eyewear has evolved well beyond clinical utility into a personal style statement. Social media platforms — Instagram, TikTok, and Pinterest — have turned frames into seasonal fashion accessories, and celebrity collaborations routinely sell out limited-edition collections within hours [7]. Luxury houses, including Kering (Gucci Eyewear) and LVMH (Thélios), have brought in-house production to tighten brand control and capture margin that was previously shared with licensees. This premiumization trend is lifting average selling prices across the Eyewear Market, even as unit volumes grow at a more moderate pace.

Aging Global Population

The United Nations projects the population aged 65 and over will double from 761 million in 2021 to 1.6 billion by 2050 [8]. Presbyopia — the age-related loss of near-focus ability — typically manifests after age 40 and creates a progressive lens glasses demand cycle that intensifies with each decade of life. Europe and Japan, where median ages already exceed 44 years, are seeing per-capita eyewear spending climb steadily, and this demographic engine will sustain Eyewear Market growth independent of discretionary consumer sentiment.


Restraints Impact Analysis

Restraint ~% Negative Impact on CAGR Geographic Relevance Impact Timeline
Prevalence of counterfeit eyewear ~-0.6% Asia-Pacific, South America Short-term (≤2 yr)
Refractive surgery alternatives (LASIK, SMILE) ~-0.5% North America, Europe Long-term (≥4 yr)
Price sensitivity in emerging markets ~-0.4% South America, MEA Medium-term (2–4 yr)
Regulatory complexity for medical device classification ~-0.3% Europe Medium-term (2–4 yr)
Supply-chain disruption for specialty lens materials ~-0.2% Global Short-term (≤2 yr)


Prevalence of Counterfeit Eyewear

Counterfeit frames and lenses remain a persistent drag on brand equity and consumer safety, particularly in Southeast Asia, Latin America, and parts of Africa. The OECD estimated that counterfeit goods in the broader fashion sector exceeded USD 500 billion annually in 2023, with eyewear representing a growing sub-category [12]. Fake UV-filtering sunglasses that offer no actual protection can cause retinal damage, eroding consumer trust in the broader sunglass segment and pressuring legitimate brands to invest heavily in anti-counterfeiting measures — costs that compress margins across the Eyewear Market.

Refractive Surgery Alternatives

Laser vision correction procedures such as LASIK and SMILE have reduced procedure costs by approximately 40% over the past decade, making them accessible to middle-income consumers in North America and Europe [13]. While surgical volumes remain a small fraction of the total vision correction population, each successful procedure permanently removes a consumer from the corrective lens market. The American Society of Cataract and Refractive Surgery reported that over 800,000 LASIK procedures were performed in the United States in 2024 alone, representing a meaningful and growing headwind to spectacle demand in mature economies.


Eyewear Market Opportunities

Virtual Try-On and AI-Driven Retail Personalization

Artificial intelligence is reshaping how consumers discover and purchase eyewear. Virtual try-on platforms powered by facial mapping and augmented reality have reduced online return rates by up to 30% in pilot programs, according to retail technology firms [17]. For the Eyewear Market, this technology unlocks digital-first business models that bypass traditional brick-and-mortar costs.

Smart Glasses and Wearable Computing

The convergence of eyewear and consumer electronics represents a multi-billion-dollar whitespace. Meta's collaboration with Ray-Ban has proven that wearable AI can coexist with aesthetic design, and Apple's spatial computing platform is drawing new entrants into the category [10]. By 2030, the smart glasses sub-segment could account for a meaningful share of premium Eyewear Market revenues.

Emerging Market Expansion Through Subsidized Vision Programs

Governments in India, Brazil, and several African nations are expanding public eye-care infrastructure. India's National Programme for Control of Blindness has distributed millions of free spectacles to rural populations, yet penetration remains below 30% of those in need [11]. Organized optical retail chains that partner with government programs can tap a vast unserved market.

Myopia Management and Specialty Pediatric Lenses

Myopia control lenses — including defocus-incorporated multiple segments (DIMS) and peripheral defocus designs — are a rapidly growing category in the Eyewear Market. Clinical trials have demonstrated up to 60% slowing of myopia progression in children, creating a premium-priced, clinically endorsed product niche [18]. Regulatory approvals in the EU, China, and the US are accelerating commercialization.

Subscription and Lens Replacement Models

Direct-to-consumer brands like Warby Parker and Lenskart have popularized subscription models that pair annual frame refreshes with prescription updates. These recurring-revenue models improve customer lifetime value and reduce churn. As insurance integration deepens and telehealth eye exams gain regulatory acceptance, subscription-based Eyewear Market players are well-positioned to capture share from traditional opticians.


Eyewear Market Future Outlook

AI-Powered Personalization and Telehealth Integration

Artificial intelligence will reshape the Eyewear Market value chain from diagnosis through purchase. AI-powered refraction tools are already achieving accuracy comparable to trained optometrists in controlled trials, and regulatory bodies in the US and EU are progressing toward approval of remote prescribing platforms [17]. By 2030, telehealth eye exams could account for 15–20% of new prescriptions in digitally mature markets, compressing the time from diagnosis to purchase and expanding access in underserved areas.

Sustainability and Circular Economy Models

Consumer pressure on environmental performance is intensifying across the Eyewear Market. Bio-acetate frames, recycled ocean-plastic sunglasses, and lens refurbishment programs are moving from niche positioning to mainstream retail. EssilorLuxottica has committed to carbon neutrality across its operations by 2030, and emerging regulations in the EU around extended producer responsibility will likely require eyewear brands to take back and recycle used products [23].

Smart Eyewear Convergence

The next decade will see smart glasses evolve from early-adopter curiosity to a mainstream consumer electronics category within the Eyewear Market. Advances in microLED display technology, edge AI processing, and miniaturized batteries are solving the bulk and battery-life constraints that have historically limited adoption. Industry analysts project that the addressable market for prescription-compatible smart frames could exceed USD 20 billion by 2033 [10].

Premiumization and Direct-to-Consumer Disruption

The tension between premiumization and value disruption will define competitive dynamics in the Eyewear Market through 2035. Luxury conglomerates are vertically integrating to protect margins, while DTC challengers like Warby Parker, Ace & Tate, and Lenskart are proving that technology-enabled supply chains can deliver quality frames at 60–70% below traditional retail prices. The winners will be those who combine brand desirability with operational efficiency.


Eyewear Market Segmentation

By Product Type

Segment Key Metric Primary Demand Driver
Spectacles 70.8% market share (2025) Refractive error prevalence, aging demographics
Sunglasses 7.18% CAGR (2026–2035) UV awareness, fashion positioning
Contact Lenses USD 17.85 billion (2025) Convenience, cosmetic use
Other Product Types 3.2% market share (2025) Safety goggles, sports eyewear


Spectacles remain the revenue backbone of the Eyewear Market, reflecting the sheer scale of the global vision-impaired population. Growth in this segment is steady rather than explosive, sustained by demographic inevitability — more people need corrective lenses each year than leave the category through surgery or natural resolution. Advanced coatings and lens technologies are lifting average selling prices.

Sunglasses represent the highest-growth product category, buoyed by dual demand drivers: health-conscious UV protection and fashion-driven seasonal purchasing. Luxury sunglass brands command price points five to ten times higher than mass alternatives, and limited-edition collaborations create urgency-driven purchasing cycles that traditional optical products rarely achieve.

By Category

Segment Key Metric Primary Demand Driver
Mass 72.2% market share (2025) Affordability, government programs
Premium 6.54% CAGR (2026–2035) Brand aspiration, designer collaborations


The mass segment dominates the Eyewear Market by volume and revenue, driven by affordable optical retail chains and government-subsidized distribution in developing nations. Premium eyewear, while smaller in absolute terms, is growing faster as consumers increasingly view frames as identity accessories. The premiumization wave is strongest among millennials and Gen Z buyers who rotate frames seasonally.

By End User

Segment Key Metric Primary Demand Driver
Unisex 44.5% market share (2025) Gender-neutral design trends
Women 6.29% CAGR (2026–2035) Social media influence, broader SKU assortments
Men USD 44.51 billion (2025) Functional and professional demand


Unisex frames lead the Eyewear Market by share, a reflection of streamlined retail inventory strategies and evolving consumer preferences toward minimalist, gender-neutral aesthetics. Women's eyewear is the fastest-growing end-user segment, driven by celebrity endorsements, influencer marketing, and an expanding range of styles that blend corrective function with fashion appeal.

By Distribution Channel

Segment Key Metric Primary Demand Driver
Offline Stores 77.3% market share (2025) In-person fitting, prescription verification
Online Stores 7.33% CAGR (2026–2035) Virtual try-on, DTC convenience


Offline retail continues to capture the majority of Eyewear Market transactions because purchasing corrective eyewear remains a high-touch experience requiring precise measurements. That said, online channels are closing the gap rapidly. Virtual try-on technology, home trial programs, and streamlined prescription upload workflows have reduced the friction that previously kept consumers in physical stores.


Regional Market Share Analysis

Region Key Metric (2025) Primary Investment Themes
North America 35.3% revenue share Insurance-driven demand, smart eyewear innovation
Europe 27.8% revenue share Luxury frame manufacturing, aging demographics
Asia-Pacific 6.82% CAGR (2026–2035) Myopia epidemic, organized retail expansion
South America USD 10.80 billion Government vision programs, DTC growth
Middle East & Africa USD 10.14 billion Urbanization, medical infrastructure buildout
Total USD 174.15 billion

The Eyewear Market exhibits distinct regional dynamics shaped by demographics, insurance coverage, retail infrastructure, and fashion culture. The table below summarizes regional positioning.


North America

Country Key Metric Key Driver
United States 78.4% of regional share Vision insurance penetration, digital eye strain
Canada 12.6% of regional share Public healthcare-funded eye exams
Mexico 5.12% CAGR Expanding middle class, affordable optical chains


The United States remains the anchor of the North American Eyewear Market, supported by employer-provided vision benefits that cover over 180 million Americans. VSP Vision Care and EyeMed together process hundreds of millions of claims annually, sustaining consistent replacement cycles. Canada's provincial health plans cover routine eye exams for children and seniors, while Mexico's rapidly growing optical retail chains — including Devlyn and Ópticas Lux — are extending affordable access beyond urban centers [19].

Europe

Country Key Metric Key Driver
Germany USD 11.82 billion Fielmann-led retail dominance, statutory health coverage
United Kingdom 5.45% CAGR NHS optical voucher scheme
France 18.2% of regional share Mutuelles insurance, luxury frame heritage
Italy 15.8% of regional share Manufacturing hub (Belluno district), export strength
Spain 4.98% CAGR Tourism-driven sunglass sales
Nordic Countries USD 3.95 billion High per-capita optical spend
Russia 4.25% CAGR Domestic manufacturing push
Rest of Europe USD 5.10 billion Varied regulatory frameworks


Europe's Eyewear Market benefits from deeply embedded optical retail cultures and a concentration of frame manufacturing in Italy's Veneto region. The EU Medical Device Regulation (MDR) 2017/745, which fully took effect in 2024, has tightened compliance requirements for corrective lenses and frames classified as medical devices, raising barriers for low-cost imports and benefiting established European manufacturers [15]. Luxury brands headquartered in France and Italy continue to drive premiumization, with Thélios (LVMH) and Kering Eyewear both expanding production capacity through 2025 [20].

Asia-Pacific

Country Key Metric Key Driver
China 38.5% of regional share Myopia prevalence exceeding 80% among teens
India 7.45% CAGR Government vision programs, Lenskart expansion
Japan USD 8.72 billion Aging population, high-quality lens demand
South Korea 6.90% CAGR K-beauty crossover into eyewear fashion
ASEAN USD 5.18 billion Urbanization and a growing middle class
Rest of Asia-Pacific 4.85% CAGR Infrastructure development


Asia-Pacific represents the most dynamic growth frontier for the Eyewear Market, driven primarily by an unprecedented myopia epidemic among school-age populations and a rapidly expanding middle class. China's government launched a national myopia prevention action plan in 2018, setting targets to reduce prevalence rates — yet the plan simultaneously raised awareness and drove parents to seek corrective solutions earlier, boosting demand. India's Lenskart, valued at over USD 5 billion, has demonstrated how technology-driven omnichannel models can scale rapidly in price-sensitive markets [21].

South America

Country Key Metric Key Driver
Brazil 62.4% of regional share Largest population, expanding optical retail
Argentina 4.72% CAGR Inflation-adjusted pricing strategies
Rest of South America USD 2.15 billion Government subsidized programs


Brazil dominates the South American Eyewear Market through a combination of population scale and a growing, organized optical retail sector. Óticas Carol and Chilli Beans have expanded aggressively across tier-two and tier-three cities. However, currency volatility and inflationary pressures continue to shape pricing strategies across the region, pushing consumers toward mass-segment products [14].

Middle East & Africa

Country Key Metric Key Driver
Saudi Arabia 28.3% of regional share Vision 2030 healthcare investment
UAE 5.68% CAGR Medical tourism, luxury sunglass demand
South Africa USD 1.85 billion Largest Sub-Saharan retail market
Egypt 5.15% CAGR Population growth, urban expansion
Rest of MEA USD 3.42 billion Infrastructure and awareness gaps


The Middle East & Africa Eyewear Market is bifurcated: Gulf Cooperation Council states feature high per-capita spending on premium and luxury frames, while Sub-Saharan Africa faces significant unmet need. Saudi Arabia's Vision 2030 program is funneling billions into healthcare infrastructure, including ophthalmology clinics, while the UAE's positioning as a medical tourism hub draws patients for both corrective and cosmetic eye procedures [22].


Eyewear Market By Region, 2025-2035

Competitive Benchmarking

The Eyewear Market is moderately concentrated, with EssilorLuxottica having an outsized stake following its landmark 2018 merger. The projected HHI index is in the modest range (~ 800-1,200), and the top five players in total account for an estimated 35-42% of global sales. Below this, the industry splits into hundreds of regional manufacturers, specialized lens makers and digitally native DTC brands fighting it out on design, price and distribution innovation.

Company Est. Revenue Share Range Key Offerings for the Eyewear Market Strategic Positioning
EssilorLuxottica ~18–22% Ray-Ban, Oakley, Varilux, Crizal, Oliver Peoples Vertically integrated lens + frame + retail leader
Johnson & Johnson Vision ~5–8% Acuvue contact lenses, myopia management Contact lens innovation, clinical partnerships
Carl Zeiss AG ~4–6% Precision ophthalmic lenses, SmartLife series Premium optics, digital lens technology
Hoya Corporation ~4–6% Progressive lenses, coatings, ophthalmic glass Asia-Pacific manufacturing strength
CooperVision ~3–5% MiSight myopia control, daily disposable lenses Pediatric myopia focus, specialty contacts
Safilo Group ~3–5% Carrera, Polaroid, licensed luxury brands Multi-brand licensed portfolio
Bausch + Lomb ~3–5% Biotrue, SofLens, Ultra contact lenses Broad eye health ecosystem
Marchon Eyewear (VSP Global) ~2–4% Nike Vision, Calvin Klein, Columbia US-centric retail distribution network
Warby Parker ~1–3% Branded frames, Home Try-On, telehealth exams DTC disruptor, omnichannel model
Fielmann Group ~1–3% Affordable frames, own-brand lenses European brick-and-mortar scale leader


Recent News & Developments

  • EssilorLuxottica (June 2026): Expanded its partnership with Meta to launch second-generation Ray-Ban Meta smart glasses featuring improved camera resolution and real-time AI assistant integration, signaling deeper convergence of eyewear and consumer tech [10].


  • Warby Parker (March 2024): Opened its 250th US retail location and introduced an AI-powered virtual vision test pilot program in select states, advancing telehealth-enabled eyewear purchasing [17].


  • Lenskart (February 2025): Lenskart, a manufacturer of prescription glasses and sunglasses, introduced its first smartglasses with Bluetooth audio capabilities in India. The new Phonic smartglasses enable users to listen to music, interact with voice assistants, and make voice calls without the need for separate audio devices, such as headphones or earphones.


Eyewear Market Report Scope

Parameter Detail
Market Scope Global Eyewear Market covering spectacles, sunglasses, contact lenses, and other product types
Study Period 2021–2035
CAGR (Forecast) 5.95% (2026–2035)
Base Year Market Size USD 174.15 billion (2025)
Forecast Endpoint USD 310.42 billion (2035)
Fastest Growing Segment Online distribution channel (7.33% CAGR); Sunglasses by product type (7.18% CAGR)
Companies Profiled 10 (EssilorLuxottica, Johnson & Johnson Vision, Carl Zeiss, Hoya, CooperVision, Safilo, Bausch + Lomb, Marchon, Warby Parker, Fielmann)
Valuation Currency USD billion


FAQs

How does insurance coverage variability across countries affect purchasing behavior in this sector?
Vision insurance penetration ranges from over 65% in the US to below 10% in most developing nations, directly influencing replacement frequency and average selling prices. Markets with strong insurance coverage see 18–24 month replacement cycles versus 36–48 months in uninsured populations [19].
What role does vertical integration play in competitive advantage among top eyewear manufacturers?
Vertically integrated companies control lens production, frame manufacturing, and retail distribution, enabling 15–20% higher gross margins than licensed-only competitors. EssilorLuxottica's ownership of both LensCrafters and Sunglass Hut exemplifies this model [3].
How are telehealth regulations evolving for remote eye examinations and prescriptions?
Over 35 US states now permit some form of telehealth-based vision assessment, though scope-of-practice rules vary significantly. EU regulatory alignment remains fragmented, creating an uneven adoption landscape [17].
What supply-chain risks affect specialty lens material availability?
High-index lens polymers rely on a concentrated supplier base in Japan and Germany. Trade restrictions or production disruptions at key facilities can create 8–12 week lead-time extensions [16].
How do counterfeit enforcement efforts differ between regions?
The EU employs customs seizure protocols under Regulation 608/2013, while enforcement in Southeast Asia relies primarily on brand-initiated litigation. Seizure rates in the EU exceed those of other regions by a factor of three [12].
What is the expected timeline for prescription-compatible smart glasses to reach mass adoption?
Industry roadmaps suggest prescription-integrated smart frames with all-day battery life will reach price parity with premium traditional frames by 2031–2033, at which point mass adoption becomes feasible [10].
How does the shift toward online channels impact independent opticians?
Independent opticians face margin pressure as DTC brands capture price-conscious consumers. Those investing in specialty fitting services and clinical expertise are retaining higher-value customers [17].    
Author
Author
Author Profile
Pradeep Nandi LinkedIn
Senior Research Analyst
I have a bachelor's degree in mechanical engineering and an MBA. I have more than two years of expertise in the retail, food, and beverage, chemical, and material industries, and hence have developed a sound cross-domain expertise. A firm believer in lifelong learning and sharing of knowledge. Having a proclivity for hatching ideas and trying to absorb as much information as possible in a short amount of time. Introducing corporates to the data and insight, which enables them to move from probability to possibility, has been my key areas of interest. 

Research Approach


Secondary Research

The secondary research process involved comprehensive analysis of regulatory databases, industry standards organizations, peer-reviewed medical journals, and authoritative health and trade institutions. Key sources included the US Food & Drug Administration (FDA) Center for Devices and Radiological Health, European Medicines Agency (EMA) Medical Device Regulation (MDR), International Organization for Standardization (ISO 12870 for ophthalmic optics and ISO 18369 for contact lenses), World Health Organization (WHO) World Report on Vision, Centers for Disease Control and Prevention (CDC) Vision Health Initiative, National Eye Institute (NEI/NIH), American National Standards Institute (ANSI Z80 standards), Federal Trade Commission (FTC) Eyeglass and Contact Lens Rule compliance data, and the Vision Council of America. International trade data was gathered from Euromonitor International, Euromed, and national statistics offices of key markets including Germany (Federal Statistical Office), France (INSEE), Italy (ISTAT), China (National Bureau of Statistics), and India (Ministry of Commerce and Industry). These sources were utilized to collect product safety standards, vision impairment prevalence statistics, regulatory approval pathways for contact lenses and medical device classifications, material standards for frames and lenses, distribution channel metrics, and competitive intelligence across prescription glasses, sunglasses, contact lenses, and protective eyewear segments.


Primary Research

In the primary research process, qualitative and quantitative insights specific to the global eyewear value chain were obtained by interviewing supply-side and demand-side stakeholders. Supply-side sources encompassed Chief Executive Officers, Vice Presidents of Product Innovation, Heads of Regulatory Affairs, and Commercial Directors from prominent frame manufacturers (such as EssilorLuxottica, Safilo Group, Marcolin, Kering Eyewear, Marchon Eyewear, and Fielmann AG), ophthalmic lens manufacturers (such as Zeiss, Hoya Corporation, and Shamir), contact lens producers, raw material suppliers (acetate, titanium, and bio-based materials), and OEM/ODM partners who specialize in smart eyewear technology. The demand-side sources included licensed optometrists and ophthalmologists, optical chain medical directors, independent dispensing opticians, procurement heads from multi-brand optical retailers, sunglass specialty store buyers, e-commerce platform merchandising leads, and department store eyewear category managers. Primary research has confirmed pipeline timelines for smart eyewear and sustainable materials, validated product segmentation across prescription, sunglass, and contact lens categories, and gathered insights on omnichannel distribution strategies, prescription fulfillment dynamics, regional pricing architectures, and consumer preference shifts toward customization and virtual try-on technologies.

Primary Respondent Breakdown:

By Designation: C-level Primaries (40%), Director Level (25%), Others (35%)

By Region: North America (40%), Europe (28%), Asia-Pacific (24%), Rest of World (8%)


Market Size Estimation

Global market valuation was derived through systematic revenue mapping and unit volume analysis across optical retail channels. The methodology included:

Identification of over 50 main manufacturers in North America, Europe, Asia-Pacific, Latin America, and the Middle East and Africa, including frame producers, lens manufacturers, and contact lens suppliersProduct mapping encompasses prescription spectacles (spectacle lenses and frames), sunglasses (fashion and corrective), contact lenses (daily disposables, extended wear, and specialty), reading glasses, and safety/protective eyewearA material segmentation analysis that encompasses sustainable wood/bio-based alternatives, metal (titanium, stainless steel, monel), and plastic (acetate, TR90)Analysis of annual revenues for eyewear portfolios, as reported and modeled, disaggregated by distribution channel (optical stores, online retail, department stores, and independent retailers)

Coverage of manufacturers and brands representing 75-80% of global market share in 2024

Extrapolation using bottom-up (procedure volume × average selling price by country, stratified by prescription complexity and lens type) and top-down (manufacturer revenue validation and retail audit data) approaches to derive segment-specific valuations for product type, material composition, end-user demographics, and regional distribution dynamics

Integration of trade association shipment data, retail point-of-sale tracking, and ophthalmic survey statistics to refine market share allocations across luxury, mid-market, and value-tier segments

Download Free Sample

Kindly complete the form below to receive a free sample of this Report

Download PDF ×

We do not share your information with anyone. However, we may send you emails based on your report interest from time to time. You may contact us at any time to opt-out.
















